| Title Midtown, Downtown, and Old Sacramento DUI Analysis | |
|
Author Sacha Selim American River College, Geography 350: Data Acquisition in GIS; Spring 2007 | |
|
Abstract I examined the spatial relationship between the proximity of bars in Midtown, Downtown, and Old Sacramento to the location of DUI infractions during a three-month period. I also compared DUI related statistics between these three neighborhoods. | |
|
Introduction Alcohol, and its consumption in bars, pubs, clubs and restaurants is a socially acceptable practice that goes on each and every day. However, getting behind the wheel of a vehicle after having too much to drink is not only illegal (>0.08% blood alcohol level in the state of California), but also extremely dangerous and quite possibly fatal to the driver and innocent individuals in the area. Three months ago a friend of mine was struck by a drunk driver while riding his bike on the sidewalk of a busy metropolitan street. He was severely injured and underwent surgery, but thankfully he is on his way to making a full recovery. This event had a big impact on me as it directly affected one of my good friend's life; which is why I chose to do my project on DUI data analysis. | |
|
Background In the year 2000, the Sacramento Police Department (S.P.D.) put itself on the cutting edge by hiring InfoCOM to develop an interactive GIS specifically designed for crime mapping analysis. It was the first of its kind in the entire state of California. Two years after it's inception, this service was made available to the public on the S.P.D.'s website. It appears that this service has been widely used by the public, as the counter on the bottom of the disclaimer webpage for this mapping service says it has been accessed approximately 104,000 times since June 4, 2002. According to the 2007 Annual Report of the California DUI Management Information System released by the Department of Motor Vehicles, there were 180,288 drunk driving arrests in the entire state of California during 2005. That number represents a decrease of 2 % from 2003, when there were 183,560 drunk driving arrests. Sacramento County followed this statewide trend and also showed a 13% reduction in DUIs. It dropped from 8,075 in 2003 to 7,172 DUIs in 2005. Although, the overall number of DUIs decreased over this period of time, the number of fatalities that resulted from alcohol related crashes in Sacramento County increased from 48 during 2003 to 62 in 2005. | |
|
Methods Data Collection I started my research by collecting all the addresses for all the bars in Midtown, Downtown, and Old Sacramento. I was able to find most of this information on the Internet; some of the websites I used were: http://midtowngrid.com/nightLife.shtml, and http://www.yellowpages.com. I then utilized Google Earth to cross-reference a lot of the data that I got from the online directories. Once I had compiled a complete list, I had two of my friends that both have extensive knowledge of the Sacramento bar scene review it to help insure the overall accuracy of my data and as well as to fill any gaps. Bar Address Anomalies After collecting all this information and performing several forms of data quality assurance, I found a few errors and anomalies that I would like to discuss here. First, a bar called The Press Club is physically situated on the corner of 21st and P Street. I know this for a fact because it is only a few blocks from my apartment and I pass by it nearly on a daily basis. But all the Internet mapping websites I visited plot its location on the corner of 20th and P. I believe the reason for this inaccuracy is a result of the fact that The Press Club's address is 2030 P Street. The convention used to assign addresses to buildings in Midtown and Downtown where there are lettered and numbered streets is pretty simple. Basically the first two numerals of an address signify the intersecting block on a lettered street. For example, 2100 P Street should be on the corner of 21st and P Street. I am not sure how the city decided to assign The Press Club an address that does not follow this convention, but that is the reason behind the inaccuracy, which I fixed on my map. Other common errors I discovered involved situations in which bars were still listed in numerous directories but no longer in business; or the establishments had changed hands and had reopened under a different name. The only way to truly identify these kinds of errors with 100% accuracy is to visit each and every one in person, which I admittedly did not do, but between myself and my group of friends, we were able to identify several of these types of errors. For example, The Hog's Head Brewery and The Black Pearl were among those establishments that closed their doors for good but were still listed. Twisted 88's, a totally hip, dueling piano bar, which was only open for about three months is an example of the latter type of error in which the business was sold and reopened as a completely new bar, and is now a Spanish dance club called Azucar. After fixing all the aforementioned errors in my data, I compiled a final list of bars and their addresses in Microsoft Excel; I then exported them to a Microsoft Access database file so that I would be able to geocode them in ArcMap. The geocoding process went very smoothly as I was able to achieve a 100% match success rate, but after closer examination I found one error. When ARC Map tried to plot the location of The River City Brewing Company it had some difficulty interpreting its atypical address. This establishment is physically located in the rear of the Downtown Plaza Mall, but when I tried geocoding it, ARC Map placed it at the very front of the mall, right on top of The Hard Rock Cafe. The reason for this error is that both places have the same address: 545 Downtown Plaza. The River City Brewery, however, is in suite 1115 of the mall and ARC Map did not know how to interpret that data so it just ignored it. I decided to omit this bar from my analysis because I could not figure out how to manually place it on the map. The second part of my data set that I needed to collect was the location of all the DUI crimes that occurred in the three neighborhoods. Luckily, as I previously mentioned, the Sacramento Police Department has an interactive crime mapping service on its website that allows virtually anyone with Internet access to plot and view instances of criminal activity. You have the option to choose from fifteen different types of crimes (for example: burglary, murder, or arson). In my case, I am only concerned with the DUI crimes. After selecting the type(s) of criminal infractions the website prompts you to enter in a date range for which you'd like the crimes to be reported in. When I started this project the parameters were such that the range had to be within the 2006 calendar year, but they have since extended it to go as far as March 31, 2007. The range also can be no longer than three months in length. After choosing the timeframe, you have to select a neighborhood in order to narrow down your search area. | |
|
Results When entering in my query I decided to use the maximum three month timeframe (10/1/2006-12/31/2006) because otherwise I don't think there would be enough data to perform meaningful analysis on. After entering in the date range I selected Midtown as the neighborhood. There were a total of 16 DUIs in this area. Next I looked up the Downtown Sacramento neighborhood, which had 23 DUIs and lastly, I pulled up Old Sacramento, which had 7.
One note of interest, the maps and reports generated by the police department's website only provided the nearest intersection of the cross streets where each DUI occurred. After querying the three previously mentioned areas I extracted the "location," "report number," and "date" of each infraction from the reports and copied them into an Excel file. I then had to convert the cross street locations into actual addresses (for example 27th & P St. translated into 2700 P St.) in order to geocode them. This conversion process went surprisingly smooth, as I was able to attain a 98% match success rate when geocoding the DUI addresses. There was only one unmatched address, 2900 N street. After further examination, I discovered the reason behind this unmatched address was because there is an onramp to the Capitol City Freeway at this particular intersection. I was able to eventually get ARC Map to place this DUI point by bringing down the interactive geocoding address matching tolerance level. Because the police department only provides the closest street intersection for the DUI arrests, it appears that they all took place only on street corners, when in actuality they could have occured at any point along the length of the street. Geocoding Notes Two of the DUIs provided by the Sacramento Police department's map were not situated on an actual street and when I clicked on them they did not display a location, as all the others did. To be entirely honest I do not know how this kind of thing happens, unless the drunk drivers went off the road. The first one I found like this occurred on 10/2/2006 between P & Q and 2nd and 3rd streets. The second one occurred on 12/13/2006 and was located between 28th and 29th next to Sutter's Fort. I omitted these two DUIs from my map and analysis because I could not geocode them without an address location. Also of note, a few cross-streets had multiple DUIs occur on their corners during the course of the three month period I analyzed. Initially when I created my map I used a single circular point (size 4) to represent a DUI, so it appeared that there was only one DUI infraction in these locations. This illusion was created because the points were stacked on top of each other, when in actuality there were multiple DUIs in these spots. After doing some research on crime mapping I came across The Manual of Crime Analysis Map Production, which outlined a way to eliminate this confusion. It suggested increasing the symbology point size for areas that have multiple instances, which I incorporated in my final map. The corner of 7th and J Street had three DUIs on it, one on 10/13/2006 another on 10/15/2006, and a third one on 12/31/2006. There were three DUIs on the corner of 2nd and J Street, one on 10/28/2006, another on 11/17/2006 and a third on 11/26/2006. Lastly there were two DUIs on the corner of L and Front Street, one on 11/12/2006, and another on 12/2/2006. General DUI data is public information, which is why I was able to get access to it in the first place. However it is only available from one source, the police department. Because of this I was unable to corroborate the location of any of the DUI infractions and just had to trust that all the information they provided on their website was correct. | |
|
Figures and Maps
 |
|
|
Analysis When starting this project, I hoped to show a correlation between the presence and close proximity of bars to the occurrences of DUIs in the immediate area. My first step in attempting to prove this hypothesis was to create a buffer around each bar on my map. I contemplated for a while what exactly constitutes close proximity. I concluded that since my map covers a relatively small area, I decided to use a one block (approximately 430 feet) circular buffer around each bar. Next, I performed a 'selection by location' query in order to isolate all the bars that were encompassed by at least one buffer. The resulting data seemed to loosely support my thesis. Twenty-one out of the 46 total DUIs were within a one block radius of at least one bar, which is 46%. When you consider how much of the area is not within a one block radius of a bar, 46% is somewhat of a significant number. Granted, it is not an overwhelming statistical correlation that makes a definitive case to prove my hypothesis, but enough to be noteworthy.
I then broke down the data by neighborhood and found that Old Sacramento had 5 of it's 7 DUIs (71%) occur within a one block radius of a bar. Midtown on the other hand only had 4 of its 16 (25%) DUIs fall within the buffer zone. While Downtown, had 12 of its 23 DUIs occur within on block radius of a bar, or just under 50%. 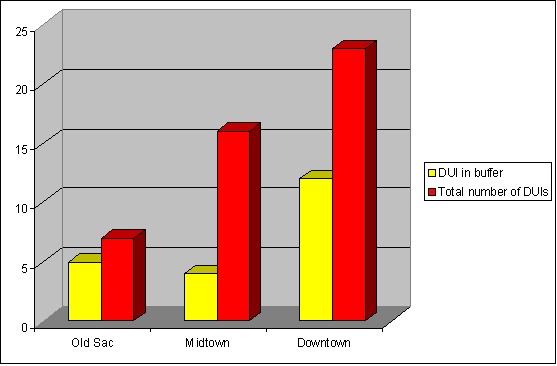 After analyzing the map for instances that met the above criteria, I took a more macro view and I noticed that 50% of the DUIs occurred near a highway. Twenty-three out of the 46 total DUIs were within three blocks of a highway. There specifically were 8 DUIs by Interstate 80 and 15 by Interstate 5. I was also curious what the ratio of DUIs to bars were in each neighborhood, so I ran a comparison. Old Sacramento had 7 DUIs and 7 bars, Midtown had 16 DUIs and 38 bars, and Downtown had 23 DUIs and 30 bars. 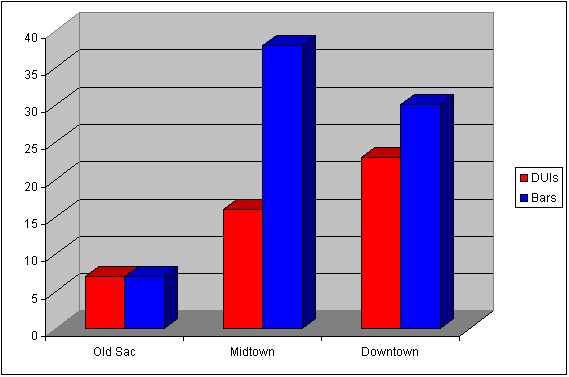 | |
|
Conclusions After collecting and analyzing the data for this project I was unable to definitively prove my hypothesis. However, I was able to find a loose correlation between the presence and close proximity of bars to the occurrences of DUIs in the immediate area. This quasi relationship is supported by the fact that 21 out of 46 total DUIs or 46% occurred within one block of a bar. These statistics suggest that a potentially large portion of these DUIs were a result of people drinking enough alcohol at these establishments to impair their driving reflexes.
In conclusion, based on my research data, I would advise police departments to focus more of their efforts in catching drivers under the influence in areas within a one block radius of bars. Please don't drink and drive. | |
|
References Costello, Becca. "Cops and their toys." News and Review. 2000. <http://www.newsreview.com/reno/Content?oid=oid%3A2731> "Sacramento County Statistics." Office of Traffic Safety. 2005. <http://www.ots.ca.gov/campaign/2006/duicrackdown/stat_SacramentoCntyDUI.asp> Valverde, George. "2007 Annual Report of the California DUI Management Information System." Office of Traffic Safety. 2007. <http://www.ots.ca.gov/Publications/pdf/DMV_DUI_MIS_Report_2007.pdf> Velasco, Mary and Rachel Boba, PhD. "Manual of Crime Analysis Map Production." Office of Community Oriented Policing Services. 2000. <http://www.cops.usdoj.gov/mime/open.pdf?Item=611> |