Title
Levee Failure and Inundation In Sacramento!
Author
Alfonso Velazquez
American River College, Geography 350: Data Acquisition in GIS; Spring 2007
Abstract
This paper discusses the risk of a flooding experience in Sacramento area due to a levee failure.
Introduction
Sacramento is part of a natural floodplain and uses levees and sophisticated drainage systems to protect the City from the waters of American and Sacramento Rivers and local creeks and streams. While a 100-year level of protection protects much of Sacramento, there is still a 1-in-100 chance each year that the City will experience flooding. That means that there is a 26% chance in the course of 30-year mortgage that your home will be flooded. The Sacramento Area Flood Control Agency (SAFCA) was formed in 1989 to address the Sacramento area’s vulnerability to catastrophic flooding. SAFCA’s mission is to provide the region with at least a 100-year level flood protection as quickly as possible while seeking a 200-year or greater level of protection over time. It is my intention to study a levee failure and its effects in Sacramento Area. How close are we to the next flooding experience? Is the levees maximum design capacity greater than the flow in a flood control project? With the use of GIS Software and levee failure data we will explore these questions as we look at the levee failure in Sacramento Rivers.
Background
In February 1986, the American River system experienced the largest flood of record. The peak discharge in the lower American River was a record 130,000 cfs, the estimated safe capacity of the levee system and the largest flow since the construction of Folsom Dam. In addition, the Sacramento and Feather Rivers were also experiencing high flows. The Fremont Weir, located on the west side of the Sacramento River just downstream of the Feather River junction, had a peak flow of 355,000 cfs and the Sacramento Weir, located on the west bank of the Sacramento River, passed a peak flow of 125,000 cfs, both exceeding the design flows of 343,000 cfs and 112,000 cfs, respectively. The flow of the Sacramento River at the I-Street gaging station located near downtown Sacramento was approximately 108,000 cfs, just below the estimated 100-year flow of 110,000 cfs. The Yolo Bypass at Lisbon, 6 miles south of interstate 80, was approximately 532,000 cfs which exceeded the design flow of 490,000 cfs. The sum of these two flows, 640,000 cfs, was the estimated flow past Sacramento during February 1986. Because the record flows caused flooding in and around Sacramento and damage to many of the levees in the area, the Corps of Engineers was required by Congress to perform a comprehensive analysis of the long term integrity of the flood control system of the Sacramento River and its tributaries. In may 1988, the Corps of Engineers issued an initial appraisal report evaluating the flood control system for the Sacramento Urban Area. This report examined approximately 110 miles of levees in the metropolitan area which protect an estimated 330,000 people and billions of dollars worth of damageable property. The report, in conjunction with the peak flows and damage that occurred during the 1986 flood, prompted the City of Sacramento to request that Boyle Engineering prepare inundation maps for possible levee failure sites within the city limits for use in the preparation of emergency evacuation plans.
| Current River and Stream Conditions "Today's Flood Threat" "American River Conditions"
|
|

Methods
| Sacramento Flood Threat
Sacramento's risk of flooding is the greatest of any major city in the country. Sacramento faces an unacceptably high risk of flooding for two primary reasons: 1. The cores of today’s levees are often the levees built by farmers and settlers as much as 150 years ago. Early levees were not constructed to current engineering standards, and little care was given to the suitability of foundation soils. These remnants of the past make today’s levees unreliable. To address this issue, levee improvements to strengthen levees and to make them less susceptible to seepage induced failures are a major portion of SAFCA’s efforts to reduce the risk of flooding in Sacramento. 2. The quantity of water flowing out of the Sierra Nevada mountains during large floods appears to be increasing. Folsom Dam was designed to reduce flood flows in the American River to a flow rate that could be safely carried by the downstream levees. Construction on Folsom Dam began in 1950. In designing the Dam, engineers used historic flow records and statistical analysis to predict the size and frequency of occurrence of large floods. From those predictions they determined how much space must be available in Folsom Dam to store excess flow from a flood with one chance in five hundred of occurring in any given year. |
The graphic above shows the relative size of large floods over the past 100 years. |


Results
Failure Floods
The levee failures were assumed to be caused by a 100-year event. The floods used in this analysis were developed by the Corps of Engineers for use in the 1989 Flood insurance Study of the City of Sacramento. The 100-year Sacramento River flood was based on an adjusment of the documented 1986 flood profile as discussed in a Corps of Engineers position paper, dated december 1988. The 100-year flood for the lower American River was revised by the Corps of Engineers using the hydrolic information available through 1986 and the latest operating criteria for Folsom Dam.The 100-year floods for the Natomas East Main Drainage Canal and Arcade Crek were developed by the Corps of Engineers using available stream flow and rainfall data to estimate runoff.
As was previously discussed, some levees are subject to the backwater effect of a major river. This is the case for both Arcade Creek and the natomas East Main drainage canal which are tributaries of the American River. For these channels, levee failure can be caused by either the natural 100-year flood or by the high water levels caused by the backwater effect of the American River. For this investigation both floods were determined for the five failure sites above the mouth of the natomas East Main Drainage Canal and the more severe flood for each site was used in the levee failure analysis.
Breach Failure
The levee was assumed to fail instantaneously down to the elevation of the landside toe of the levee. the toe elevation was estimated from USGS 7-1/2 minute quadrangle maps for each failure site.
The height of the water surface at failure was assumed to be the high water mark reached during the 1986 flood for the Sacramento River, the Natomas Main Drainage Canal and Arcade Creek. For the American River and the portion of Arcade Creek and the portion of Arcade creek and the natomas East Main Drainage canal influenced by the backwater effect of the American River, the levees were assumed to fail when the flow in the American river exceeded the estimated the estimated safe channel capacity of 130,000 cfs.
The relationships between water surface elevation, storage capacity, and outflow for the various flood basins below the failure sites were defined and the maps were planimetered at 5-foot intervals following USGS contour elevations. The storage capacity between elevations was computed as the average of the two end areas times the difference between the elevations. The area of the bottom elevation, if assumed to be lower than a USGS contour, was assumed to have one-half the area of the lowest USGS
contour.
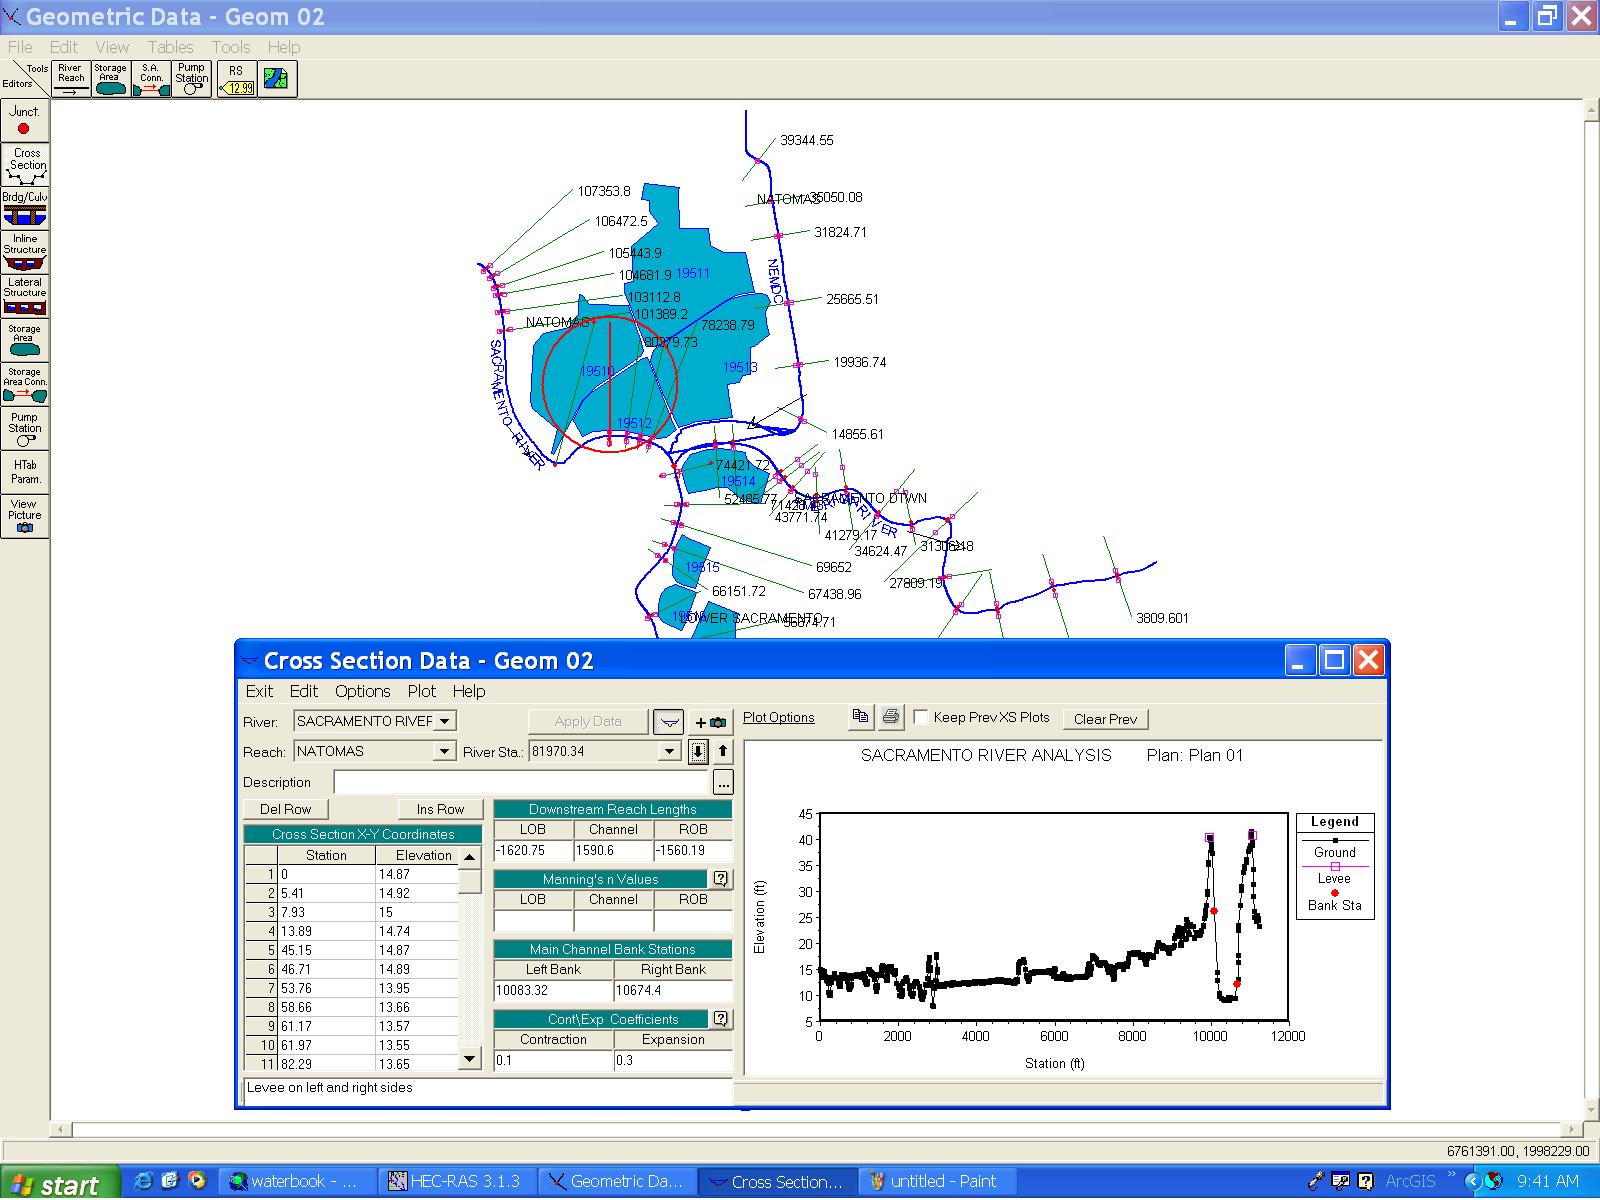

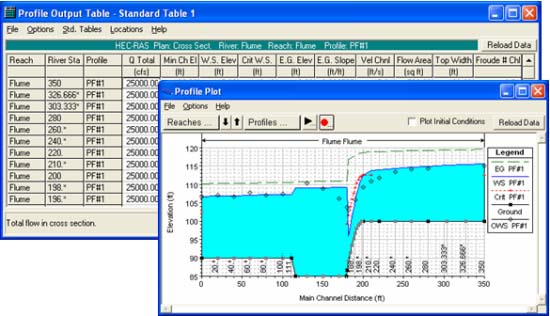
The graphics above represents a cross section of Natomas and pocket area, it was obtained using HEC-2 (river hydraulics) Software. The red circle shows the area where the section was taken from, and the red line represents the alignment for the croos section.
Figures and Maps

Analysis
| For the
Analysis that Corps of Engineers performed, two situations existed that
required different analytical methods. The first situation, which is the
normal case and applies to most of the studies in the investigation, is
where the levee failure is due to the flood that occurs naturally in the
stream channel. For this case, the flood hydrograph in the channel was first
computed at the location of the assumed failure site. The hydrograph was
then divided between the downstream river channel and the breach using "XRATE",
the Corps of Engineers computer model reviewed and discussed under the
initial task Order of the Levee certification contract by Boyle Engineering
Corporation. The breach outflow was then routed through the area below the
breach using the Modified-Plus routing method to account for storage and
travel time effects. The output of the "XRATE" model was used to create time
verses water surface elevation tables, which were used to determine the area
that would be inundated due to the levee failure, for the flood basins below
the breach. The second situation occurs when a possible levee failure site
is subject to the backwater effect from a flood on a major river. For this
situation, a relationship between the water surface elevation in the river
and the breach outflow at the failure site was established using "HEC-2",
the Corps of Engineers water surface profile model. From this relationship,
a breach outflow hydrograph was developed based on the 100-year flood
hydrograph of the major river. this hydrograph was then compared to the
breach outflow hydrograph that would be developed from the occurrence of a
local 100-year flood at the failure site. The larger of the two hydrographs
was used in the analysis and routed through the area below the failure site
using the "XRATE" model as discussed above.
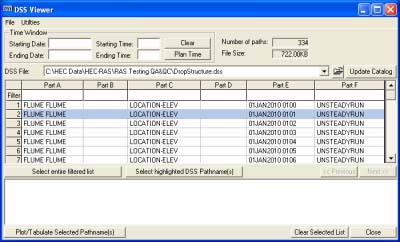
Data Storage and Management
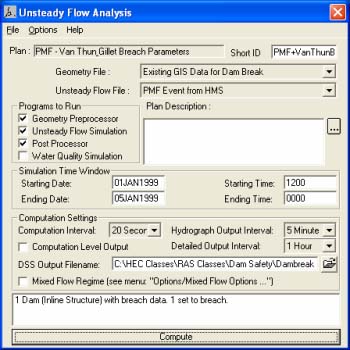
Unsteady Flow Simulation
Graphics and Reporting |
Conclusions
In general, for all failure locations, the area below the breach will have a cero response time and there will be substantial damage and probable loss of life. Although it can not easily be shown on the maps, the streets will be the first areas flooded since they are generally lower than the surrounding ground elevation and offer the least resistance to the flow. The concentration of the initial flow in the streets will cause a major impact on evacuation alternatives and to emergency response actions.
Sacramento Flood Maps
The City and County of Sacramento have prepared detailed maps showing hypothetical levee breaks, inundation levels and the time it would take for waters to rise in affected neighborhoods, and rescue and evacuation zones. The breaks on these maps are hypothetical and do not indicate a weakness in the levees at that particular location.
One shows where the water would flow over time and how deep it would get given the hypothetical flooding scenario. Each sample levee break location represents a hypothetical failure along that general stretch of levee.
They do not depict known weak points or other issues that suggest a break would occur there versus anywhere else.
Links to those maps are listed below
Natomas 1 Depth
Map
Rescue Map
Natomas 2 Depth
Map
Rescue Map
Natomas 3 Depth
Map
Rescue Map
Natomas 4 Depth
Map
Rescue Map
Natomas 5 Depth
Map
Rescue Map
Arcade 1 Depth
Map
Rescue Map
Arcade 2 Depth
Map
Rescue Map
Downtown 1 Depth
Map
Rescue Map
Downtown 2 Depth
Map
Rescue Map
Campus Commons 1 Depth
Map
Rescue Map
Campus Commons 2 Depth
Map
Rescue Map
Arden Depth
Map
Rescue Map
River Park Depth
Map
Rescue Map
Sacramento State Depth
Map
Rescue Map
South Sacramento Depth
Map
Rescue Map
Mayhew Depth
Map
Rescue Map
Goethe Depth
Map
Rescue Map
Pocket Depth
Map
Rescue Map
References
"Sacramento River Flood Control System Evaluation - initial
Appraisal Report - Sacramento Urban Area." U.S. Army Corps of Engineer -
Sacramento District, Sacramento, california, May 1988
"Summary Report - Initial Coordination and Review Work Task." Boyle Engineering
Corporation, Sacramento, california, february 1989.
"Office Report, Levee Stability, Sacramento River Flood Control System
Evaluation, American River Levees," U.S. Army Corps of Engineers - Sacramento
District, Sacramento, california, July 1988.