| Title Can GIS Help Planners Understand the Relationship Between Neighborhoods and School Performance? | |
|
Author David Illig American River College, Geography 350: Data Acquisition in GIS; Fall 2007 Contact Information (david.illig@cdcr.ca.gov) | |
|
Abstract This paper explores whether state or regional education entities can use GIS mapping to support school performance improvement efforts. This approach codes schools according to their ranking on the state Academic Performance Index, which is used to measure school performance. A neighborhood distress index (NDI) is created using Census tract-level income and demographic data from the 2000 census to identify disadvantaged neighborhoods. Combining the school performance data to the NDI map layers identifies clusters of low performing schools and their relationship to disadvantaged neighborhoods. Finally, the paper examines whether information about local service centers can identify resource needs for the target neighborhoods. The paper concludes that mapping can provide useful support to community improvement planning efforts, however, public and private state and local service entities must engage in efforts to make available locations of public and private service centers and begin identifying informal social capital in the target neighborhoods. | |
|
Introduction California’s K-12 education system is under intense scrutiny due to on-going concerns about underperforming schools. National achievement tests administered by the US Department of Education consistently show that California students perform below national averages. Achievement tests administered by the California Department of Education also show wide variation in school level performance across California’s schools. Many factors affect individual school performance. One factor is site staffing since effective teachers and effective support staff and administrators can improve student performance. Another factor is the overall school district capacity to support student improvement through support of teachers, site administrators and support staff. A third factor is state governance of the school system including adequate financing of schools and schools. Finally, composition of the student body, including the role of families or adult guardians and neighborhoods within which schools operate can affect school performance. Sorting out the relative importance of these factors is complex because there are significant interactions among these factors. This paper focuses on the question of whether Geographic Information Systems can provide value to state and local education agencies planning and developing school reform efforts. | |
|
Background California allocated $54.6 billion (federal, state, and property tax funds) to educate more than 6 million children during the 2006-07 state fiscal year (Department of Finance, 2007). A recent study notes that California spent about the same per student as Texas and Florida -- $8,074 per student in academic year 2004-05 (Loeb, Bryk, Hansuhek, 2007). This spending was about $630 dollars less than the average state spent per child that year. When adjusted for the cost of living (ultimately, a somewhat qualitative process), Texas spends about 12 percent, Florida spends about 18 percent, and the rest of the country spends about 30 percent more per child than did California. The 2005 National Assessment of Educational Progress – a national achievement test used to assess school performance and designed to allow comparison of children’s test score across states– shows California performing near the bottom on every measure (Loeb, Bryk, Hansuhek, 2007). California introduced a school accountability program in 1999 and began reporting a school-level Academic Performance Index (API) scores by school and by race-ethnic, English learner, and students with disabilities sup-groups. The API primarily aggregates test scores from California’s individual achievement testing program known as STAR weighted by various means to create an index ranging from 200 to 1,000 (CDE, March 2007). The purpose of this program is to support development of school improvement goals (known as growth targets) for all schools with API scores below 800. The lower a school’s API score is relative to the “800” threshold, the greater the annual improvement target (CDE, August 2007). The CDE releases annual reports on the API results. The reports provide summary API information on each school that has sufficient test takers, the school’s decile rank, it’s rank among schools with similar student characteristics, the school’s growth target, and sub group APIs and sub-group growth targets. The underlying dataset is available for download and analysis from the CDE web site. The CDE also produces an annual report that summarizes correlations between school level and sup group API scores and various socio-demographic characteristics of the children and their families attending each school. Those analyses identified statistically significant positive correlations between parent education level and student performance. The report also reports significant negative correlations between economically disadvantaged students (measured by participation in the free or reduced price lunch program), measures of student mobility (movement between schools), English learner status, and African American or Hispanic race/ethnic status and API scores (CDE, May 206). One recent literature review notes that measures of disadvantage such as behavioral problems, violence, poor health, low educational attainment, low income, and single parent families tend to cluster in neighborhoods (Pebley and Sastry, February 2003). Parsing out the independent effect of neighborhood characteristics on child development, however, is a relatively recent area for study (Pebley and Sastry, February 2003). Some recent studies describe these effects in terms of socialization models, lack of social capital, or social disorganization theory (Pebley and Sastry, February 2003, Bowen, Bowen, and Ware, 2002). Another recent study identified a significant relationship between poor school performance in the Washington DC school system and high poverty rate neighborhoods (Rolland, November 2006). These associations must be kept in perspective due to the complex nature of the pathways and mechanisms described. For example, supportive families in otherwise disadvantaged neighborhoods can offset the neighborhood effects identified. Also, poverty, while highly correlated with other measures of disadvantage, is not by itself a guarantor of poor outcomes. | |
|
Methods This paper sets out to determine whether use of Geographic Information Systems can provide insights into the effects of neighborhoods on school achievement. I explore this issue by using publicly available data sets. The CDE makes available on their web site significant demographic and school accountability information at the school and grade level. These data are available for download. While all schools are in the files, some schools do not have sufficient test-takers to allow for construction of an API for that school, thus accountability information for those schools is absent. These schools primarily are district- or county-operated schools for children in the juvenile justice system, or for children unable or who choose not to participate in a regular school (known as continuation schools). The school site dataset contains both address and geographic coordinate information for each school site. The annual API score datasets include API scores and aggregate demographic information about parents and families at each school. I used Microsoft Access to create a query table for all open schools with reported API scores in the eight-county Sacramento region – Sacramento, Amador, El Dorado, Placer, Nevada, Sutter, Yolo, and Yuba counties. These data were projected into a common coordinate system for use in ArcMap. The 2005 API score for each school was broken out into three groups -- the bottom three deciles were coded in red, the top three deciles were coded in green, and the middle four deciles were coded in yellow. Figure 1 displays the result. I downloaded Census Bureau socio-demographic information at the Census tract level to neighborhood measures of disadvantage characteristics. As discussed above, disadvantaged or disorganized neighborhoods appear to have some independent influence on child development including school performance. It is important to note that resident’s notion of what constitutes a neighborhood often differs from the demographic units used by the Census Bureau. While techniques exist for interpolating Census unit data into other geographic areas, Census tracts work well for this exploratory exercise. This study uses five neighborhood (defined by Census tracts) disadvantage measures to classify neighborhoods as more or less disadvantaged. The variables used are: poverty rate, unemployment rate for individuals 16 or over, percent of individuals over 24 with less than a high school education, single parent families with children under 18,and housing rental rate. After sorting the Each variable was broken into five equal classes, ranked from highest to lowest, and recoded with values from 4 to 0. Figures 2a and 2b provide examples of these breakouts for poverty rate and less than high school education. The five recoded variables were summed and classified into four groups. The 25 percent of Census tracts with the highest composite score represent the most disadvantaged neighborhoods. Figure 3 reveals the composite index using dark brown to represent the most “disadvantaged” neighborhoods and yellow to designate the least disadvantaged neighborhoods. Figure 4, shows the schools data superimposed on the composite neighborhood index data from Figure 3 now focused on Sacramento County. Figure 5 adds in some community resource information to provide an idea of how such data can be used to support new or on going community planning efforts. |
Results Figure 1 shows the distribution of school sites across the eight-county study area. It is clear from this Map that the low performing 30 percent of schools (in red) and the high performing 30 percent of schools (in green) tend to cluster in different areas. The middle 40 percent of schools (in yellow) are more disbursed across the region.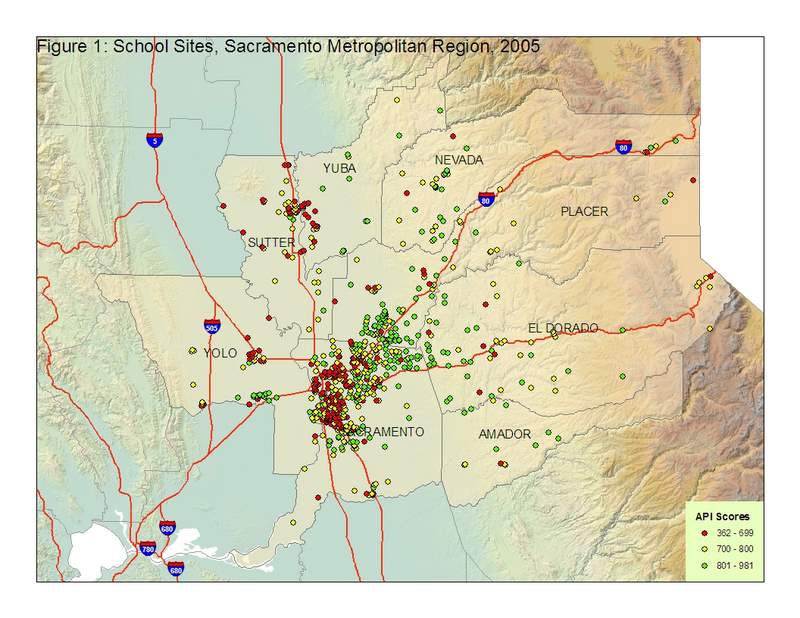 Figures 2a and 2b provide information about distribution of two of the five neighborhood disadvantage indicators. As these Maps reveal these are some areas where the two measures overlap as well as areas where there is some differences in areas with the highest poverty rates and lowest high school graduation rates. Figure 3 reveals the combination of the five indicators after recoding the variables and adding them to create the neighborhood disadvantage index. The composite index clearly shows clustering of disadvantaged areas and advantaged areas. 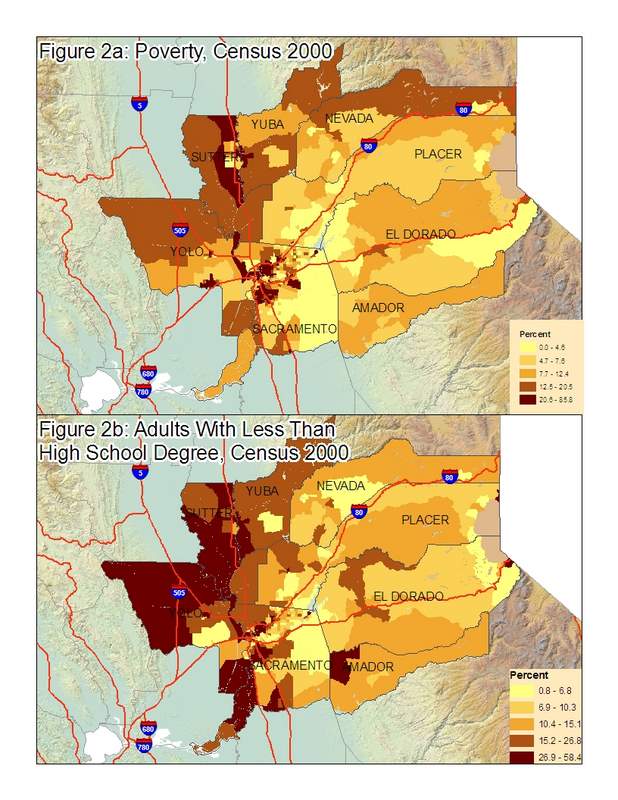 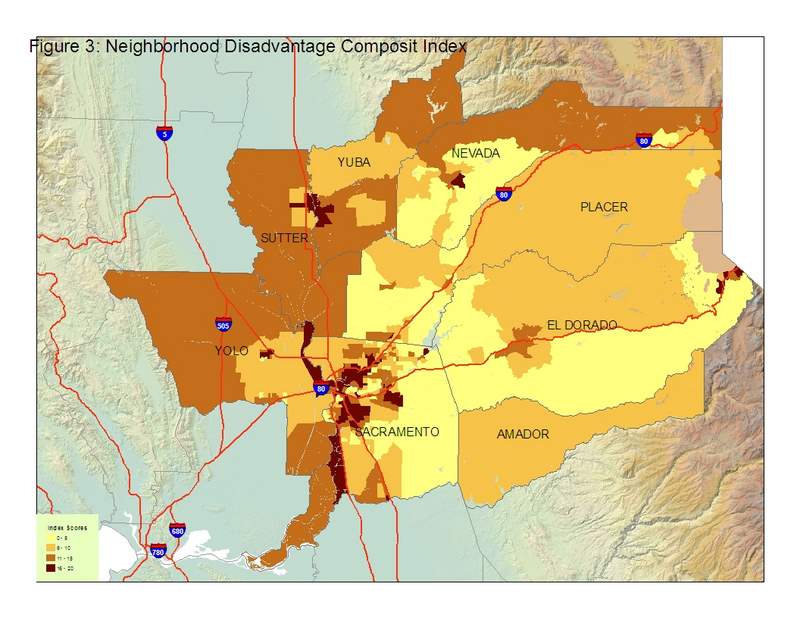 Figure 4 combines information from the composite index and school sites. The scale was increased to focus on the urbanized part of Sacramento County. Examination of the regional map would show clusters of low or high performing schools in urban areas. These clusters low and high performing schools show a marked degree of correlation with areas of high or low disadvantage respectively. Perhaps the most interesting feature of this map is that within the disadvantaged areas of Sacramento there are scattered schools in the middle range of API scores. Because of the distribution of scores in the eight-county region, the middle 40 percent of schools have scores that are within 100 points of the 800 API high performing school threshold. Further analysis of these schools is needed to determine whether they are moving closer to 800 or away from it. 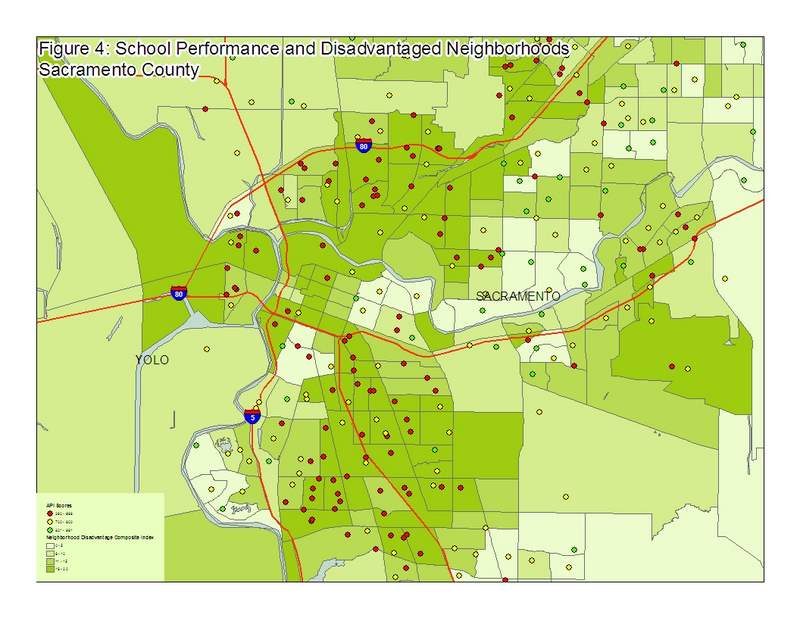 Figure 5 presents an initial effort to map resources planning groups in disadvantaged neighborhoods could call on to help support neighborhood improvement efforts. The community resources mapped are from three sources. The Office of Statewide Healthcare Planning and Development (OSHPD) maintains the health care facility data, Sacramento County maintains the fire and police safety resource data, and the Census Bureau maintains the church data used for this study. These datasets were readily available for this study. Many other important public and private, state and local health and social service, employment training and development, behavioral health, and community resources would need to be included in mapping to support community improvement planning efforts. 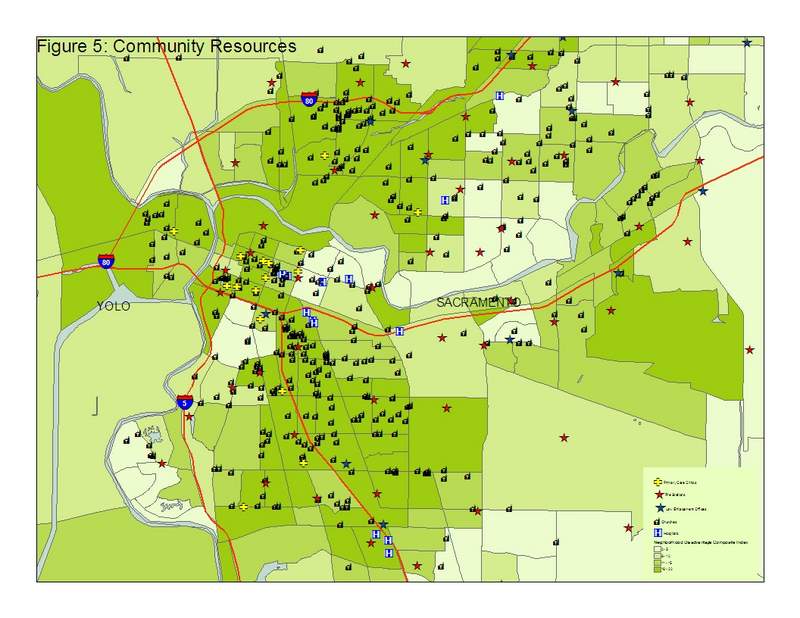 |
Analysis Exploring school performance in the context of disadvantaged neighborhood within the Sacramento region suggests it is feasible for state and local education entities to use mapping such as that used in this study to support school improvement efforts. Identifying disadvantaged neighborhoods using census data is a promising way to obtain a general picture of the social geography surrounding school sites. Coding school sites to reflect relative performance on the API provides a clear indication that neighborhoods might influence school performance. From the regional or state perspective, such mapping helps identify clusters of poorly performing schools. Identification of clusters suggests an opportunity to take a more systems focused approach to school improvement.Preliminary mapping of public and private social assets within disadvantaged communities suggests that mapping can support neighborhood level school improvement, as well as other, planning efforts. The relatively limited amount of such data readily available at the state or regional level for use in mapping applications suggests that state and local governmental entities should collaborate to organize and publish facilities and resource data in a form that allows for easy access to mapping software. The current study also uncovered some challenges. One challenge is that the Census data used are from the 2000 census. These data are now eight years old. The school site data is from the 2005 API index report. While differences in the timing of data collection can dilute the analysis as communities change over time, most neighborhoods remain relatively stable over the time frame of these data. As the American Community Survey replaces data from the decennial census beginning in about 2012, this should be less of an issue. Second, the school site data used in this study relied on latitude and longitude information in datasets from the CDE website. It became clear that a portion of the school sites had incorrect longitude and or latitude information. This reduces to an unknown degree the overall accuracy of the school site information. One alternative is to geocode each address also provided in the CDE school site database. Also, if these data come into regular use for mapping purposes, the CDE should consider auditing the latitude and longitude fields in their school site data. Finally, local governments and private, non-profit community based organizations play important roles in service delivery in disadvantaged communities. Thus, detailed neighborhood improvement planning efforts must include leadership from these entities when organizing formal and informal service delivery and social capital resident in targeted communities. These entities also might want to consider taking the lead in making available to the public community level information in formats compatible with mapping software to support planning projects. |
|
Conclusions This study found that notwithstanding limitations of available data, it is feasible to use GIS techniques to reveal local and regional associations between school performance and neighborhood advantage or disadvantage. Wider use of mapping to illuminate local and regional service delivery needs and their impact on important social goals should put pressure on various state and local service providing entities to collaborate to make available appropriate data at the neighborhood level for use in public and private planning projects. Current projects to improve access to employment and health care, reducing parolee and probationer return to prison, and improving school performance all rely on better understanding of the effect of neighborhoods on resident life outcomes. Some of these data already exist in compatible formats but are not readily available. State and local governmental entities should consider developing common standards and approaches for making pertinent neighborhood level available to the public. | |
|
References Bowen, Natasha, Gary Bowen, and William Ware, September 2002. Neighborhood Social Disorganization, Families, and the Educational Behavior of Adolescents. Journal of Adolescent Research, 17(5): 468-490. California Department of Education, August 2007. 2007 Growth Academic Performance Index Report Information Guide. Accessed December 1, 2007 http://www.cde.ca.gov/ta/ac/ap/documents/infoguide07g.pdf. California Department of Education, March 2007. Overview of California’s 2006–07 Accountability Progress Reporting System. Accessed December 1, 2007 http://www.cde.ca.gov/ta/ac/ay/documents/overview07.pdf. California Department of Education, May 2006. Descriptive Statistics and Correlation Tables for California’s 2005 School Characteristics Index and Similar Schools Ranks. Accessed December 1, 2007 http://www.cde.ca.gov/ta/ac/ap/documents/tdgreport0506.pdf. California Department of Finance, 2007. Governor’s Budget Proposal, 2007-08 accessed December 1, 2007 http://www.ebudget.ca.gov/pdf/GovernorsBudget/6000/6110.pdf. Loeb, Susanna, Anthony Bryk, and Eric Hanushek, March 2007. Getting Down to Facts: School Finance and Governance in California. Institute for Research on Education Policy and Practice, Stanford University, for Governor’s Committee on Education Excellence. Accessed December 1, 2007 http://irepp.stanford.edu/documents/GDF/GDF-Overview-Paper.pdf. Anne R. Pebley and Narayan Sastry, February 2003. Neighborhoods, Poverty and Children’s Well-being: A Review. Russell Sage Foundation. Accessed on December 1, 2007 http://www.russellsage.org/programs/main/inequality/050516.975023. Rolland, Stacey, November 2006. Disparities in the District: Poverty Is Major Cause of Social Problems in the District of Columbia. DC Fiscal Policy Institute. Accessed on December1, 2007 www.dcfpi.org. |