Estimating
Stream Power with GIS: A
Abstract
The GIS method described in this paper may be a cost effective way to screen
out streams that are vulnerable to erosion and prioritize areas to follow up
with rapid geomorphic assessments. Detailed
analysis can then be conducted on the vulnerable stream reaches, followed by the
design of specific land use, flow control and instream
measures. This GIS based approach will
probably save money in the long run for field work and data analysis.
Introduction
The State Water Control Board, Division of Water Quality is charged with ensuring that all land disturbance projects do not cause accelerated erosion in stream channels. Erosion is a natural process but accelerated erosion causes habitat loss, increased water treatment costs, and decreased flood capacity. The Water Board currently lacks a watershed-level method to assess which streams are susceptible to accelerated erosion. This project is an attempt to use GIS to determine erosion susceptibility on a watershed scale.
Background
Stable, naturally functioning streams are in balance with sediment supply and
flow such that they do not aggrade or degrade over
time. Figure 1 shows a generalized
relationship indicating stable balance.
Figure 1 – Lane’s Relationship
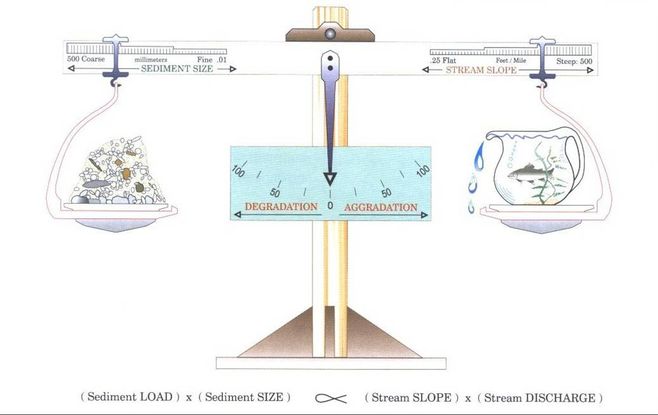
From Rosgen (1996)
Urban development generally increases the amount of rainfall that ends up as runoff and increases the amount of erosive energy in stream channels (Figure 2).
from OEHHA website
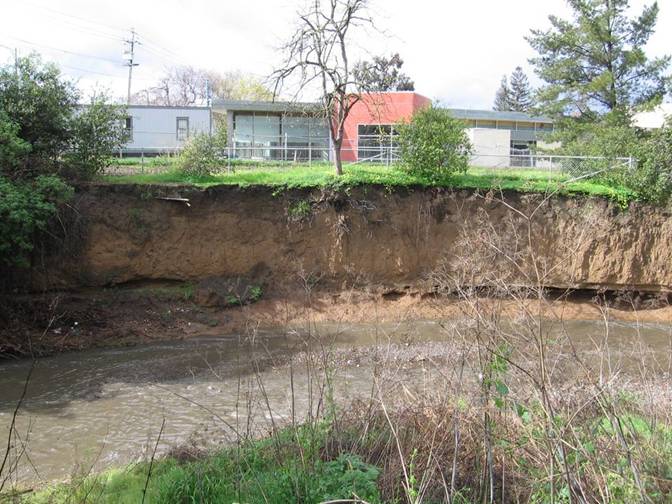
This increase in erosive energy can cause stream channels to incise (bed lowering) and widen, leading to severe accelerated erosion and habitat decline (Figures 3 and 4).
Figure 3 - Stream channel incision
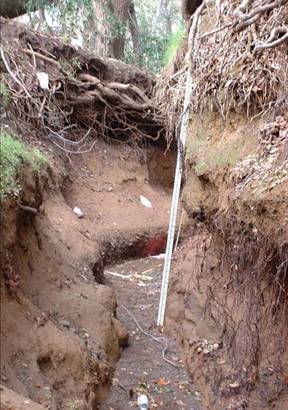
Figure 4 – Stream channel widening
Perhaps more than any other single parameter, specific stream power has been suggested as a comprehensive descriptor of the overall erosive force of water in stream channels (Bledsoe and Watson 2004, Schroder 1991). Specific stream power is the product of stream slope and the square root of the effective discharge (assumed to be the 2-year recurrence interval storm) and has units of watts per square meter of channel (W/m-2 ). These authors have suggested a boundary for stable/unstable streams of 35 W/m-2
W = s Q0.5
These parameters can be estimated in GIS using readily available data. The GIS method described in this paper may be a cost effective way to screen out streams that are vulnerable to erosion and follow up with rapid geomorphic assessments to check results. Detailed analysis can then be conducted on the vulnerable stream reaches, followed by the design of specific land use, flow control and instream measures.
Methods
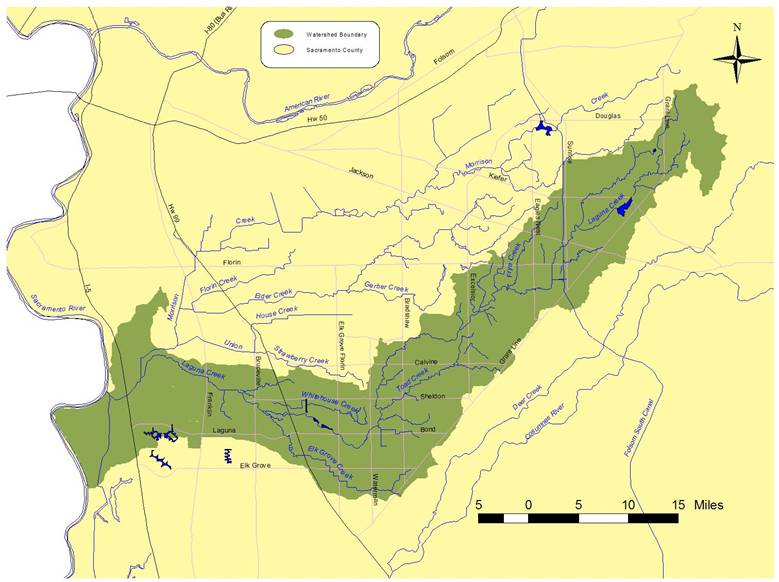
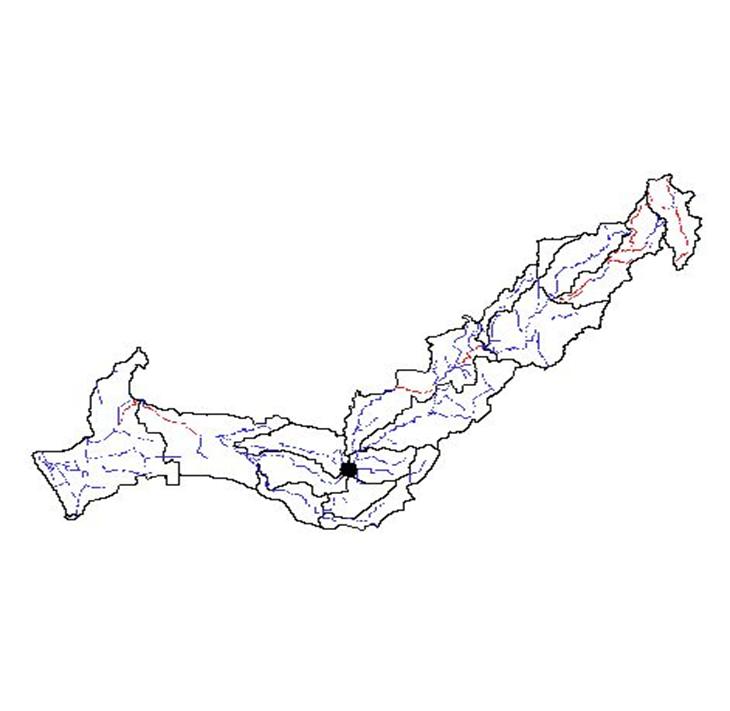
The following methods were used to estimate specific stream power within the
Laguna Creek Watershed in south
Figure 5 – Laguna Creek Watershed
Stream slope
1. Obtained Laguna Creek
watershed shapefile from Laguna Creek Watershed
Council.
2. Obtained the 10 meter DEM for
3. Used Spatial Analyst to calculated slope in percent.
4. Obtained National Hydrography Dataset NHD 1:24,000
data from Water Board GIS holdings.
5. Clipped NHD dataset to represent Laguna Creek Watershed.
6. Calculated stream slope using Zonal Statistics.
Discharge
1. Established the drainage area/discharge
relationship for the project area using all gages in
2. Used Spatial Analyst to fill sinks in the DEM and calculate flow direction
and flow accumulation.
3. Divided flow accumulation grid by 10,000 to get the area draining to each
cell in km2.
4. Used Math Commands to multiply flow accumulation grid by drainage
area/discharge relationship and calculate square root to get the 2-year
discharge to each cell.
Stream Power
1. Multiplied stream slope by discharge to get stream
power.
2. Classified stream segments into 2 categories: 0-35 W/m-2 and >
35 W/m-2
Results
Figure 6 shows the Drainage area Discharge relationship for the 14 gages that
had more than ten years of record.
Figure 6 – Discharge vs.
Drainage Area for
The results of the stream power
analysis indicate that a majority of the Laguna Creek Watershed has specific
stream power values of less than 35 W/m-2 and can therefore be considered relatively
stable (Figure 7).
Figure 7 – Specific Stream Power for Laguna Creek
Analysis
The excellent drainage area/discharge relationship resulted in fairly accurate
flow estimates, larger watersheds may need to look at effects of varying
precipitation as suggested in Finlayson and Montgomery (2003)
Conclusion
This proves to be a promising method-based on readily available information and
may save time and money over a field-based effort. It could probably be done on a large regional
scale.
References
Bledsoe, B.P. and C.C. Watson.
2004. Regional risk analysis of channel
instability. Watershed
Management Conference 2000. American Society of Civil Engineers.
Finlayson, D.P. and
D.R. Montgomery. 2003.
Modeling large-scale fluvial erosion in geographic information
systems. Geomorphology (53), pp. 147-164
Rosgen, D. Applied River Morphology.
1996. Wildland Hydrology,
Schroder, R. 1991. Test of Hack’s slope to bed material
relationship in the southern Eifel Uplands,