GIS and Geneology
Tara Murphy
Introduction | Background | Methods | Results | Analysis | Conclusion | References
AbstractFor this project I created maps using GIS to display my family's genealogical data. Mapping genealogical data can provide insight into migration patterns and reveal spatial patterns that are often overlooked or not obvious in a table format. IntroductionI have always been fascinated to learn about my personal genealogy. In the 4th grade we studied the pilgrims and when my mother told me that we had ancestors that came to America on the Mayflower I thought I was the coolest girl in the class. A few years ago I began more seriously researching my ancestry. I first started by asking my living relatives if they had any information to help fill out our family tree. Then, I collected census, birth, marriage and death records to trace each of my family lines back as far as I could. I got a thrill out of learning when my relatives arrived in the United States, the different places they lived throughout their lives, their professions, how old they were when we they got married and all the dirty little family secrets I came across. I felt like Sherlock Holmes solving the mystery of where I came from. But then as quickly as it started, I lost interest, I had followed the data as far back as I could and no new information was coming in. The data is currently stored in a pedigree and when I share the pedigree with family they are interested, but I can tell they would like a more visual presentation of the data. The combination of GIS with my family’s genealogy is the prefect solution. The data of where my ancestors were born and died are the spatial element needed for GIS. The use of GIS will both provide a visual presentation of the data and allow me to do a spatial analysis of the data. By analyzing the data spatially I hope to find trends and perhaps new clues of where to renew my family genealogy data search. BackgroundBeing familiar with the area ancestors lived is an important aspect of a family history research. The spatial component of genealogical data makes it possible to map the location/residence of an individual during his/her lifetime (Oser, 2005). Mapping your ancestors can help you find and visualize where your relatives were born, lived and died. Maps can also help in locating where county courthouses or town halls records may be located to gather more information. They can provide insight into migration patterns and reveal spatial patterns that are often overlooked or not obvious in a table. In learning more about the location of your ancestors you may be able to uncover new record sources for information (Powell, 2009). MethodsMy genealogy database includes several spatial data elements. For the purpose of this project I focused on the birth location and death location of my individual ancestors. In order to get the data in a format compatible with ArcGIS I exported my family tree data from the genealogy software (Family Tree Maker) I store my family pedigree in, and converted the data from a GEDCOM file format to CSV file format. 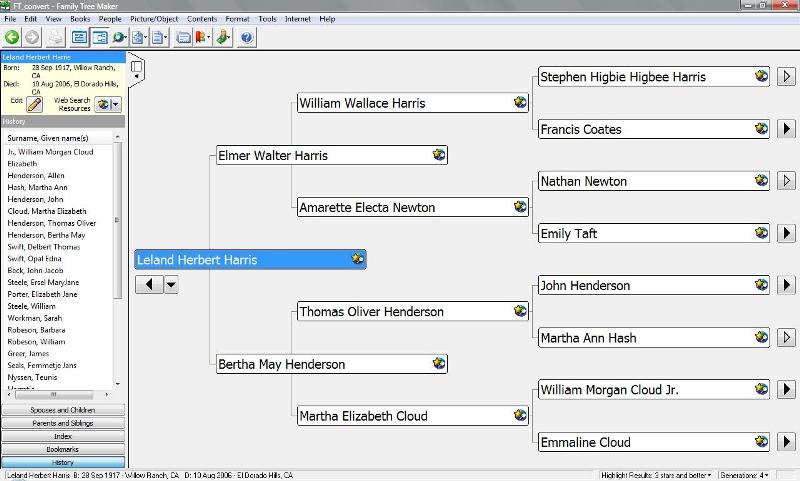
I then imported the data into relational database (Microsoft Access). I collected and entered in data for birth place and death place zip code (see birth table below). 
Using ArcGIS and an address locator I geocoded the birth and death zip codes. 
As you can see several of the records are unmatched, these are the records where I do not yet know the location of the individuals’ birth or death or it was outside of the United States which is not included in scope of my current project. Below is a map of zip code points geocoded. 
I then created a shapefile and created lines connecting each individual’s birth record to their corresponding death record. 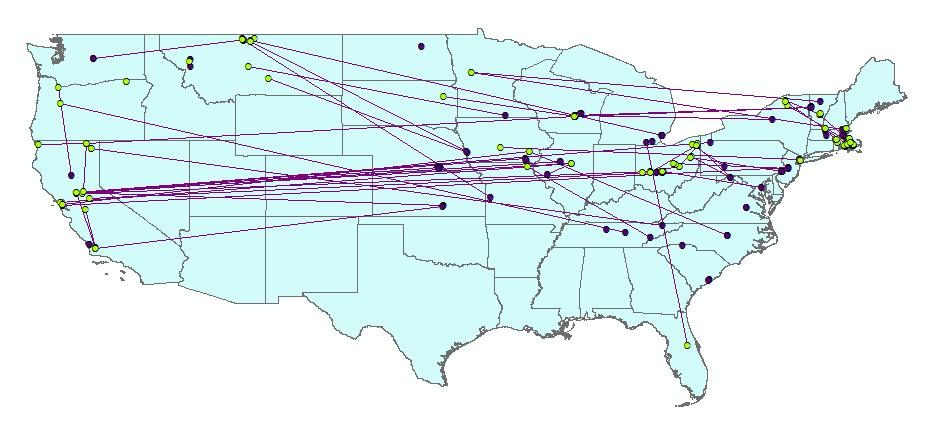
ResultsI now have maps that visually display the birth and death location of my family. 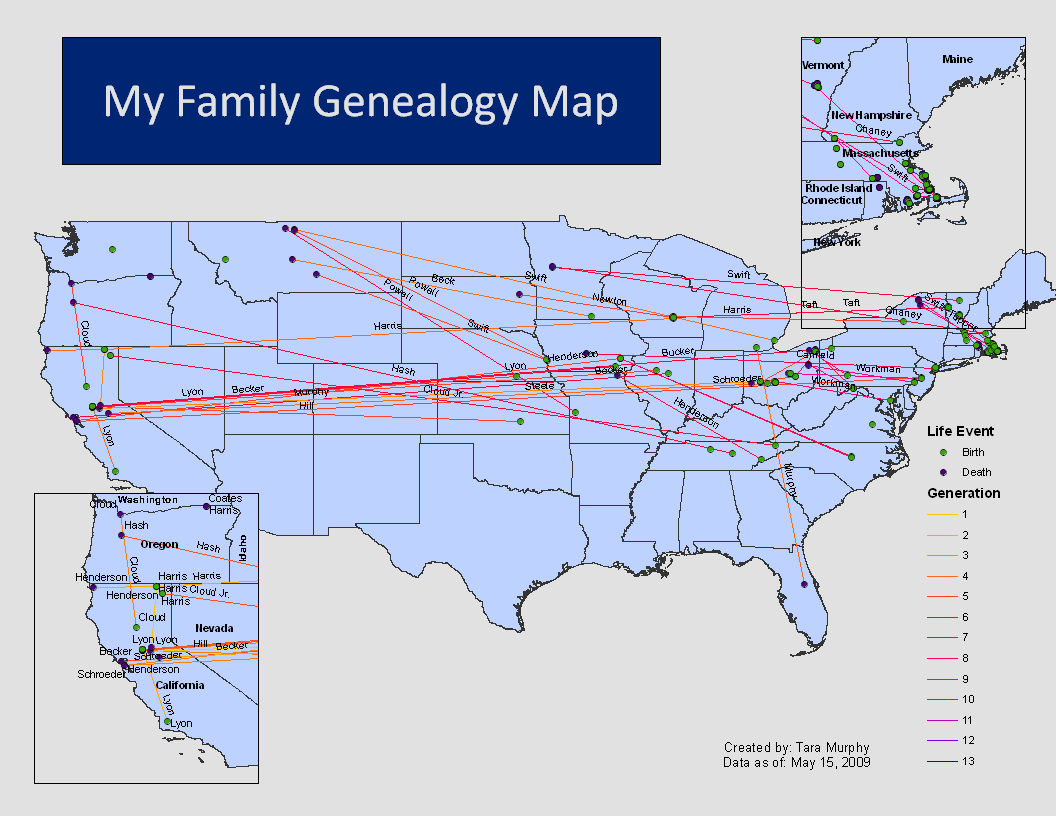
Since I created a field name denoting if the individual is from my father’s or from my mother’s side, I can display the data for each side separately.
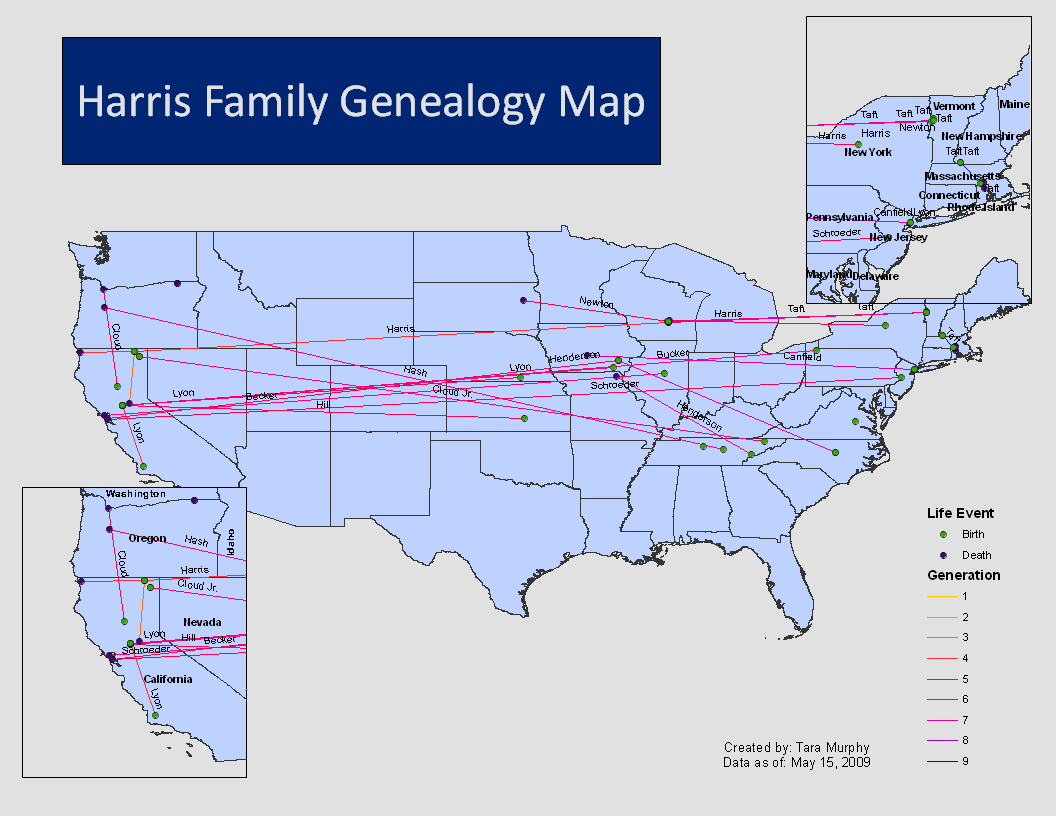
Map for my Father’s Side: 
AnalysisCreating maps of my family’s genealogy allowed me to further process the genealogical data I already had. In creating the maps I discovered a few pieces of information I had not known including the following: 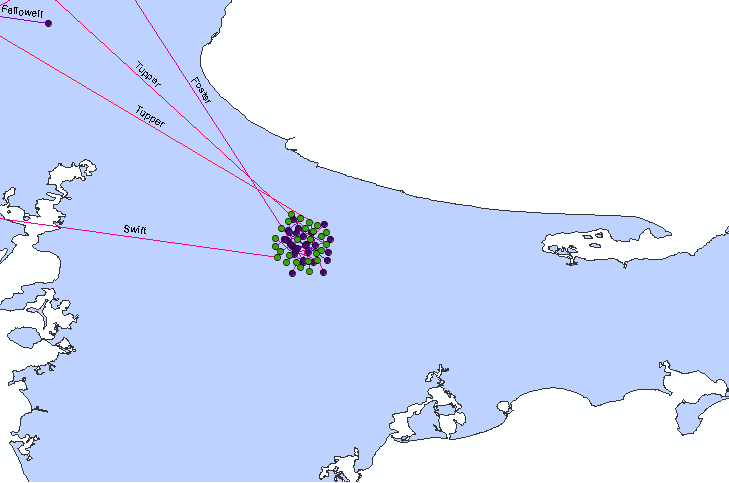
ConclusionCreating maps to display my family’s genealogy was a multi-step process, but the information that I was able to obtain was worth the process. Not only do I have a better way to visually present the information to my family, but I also learned several new things I had not noticed when the data was stored in a table format. Overtime I hope that the maps will continue to evolve to include additional life events such as marriage and census records and any newly discovered information about my ancestors.
ReferencesOser, Anita, October 10, 2005. “GIS to Map Genealogical Data: Getting Started World Library and Information”. 71th IFLA General Conference, August 14th - 18th 2005, Oslo, Norway, retrieved from http://www.ifla.org.sg/IV/ifla71/papers/201e-Oser.pdf Powell, Kimberly, 2009. “Mapping Out Your Family Tree: Using Maps in Your Genealogy Research” . About.com, retrieved May 10, 2009 from http://genealogy.about.com/cs/ukmaps/a/maps.htm
|