|
Fast Food Locations - A Comparitive Study | |
|
Author Daniel Abellon American River College, Geography 350: Data Acquisition in GIS; Fall 2009 Contact Information: dmabellon@gmail.com | |
|
Abstract Obesity levels in Sacramento County are higher than the state average and children are more susceptible to obesity than ever before. The proliferation of fast food could be the link that defines why obesity levels in Sacramento are growing at an alarming rate. This study looks at the proximity of fast food restaurants in relation to Sacramento schools. Also, Sacramento County is compared to San Francisco County - a county with a lower average rate of obesity- to see if there is any difference in the proximity of fast food to schools. The results show that the proximities don't differ conclusively between the two counties and that there are probably other factors to consider. | |
|
Introduction Obesity has been an epidemic that has swept across the nation. Obesity among children has been on the rise and this is commonly attributed to America’s love of fast food. Factors that entice most Americans are that that fast food chains are highly accessible, offer the most calories per price compared to other restaurants, convenient, and cheap. I have found little information through numerous internet searches that study the distance between schools and fast food chains. I think this study would be helpful in any potential future legislation in where fast food restaurants can and cannot be built. My aim is to: 1) Determine the number of schools that are within a short walking distance of a fast food restaurant in Sacramento County. 2) Perform a comparative analysis with San Francisco County – a county known for lower obesity rates compared to Sacramento. | |
|
Background Obesity among children 6-11 has doubled in the past 20 years, increasing from 6.5% to 17% in 2006. In the same time period, obesity among adolescents from 12-19, the rate of obesity has more than tripled from 5% to 17.6%. Obese children are more likely to become overweight adults and have the associated health problems: heart disease, type 2 diabetes, and stroke (CDC). This trend of increasing obesity has also been matched with an increase in fast food restaurants in Sacramento County. The Sacramento Bee has compiled data showing that the five largest fast food chains have grown in Sacramento County by 5 percent this past year and 21 percent since 2005. Sacramento County also has a higher number of fast food restaurants per capita than the state average and a higher proportion of the population that is obese compared to urbanized counties like San Francisco and San Diego (Sacramento Bee). | |
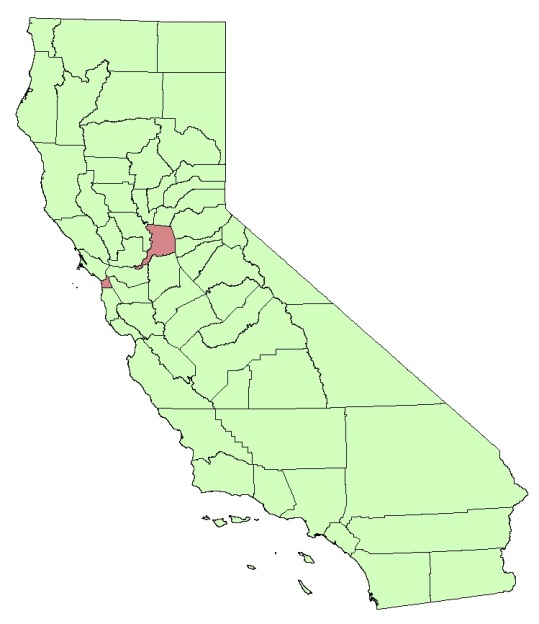
The Counties of interest, Sacramento & San Francisco, are colored in Coral: |
|
|
Methods 1. Gathering fast food restaurant data from Sacramento County & San Francisco County Sacramento County Environmental Management Department (EMD) has an Environmental Health division that performs health inspections for all the restaurants in Sacramento County. Before a restaurant can open, they must obtain a permit with EMD – this gives me 100% confidence that I capture all the fast food restaurants I want in Sacramento County. I’m an employee of EMD and have access to all the records through their internal database. I decided to limit my fast food list of restaurants to 7 of the most common variety – McDonald’s, Burger King, Carl’s Jr., Jack in the Box, Wendy’s, Taco Bell, and Kentucky Fried Chicken. I exported the listing of these restaurants into an excel file and proceeded to geocode them using batchgeocode.com to get GPS coordinates for use in ArcMap. For San Francisco County, I did not have the convenience of pulling the restaurant data from their Environmental Health database. I had to resort to an alternative method: store locators. I visited each restaurant’s website and queried the locations by searching all locations in San Francisco, CA. I transferred the address locations to an excel spreadsheet and geocoded the addresses using batchgeocode.com. A problem I encountered was not being able to tell if a resulting location is in San Francisco County. E.g. A few restaurants were located in Daly City, however I had no idea if Daly City is located within San Francisco County’s boundary. I decided to include these restaurants anyway in my dataset. I knew that I would be able to use the “clip” tool in ArcMap to exclude these restaurants based on their spatial location relative to San Francisco County boundaries. Pulling the restaurant data from each restaurant’s corporate website gives me confidence that I have captured all the possible locations within the county. Fast food corporations spend big dollars on marketing and advertisement and it’s hard to believe that they do not keep their store locator up-to-date. 2. Lists of schools in Sacramento County & San Francisco County An Excel spreadsheet of all the public schools in California is available from the California Department of Education website. It is a comprehensive list as of November 18, 2008. The list included school name, address, and what grades are taught at each specific school. I was able to filter that list for only Sacramento County & San Francisco schools and then I geocoded all the addresses to prepare for importing into ArcMap. The quality of the data should be accurate considering that the data came from California’s lead department on education. A problem with this dataset is that street addresses for some schools were missing. Since the list didn’t include the address for every school, my dataset may be missing a few school locations. Sacramento County has 355 K-12 schools San Francisco County has 110 K-12 schools | |
|
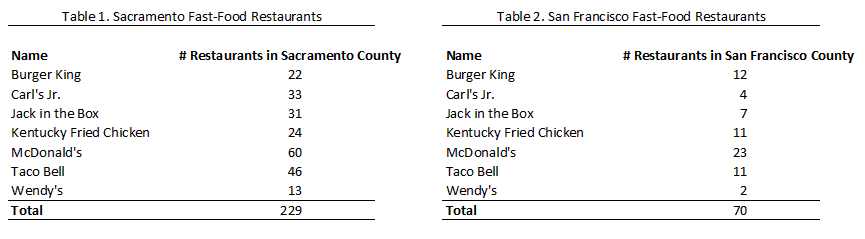
The following tables are a tally of all the the fast food restaurants I included in my study group:
 | |
|
Results


 | |
|
Analysis Sacramento has higher rates of childhood obesity compared to that of San Francisco, but it may not be linked to the proximity of fast food restaurants to schools. 1. The fast food density in relation to schools is almost identical: There are 0.645 fast food restaurants per school in Sacramento County and 0.636 fast food restaurants per school in San Francisco County. This means that Sacramento and San Francisco schools have similar densities of fast food restaurants in proximity to each school. 2. I queried the maps for both Sacramento and San Francisco and quantified the number of schools within a certain distance of a fast food restaurant (see tables 3 & 4). I broke down the number of schools within the distances of 0.10 miles, 0.25 miles, & 0.5 miles – each of these being a relatively short walking distance from a school. My findings indicate that there are a similar number of schools in the 0.10 & 0.25 mile categories between Sacramento and San Francisco. Since Sacramento has 3 times the number of schools compared to San Francisco, I expected Sacramento to have a much larger number of schools within this range, but the numbers did not reflect this. However, when comparing the number of fast food restaurants within a ½ mile radius of schools, the number for Sacramento is almost 3 times larger than San Francisco’s. This number is much more proportional to the difference in school numbers between the two counties. This is probably attributed to the vast difference in total land area. In Sacramento, there is more land available for fast food locations to be placed, so restaurant chains have the ability to spread out, whereas in San Francisco, land is limited, so schools and fast food restaurants will be more densely packed. | |
|
Conclusions Perhaps studying school proximity to fast food restaurants is not the answer to understanding why childhood obesity levels differ in the different counties in California. Urbanized counties like San Francisco, Los Angeles, and San Diego have lower instances of obesity, however when analyzing San Francisco’s fast food restaurants in proximity to their schools, it shows that they have the same number of schools within 0.10 -0.50 miles of a fast food outlet as Sacramento, which has 3 times the number of schools. The difference in levels of obesity could be attributed to other factors such as lifestyle. Sacramento is composed of many suburban communities; school children are either bused to school or taken to school by their parents in a personal vehicle. This is in contrast to kids who live in an urban environment who usually do more walking to and from school. Furthermore, more research must be done to find a conclusive answer to why childhood obesity levels differ at the county level within California. | |
|
References
1. California Department of Education Website: www.cde.ca.gov
2. Centers for Disease Control. “Health Topics: Childhood Obesity.” CDC. 2009. 30 Nov 2009. www.cdc.gov 3. Enkoji, M.S. and Reese, Phillip. “Recession whets local appetite for fast food.” Sacramento Bee [Sacramento] 7 October 2009, late edition: A1 4. Sacramento County Environmental Management Department – Internal database search for restaurants of interest. 5. Various store locators to get addresses for various restaurants in region of interest: I.e. McDonalds.com, BurgerKing.com, CarlsJr.com, etc. | |