| Title California County Statistics- Housing Foreclosure Crisis | |
|
Author Tyler Brouillette American River College, Geography 350: Data Acquisition in GIS; Fall 2010 Contact Information (Address, phone, email: Optional) | |
|
Abstract From 2005-2009 The state of California was drastically effected by the down turn of the housing market. A quick rise of home prices between 2005 and 2007, followed by a rapid drop from 2007-2008, caused many home owners to lose their homes and have to foreclose. Per capita income from 2005-2008 represented a rise in income, yet not enough for individual people or families to make it when some values dropped from $575,000 to $320,000 between 2007 and 2008. Unemployment rates were up between 2005 and 2008, which also shows potential for individuals to simply not be able to make the monthly mortgage payment. The main point I found to be true was that many prospective homeowners accepted loans which had high variable interest rates. The product was unaffordable monthly payments that lead to a final foreclosure. | |
|
Introduction California, as well as the rest of the country, has experience a major rise in housing prices, followed by a drastic drop in value. This type of crisis develops from an assortment of attributes that all contribute to regional statistics. These statistics may, or may not lead to a final realization that specific attributes contribute to the rapid rise and fall of the housing prices and foreclosure rates. | |
|
Background All of the data used was found online and consists of county data in California. The data consists of an xls spreadsheet with six different columns as described above. All of the data is relevant to statistics that can contribute to personal financial shortcomings, such as: income and unemployment, followed by vacancy rate and a final map with foreclosures. |
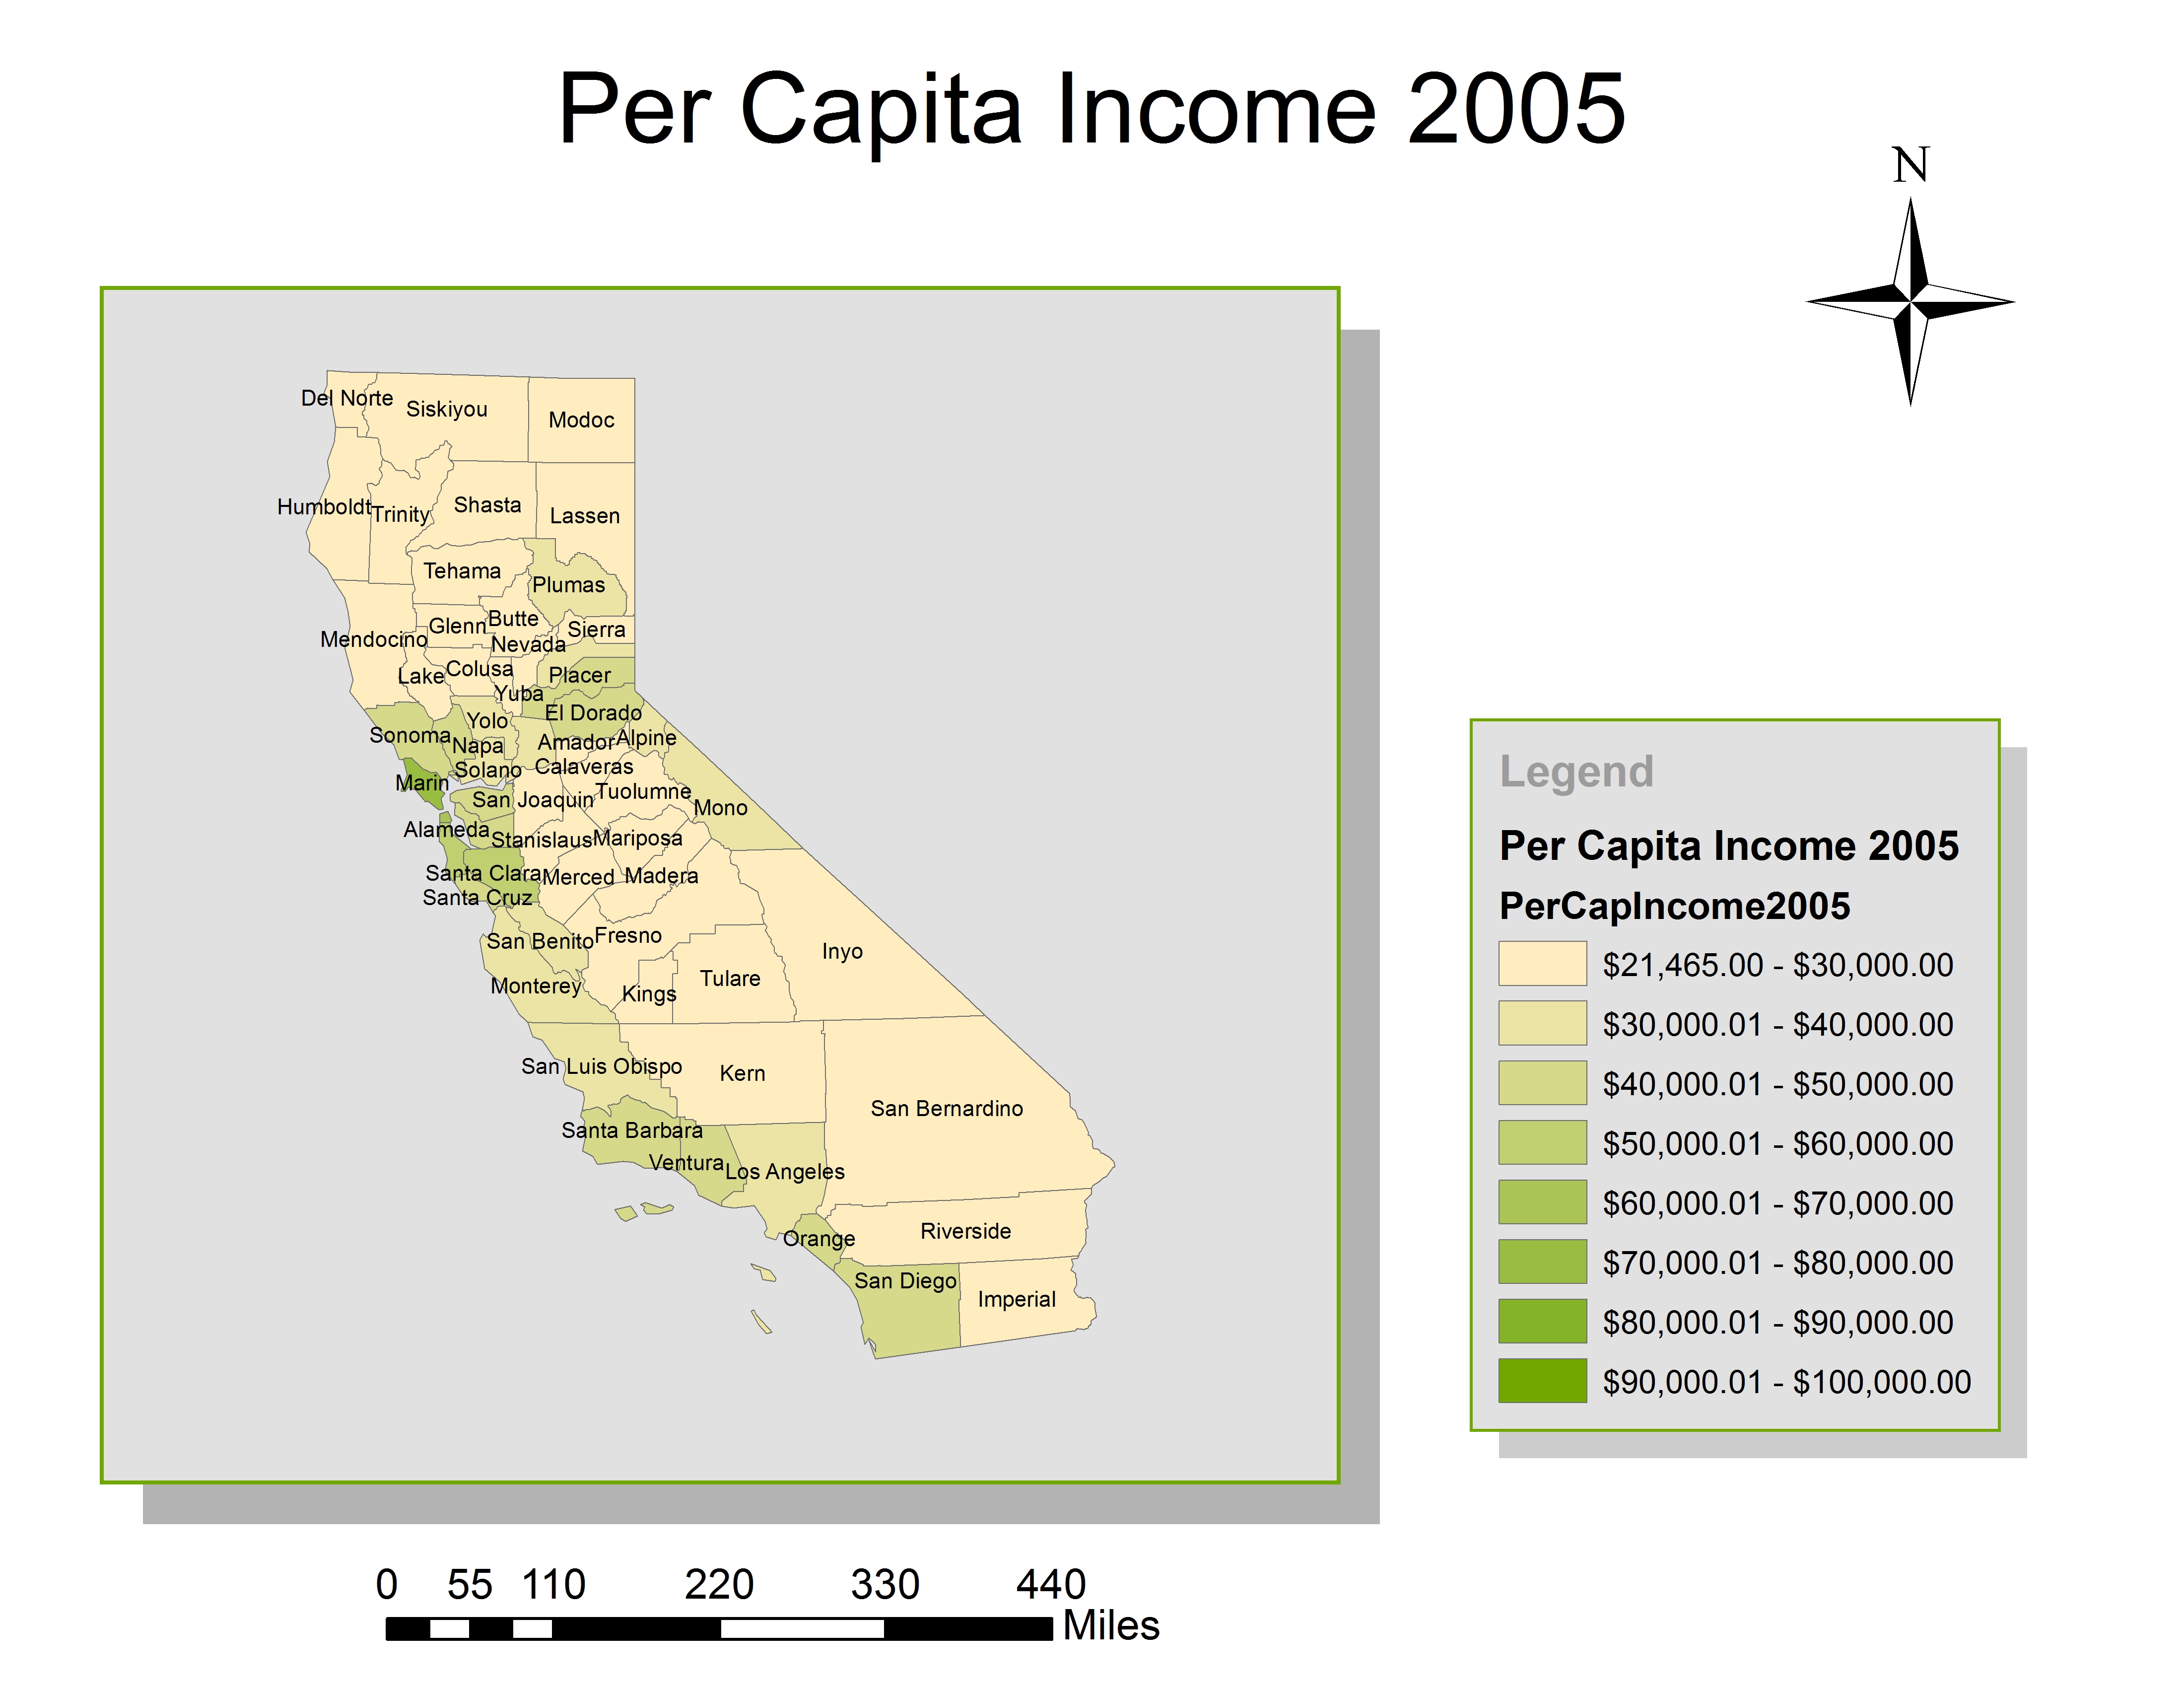
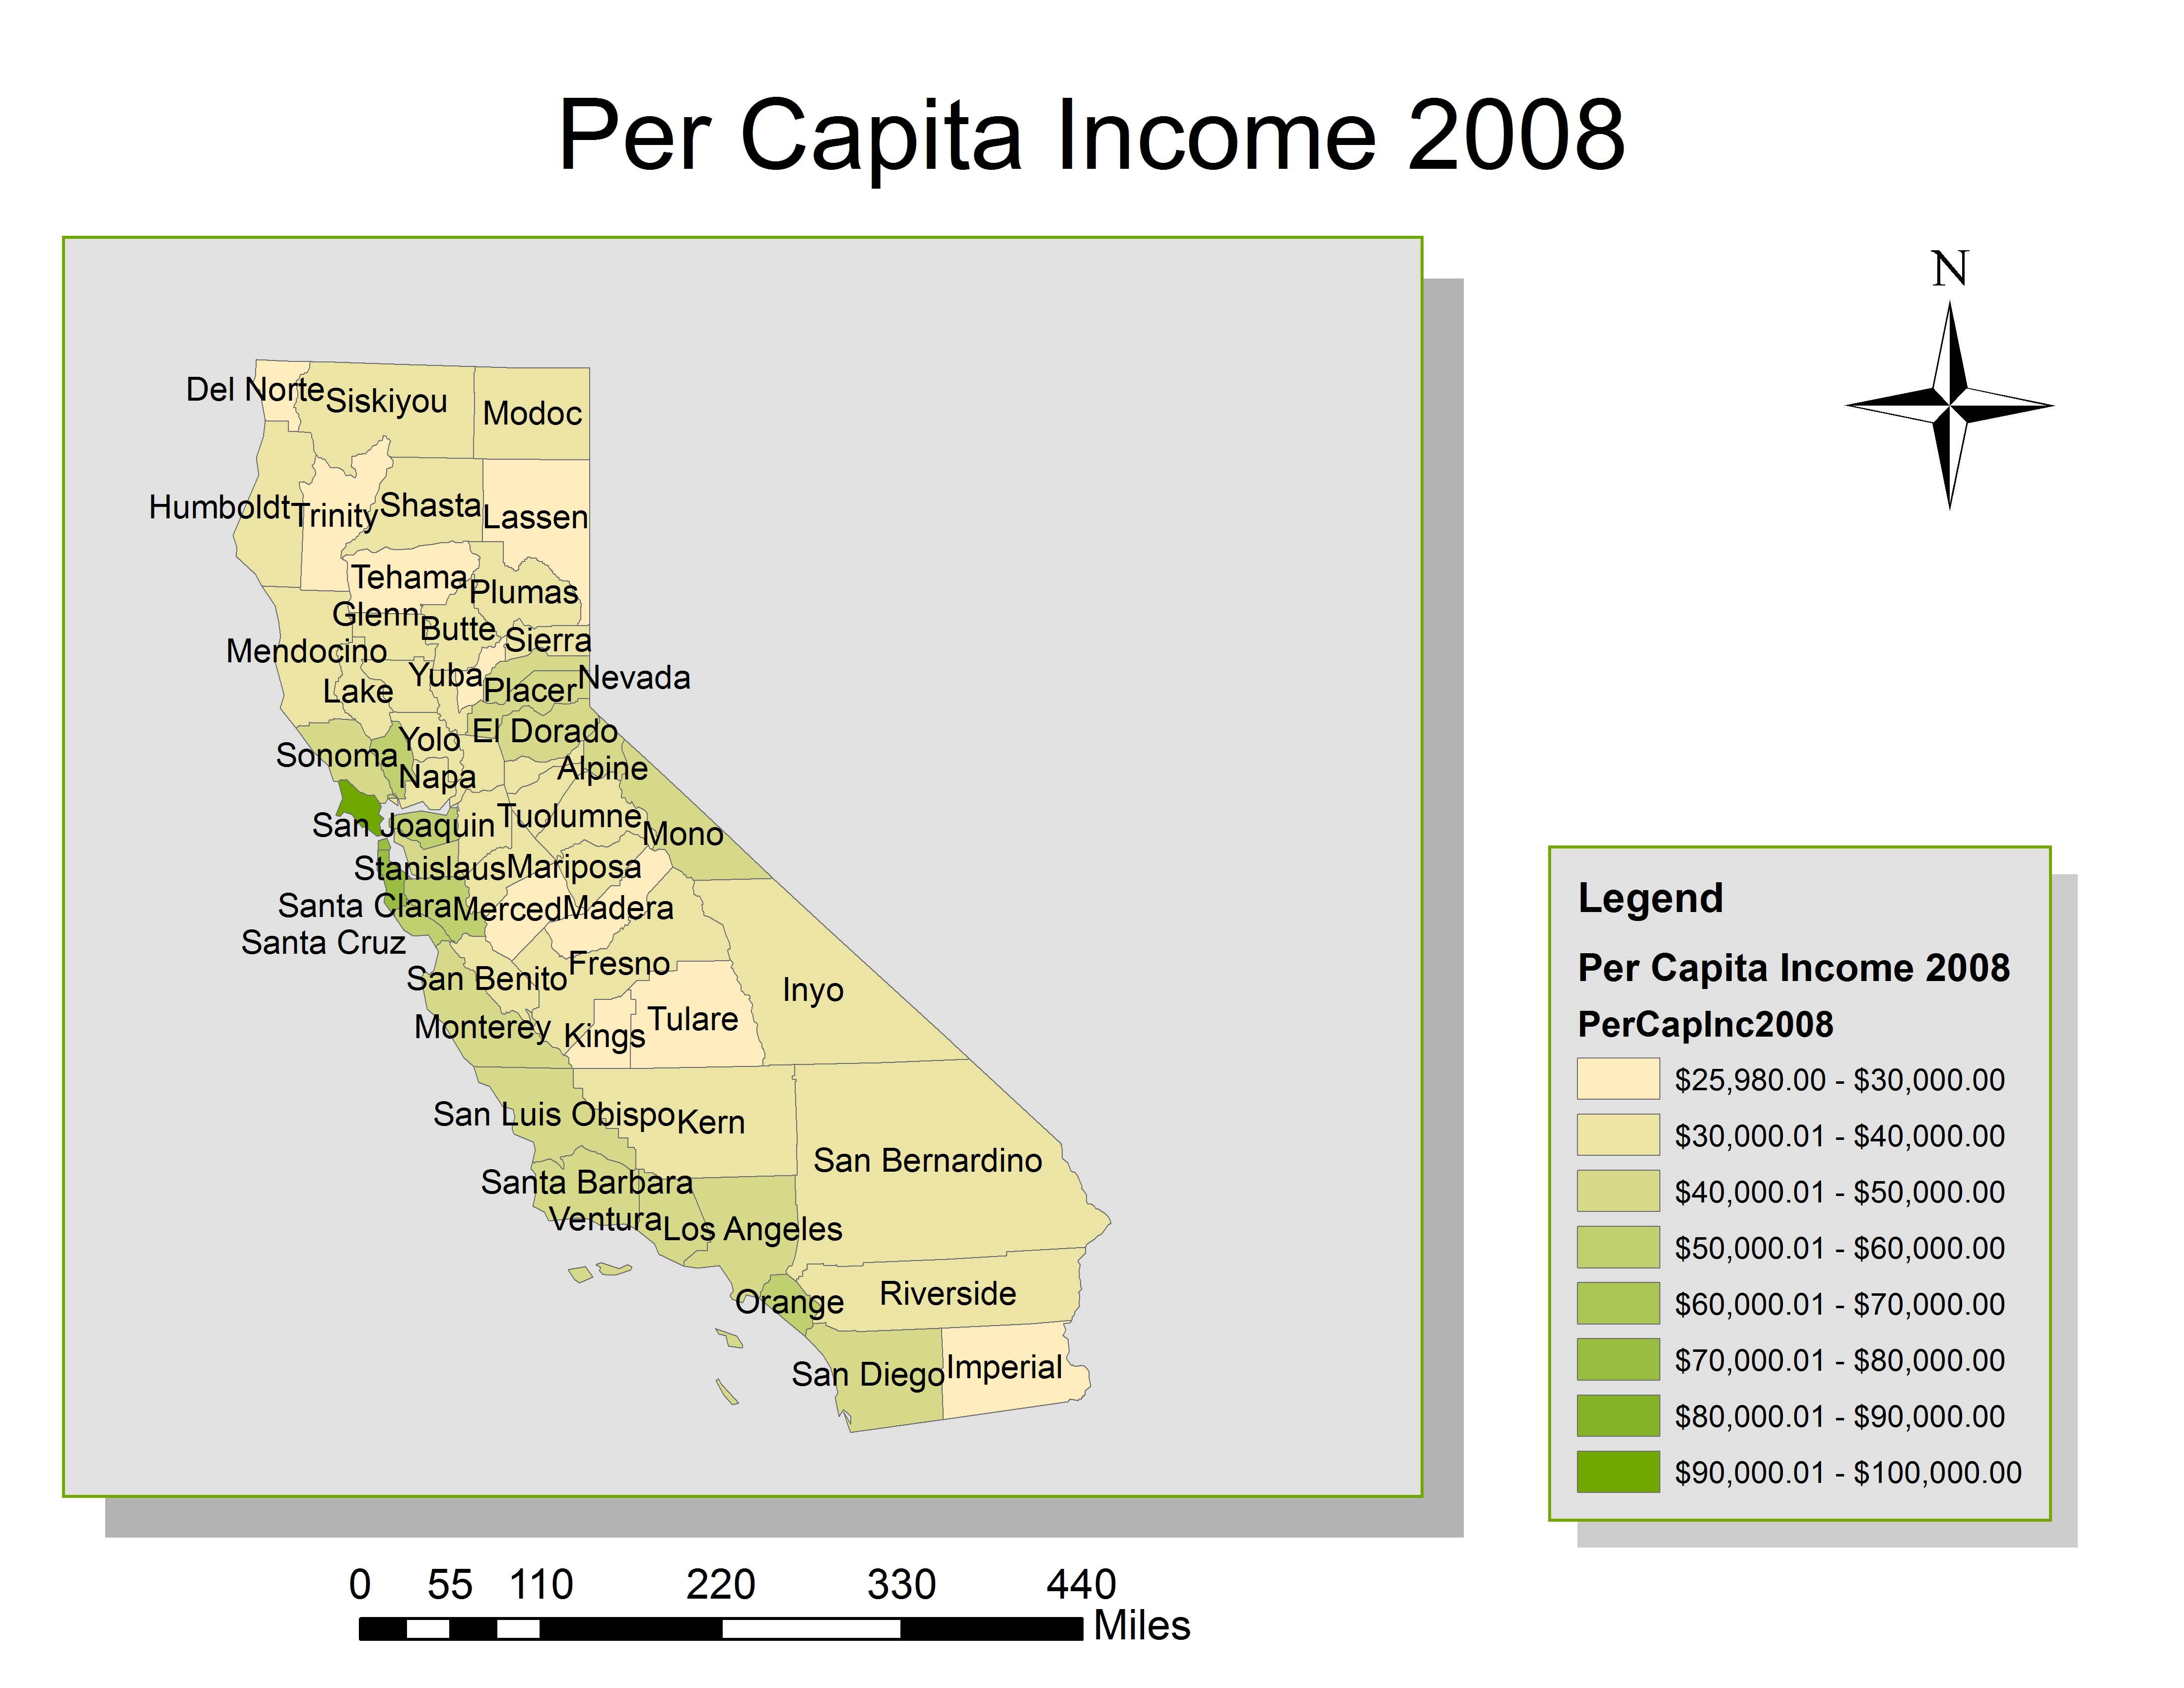
Methods I chose different color schemes for each set of data.; green for income, red for unemployment, and orange for vacancy data. The data is averaged by county, as each county polygon has one value for the area. I decided to stay with the default of North American Equidistant Conic (NAD 83). I modified the Central Meridian from -96 to -120, as this displayed California nice and even horizontally and provided a nice visual! The home value in California, as a state wide average, shows drastic contrast between 2005 and 2008. |
| Categorizing all data as quantities showed the min/max range of each set of data and variations over time. |

| <
|
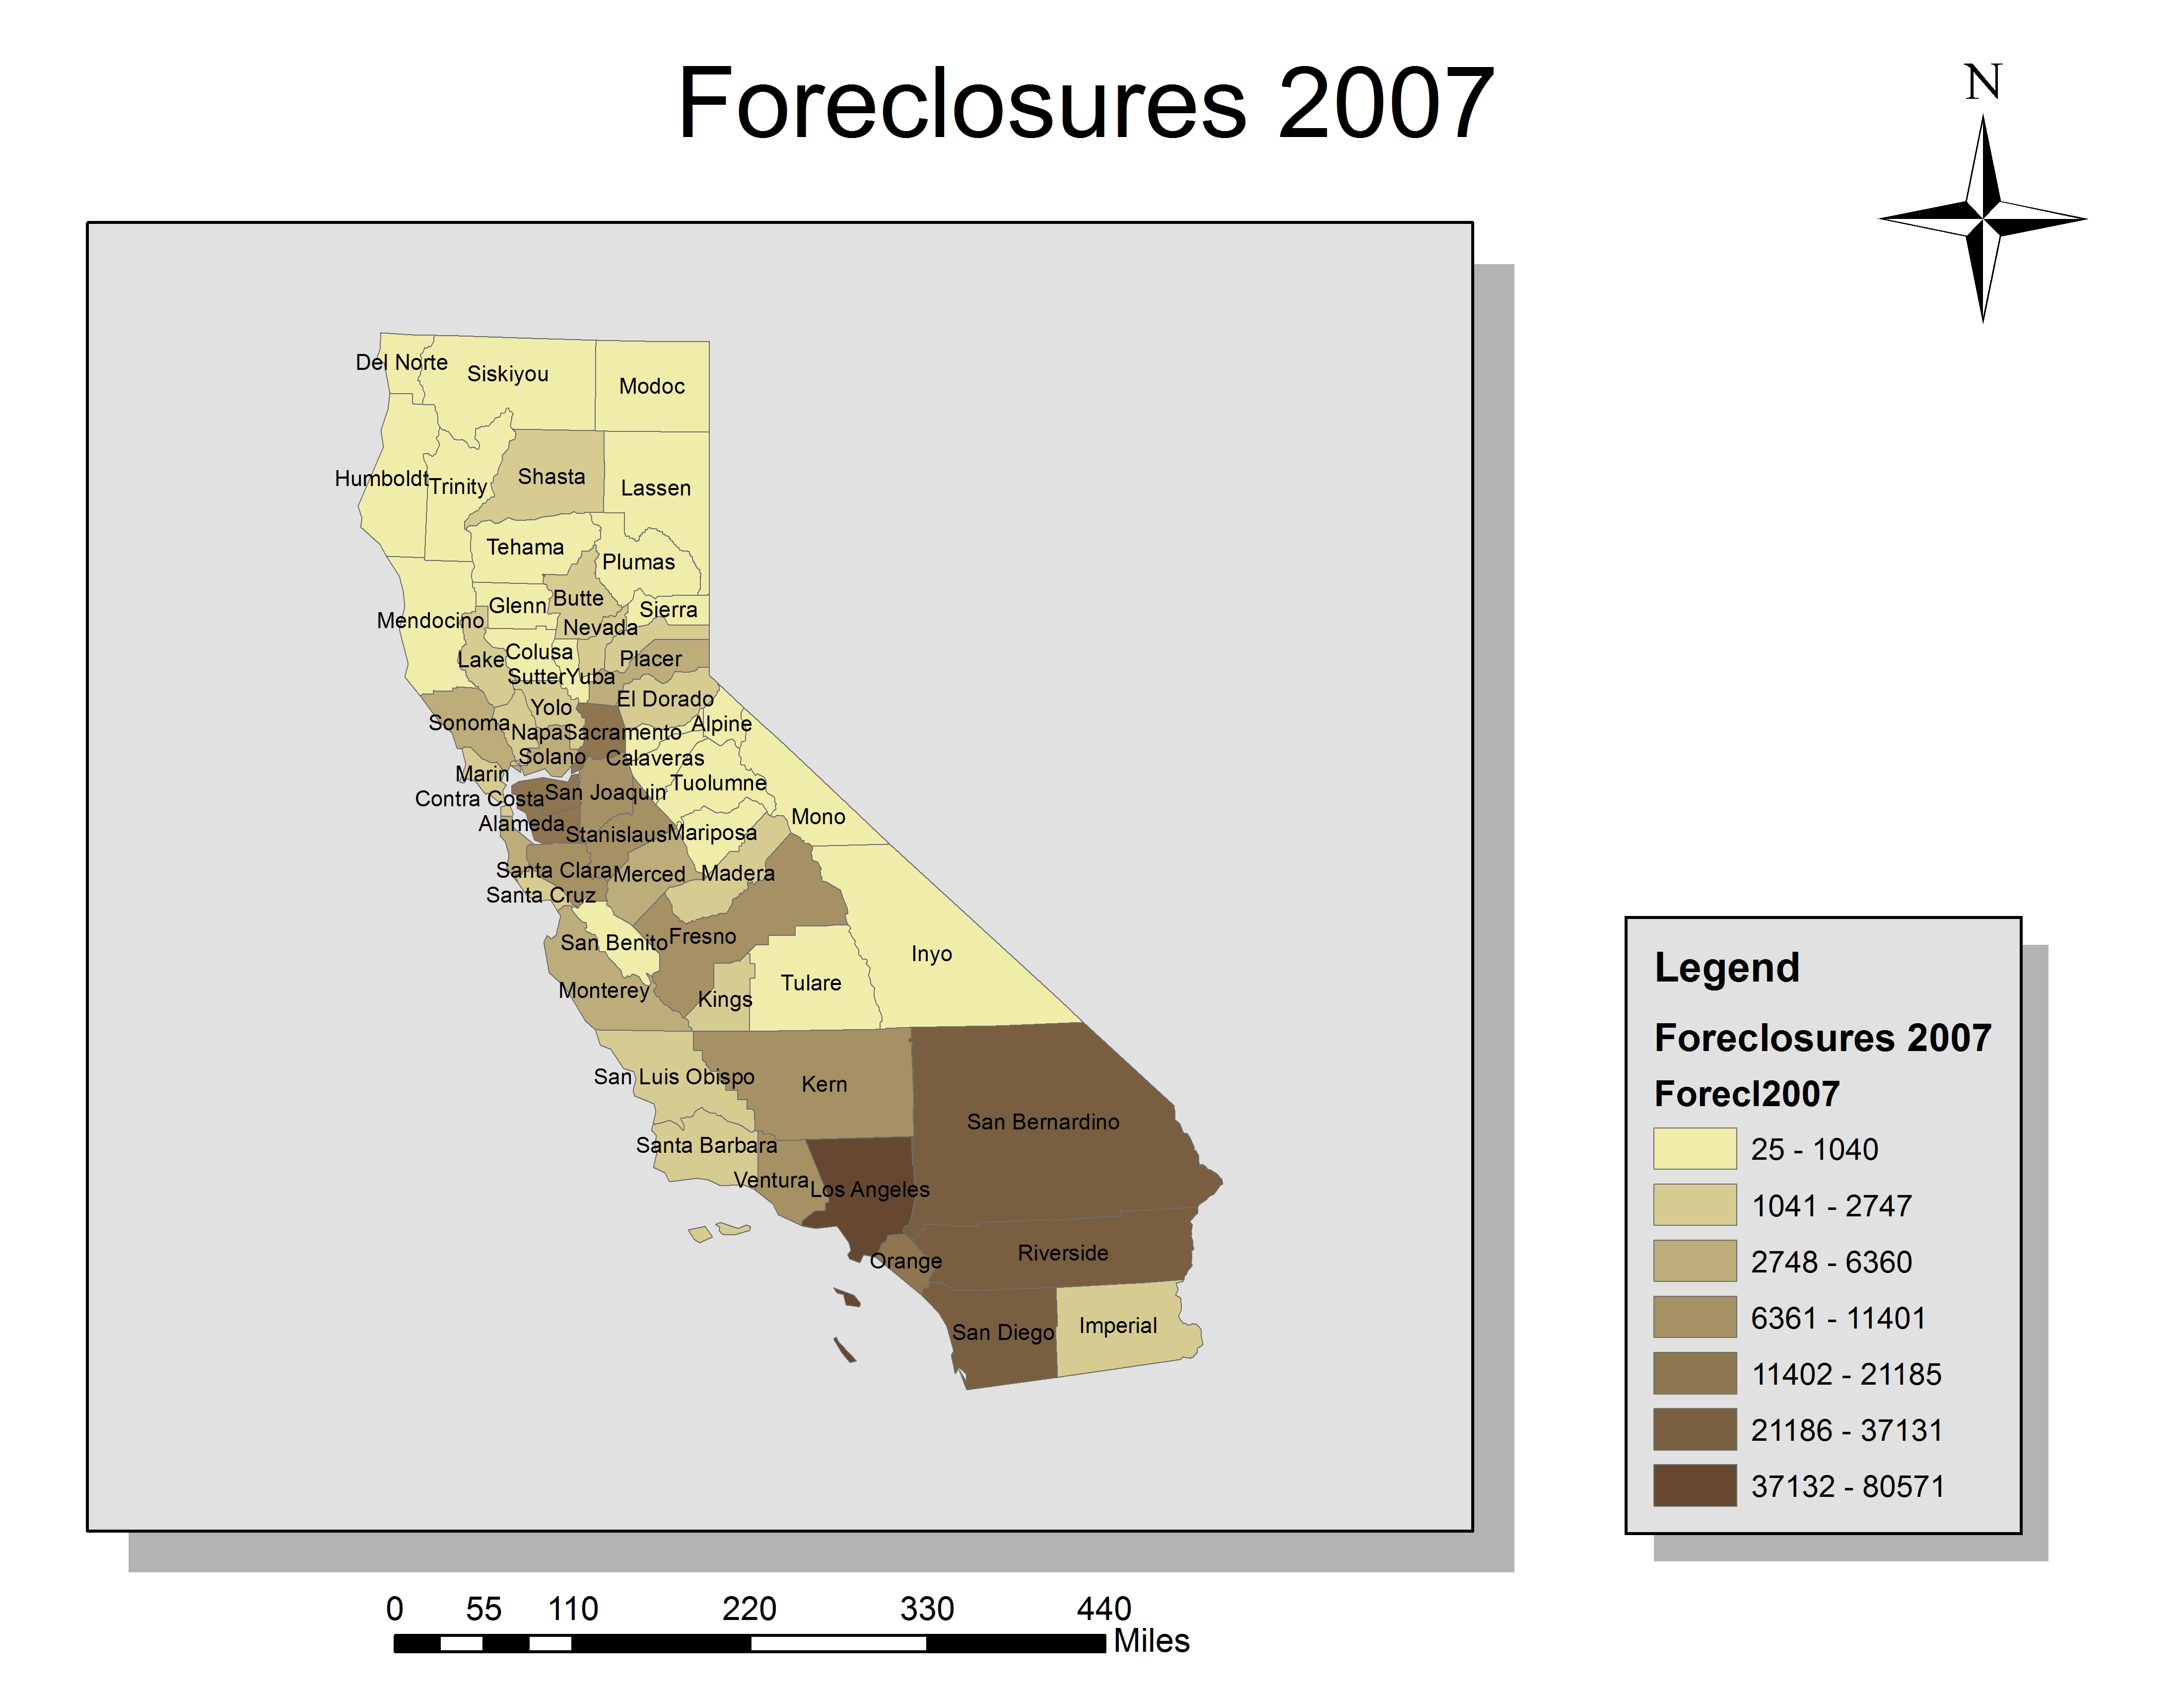
Results When looking for data, the older 2005 and 2006 data was easier sourced than that of the new data. Some of the newer data took a vast amount to time to find complete data sets. California definitely has the highest foreclosure rate, yet not that high of a vacancy rate. | |
|
Figures and Maps | |
 |
 |
|
Analysis The value of a home was around $450,000 and increased to $575,000 between 2005 and 2007, and then dropped back to $320,000 by 2008. This rapid rise over two years, yet small compared to the following drop of the housing market over one year, displays how prospective buyers purchased quick at higher prices, then the bottom fell out of the market. Newly purchased homes were worth roughly $255,000 less by 2008, if purchased right at the peak around 2007. My analysis of the three categories I chose to map took me on a slightly different path than I originally anticipated. I first thought that by reversing the color ramps to display the high vacancy rate color as light, and the low per capita income color also as light, it would show a trend associated with low income verses high vacancy. It was best to compare the lows with the lows, and the highs with the highs. The per capita income increased between 2005 and 2008, as well with the unemployment rates. A few selected counties did have higher vacancy rates, yet, these rates maintained relative correlation. | |
|
Conclusions The Western Bay Area maintained the highest income, lowest unemployment rate, and lowest vacancy rate as a whole, while the east end of the bay experienced fluctuations unlike the west end of the bay. The foreclosure rate in Southern California rated as the highest in 2007 in California, also making it the highest rate in the country. One must consider the fact that there are many houses in Southern California, putting the ratio of foreclosures verses owner occupied houses on a different scale than smaller, less populated counties | |
|
References Sources: http://www.labormarketinfo.edd.ca.gov/cgi/dataanalysis/labForceReport.asp?menuchoice=LABFORCE California county 2008 per capita income data http://www.bea.gov/regional/reis/scb.cfm http://ceic.mt.gov/BEACountyData.asp County 2009 vacancy rates-estimate(all I could find) http://www.dof.ca.gov/research/demographic/reports/view.php#objCollapsiblePanelEstimatesAnchor Unemployment 2008 http://www.calmis.ca.gov/file/lfhist/08aacou.pdf Housing Update Article http://www.ppic.org/content/pubs/jtf/JTF_HousingMarketUpdateJTF.pdf 2005/2006 income and vacancy data California Department of Finance Economic Research (916) 322-2263 Internet address: www.dof.ca.gov California counties polygon with attributes (MGIS) | |