
When Solar Radiation
Encounters GI Science
- Solar Assessment in SMUD Service Area -
Doina Brownell
- Geography 350 -
American River College, Sacramento, CA
 Abstract
The nation’s leader in energy,
California, established a more ambitious clean energy standards this year, as
reaching one third of its power renewable by 2020 (Associated Press, September
23, 2010). The standards also require utilities to reach 20% renewable standard
by next year, and hopefully, will create thousands of “green jobs”.
The project canvasses the
potential for development of solar resources using GIS (Geographic Information
Systems) technology, in
The project result might be used
by solar private industry, local consulting companies and SMUD to plan and
promote residential solar development roof tops.
Introduction
The project objectives are:
}
1.
Identification of rooftops in the Pilot Area
}
2.
Creating solar potential maps (SPM) of
}
3.
Estimate the photovoltaic energy of annual solar radiation potential in the
Pilot area and Study Area, from new solar panels on residential roof tops.
Integrating GIS analysis tools,
such as Solar Analyst, in data sources, as orthographic aerial photos and land
parcel information could produce solar potential maps which present corridors
of high and low solar access.
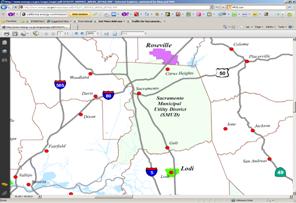

Fig. 1 -
SMUD Distribution Area in
Background
All over the world, governments
are setting ambitious goals to produce green energy and solve the present
energy crisis with a renewable energy created by a never-ending source. Several
studies were created in order to evaluate possible solar areas in different
counties.
ArcGIS® Spatial
Analyst is an optional extension to ArcGIS Desktop which provides powerful
tools for comprehensive, raster-based spatial analysis. Also, the solar radiation analysis tools in ArcGIS Spatial Analyst enable mapping
and analyzing the effects of the sun over a geographic area for specific time
periods.
Data Acquisition
The imagery
used in the project was comprised by a digital orthographic image which covers
Sacramento Area, collected from City of
Method
ArcGIS Spatial Analyst is
fully integrated with ArcGIS Desktop and provides more than 150 tools and
functions that users can access in the same environment as the more than 200
other ArcGIS Desktop tools.
From City
of
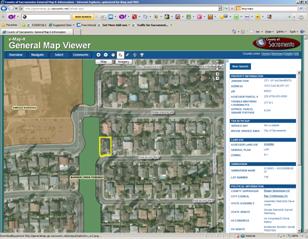
Fig. 3 – Pilot Project closer look
In the Pilot Area were selected 20
houses with rooftops oriented South, West or/and Southwest, each classified
from a Land Use point of view as single family residential unit:
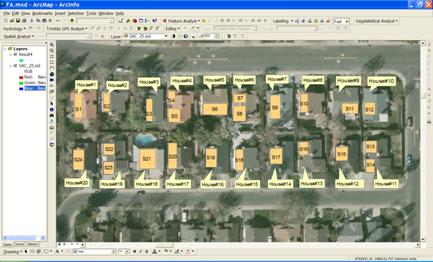
Fig. 4 – Pilot Project location
with selected rooftops
For each house
and each potential solar panel was calculated its area, considering an average
of 30% rooftop pitch and recorded in a table (see Table
1).
The
solar radiation is modified as it travels through the atmosphere by topography
and surface features. On the Earth’s surface the sun radiation is comprise of
direct, diffuse, and reflected components. The main radiation is the direct
one, intercepted unimpeded, in a direct line from the sun. Diffuse radiation is
scattered by atmospheric constituents, such as clouds and dust. Reflected
radiation is reflected from surface features. The sum of the direct, diffuse,
and reflected radiation is called total or global solar radiation.
ArcGIS
Spatial Analyst extension tool allows solar radiation calculation and analyzes
the effects of the sun over a geographic area. The criteria to be considered as
well are: atmospheric effects, site latitude and elevation, steepness (slope)
and compass direction (aspect), daily and seasonal shifts of the sun angle, and
effects of shadows cast by surrounding topography.
The DEM
was used as input data for the Study Area SPM:
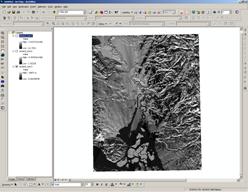
Fig.
5 - Digital elevation map covering the entire
Continuing
the solar spatial analysis I aimed to determine how solar energy resources can
be optimized by placing photovoltaic panels on rooftops in
The
solar radiation potential for the whole

Fig.
6 - Solar potential radiation in
Analysis:
According to the California
Climate Zone Descriptions of June
2001 Sacramento Area is considered part of Zone 12, with the coordinates and
main characteristics presented below:
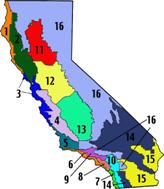
Fig. 7 -
Latitude: 37.54 N Basic Climate Conditions (F):
Longitude: 121.15 W Summer Temperature Range 35
Elevation: 22 ft Record High Temperature (1972) 114
Record Low Temperature
(1963) 19
The
final output took in consideration the effects of shadows
cast by surrounding topography and the South, Wet and southwestern
orientation of the residential rooftops in the Pilot Area, as shown below:

Fig. 9 – Final solar analysis
result in the Pilot Area
However, knowing that in a sunny
climate like California, a one square meter panel can generate up to 100 W at
peak output and on a yearly average generates about 18% of peak output, and that the
average
|
House
No. |
Surface (sq.m.) |
Potential
Electrical Energy per year |
Annual
Electric Bill Savings |
||
|
Final |
(kWh) |
($) |
|||
|
1 |
S1 |
63.05 |
63.05 |
9942 |
1094 |
|
2 |
S2 |
39.77 |
39.77 |
6271 |
690 |
|
3 |
S3 |
49.6 |
49.6 |
7821 |
860 |
|
4 |
S4 |
29.71 |
84.13 |
13266 |
1459 |
|
S5 |
54.42 |
||||
|
5 |
S6 |
93.92 |
93.92 |
14809 |
1629 |
|
6 |
S7 |
35.78 |
101.94 |
16074 |
1768 |
|
S8 |
66.16 |
||||
|
7 |
S9 |
81.74 |
81.74 |
12889 |
1418 |
|
8 |
S10 |
45.93 |
45.93 |
7242 |
797 |
|
9 |
S11 |
56.8 |
56.8 |
8956 |
985 |
|
10 |
S12 |
44.44 |
44.44 |
7007 |
771 |
|
11 |
S13 |
43.48 |
81.79 |
12897 |
1419 |
|
S14 |
38.31 |
||||
|
12 |
S15 |
54.2 |
54.2 |
8546 |
940 |
|
13 |
S16 |
38.37 |
38.37 |
6050 |
666 |
|
14 |
S17 |
64.76 |
64.76 |
10211 |
1123 |
|
15 |
S18 |
50.52 |
50.52 |
7966 |
876 |
|
16 |
S19 |
70.34 |
70.34 |
11091 |
1220 |
|
17 |
S20 |
73.5 |
73.5 |
11589 |
1275 |
|
18 |
S21 |
106.3 |
106.3 |
16761 |
1844 |
|
19 |
S22 |
43.99 |
89.69 |
14142 |
1556 |
|
S23 |
45.7 |
||||
|
20 |
S24 |
73.39 |
73.39 |
11572 |
1273 |
|
Total |
- |
- |
1364.18 |
215,104 |
23,661 |
Table 1 – Solar energy cost efficiency in the Pilot Area
For the Pilot Area the annual
savings for all 20 houses would be $23,661,
representing 215 MWh.
However, extrapolating for the
whole SMUD territory, considering 500,000 households, the final result would
have to take in consideration several criteria, as 30% loss due to lack of
interest in solar panels and/or losses on the distribution wires, 30% due to
financial constraints, and 20% due to shaded rooftops, or lack of appropriate
rooftops orientation (S, SW or W), it might be possible to return to the
utility service grid an amount of 1,613 GWh, representing $177 million each
year.
Conclusion:
The project succeeded to
demonstrate that
Applying ArcGIS tools in
From
each solar panel, due to an inverter the solar radiation is transformed in AC
power, which supplies each house main electric panel and further supplies all
the household electrical needs. The surplus may go in the local electrical
utility company, for a later usage. Also, the amount of green power
generated by households is aimed at encouraging consumers to play a part in a
"clean energy revolution" and also to bring cash back in their
pockets. An explicit diagram is presented below:
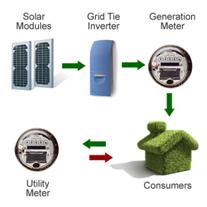
Fig. 10 - Clean energy cashback
diagram
Figures, Tables and Maps:
Fig. 1 - SMUD distribution area in
Fig. 2 - Study Area and Pilot Area
locations
Fig. 3 - Pilot Project closer look
Fig. 4 - Pilot Project location
with selected rooftops
Fig. 5 - Digital elevation map covering the entire
Fig. 6 - Solar area radiation in
Fig. 7 -
Fig. 8 - Average monthly temperatures
Fig. 9 -
Final solar analysis result in the Pilot Area
Fig.10 - Clean energy cashback diagram
Table 1 - Solar energy cost efficiency in the Pilot Area
References:
1/
ArcGIS Spatial Analyst - Advanced Raster Spatial Analysis, ESRI Online, http://www.esri.com/library/brochures/pdfs/spatialanalystbro.pdf
2/ Boston Showcases Solar Power Potential with
Web GIS, GIS Best Practices in
Renewable Energy, January 2010, http://www.esri.com/library/bestpractices/renewable-energy.pdf
3/ Collin, C., Interpolating Surfaces in ArcGIS,
Education Services, ArcUser,
July-September 2004, http://www.esri.com/news/arcuser/0704/files/interpolating.pdf
4/ GIS
for Renewable Energy, ArcGIS News,
ESRI, Vol. 31, Nr.3, Fall 2009, http://www.esri.com/news/arcnews/fall09articles/files/31_3/arcnews-fall09.pdf
5/
Kelly, M., GIS to Meet Renewable Energy Goals, ArcNews Online, Fall 2009, http://www.esri.com/news/arcnews/fall09articles/gis-to-meet.html
6/ Mapping the Solar Potential of Rooftops, Germany's SUN-AREA Research Project Uses
GIS, GIS Best Practices in
Renewable Energy, January 2010, http://www.esri.com/library/bestpractices/renewable-energy.pdf
7/ National Renewable Energy Laboratory Measurement and
Acknowledgements:
The
project was supported by the SMUD GIS Department of Transmission and Department
of Contracts and Acquisition, and Black and Veatch consulting company.