A GIS
Approach to Understanding the Yolo Bypass
Diana Craft
American River College
Geography 350: Data
Acquisition in GIS
Fall 2010

ABSTRACT
Landsat
imagery and GIS data obtained online, along with other online research, were
used to examine aspects of the Yolo Bypass, including its extent, uses,
hydrology, geographical context, and seasonal changes. ArcGIS was used to
create a series of maps displaying the results of this examination.
INTRODUCTION
Just west
of the Sacramento River, I-5’s Elkhorn Causeway to the north and I-80’s Yolo
Causeway to the south cross a large expanse of flat land that comprises a
quilt-like array of leveed fields, sometimes flooded by rain or irrigation.
I’ve driven over this land on my way to school and back to Woodland and have
wondered about the seasonal changes I’ve observed in what I assumed was the
Yolo Bypass. How is this land used? How much of it actually is the Yolo Bypass?
What happens when it floods? I decided to find data that would help me
understand the Bypass—its extent and use, how it changes over the
seasons, and how it is used for flood control—and create a series of maps
to serve as a basis for future investigation.
BACKGROUND
The Yolo
Bypass is a 59,000+ acre engineered floodway that is part of the Sacramento
River Flood Control Project. Its sources are the Colusa Basin Drain (via the
Knights Landing Ridge Cut), Willow Slough, and Cache and Putah Creeks, and it
receives diverted water from the Sacramento and American Rivers via the
Sacramento Weir (involving manual operation of up to 48 steel gates) and from
the Sacramento and Feather Rivers and the Sutter Bypass via the passive Fremont
Weir (where water spills over when the crest is reached).
It
incorporates seasonal agricultural areas (mostly rice fields in the Northern
Bypass, north of 1-80; other crops include corn, melons, tomatoes, safflower,
and milo) and seasonal and permanent wetlands that provide significant wildlife
habitat, including the 16,770-acre Yolo Bypass Wildlife Area between Davis and
West Sacramento and several duck clubs to the south (CA Dept. of Fish &
Game et al, 2008).
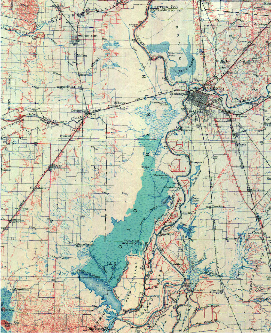
Fig. 1.
Historic map of the Yolo Basin, 1903–1910 (DFG et al, 2008).
The
overlap of agriculture, managed wildlife habitat, and recreation through the
seasons in way that is compatible with flood protection make the Bypass unique.
Situated within the naturally formed Yolo Basin (Fig. 1), once an almost
80,000-acre wetland (DFG et al, 2008), the Yolo Bypass was engineered in the
early 1900’s to channel floodwaters away from Sacramento and other low-lying
areas. Wetlands restoration by the Army Corps of Engineers led to the 1997
dedication of the Wildlife Area (DFG et al, 2008). (Fig. 2)

Fig. 2.
The Yolo Bypass Wildlife Area on a rainy day, Dec. 2010.
The
41-mile long Bypass has a capacity that is 4.5 times greater than that of the
lower Sacramento River, and it serves as the primary way to drain the
Sacramento Valley during major flood events. (Yolo Bypass Working Group et al,
2001). It is lined with levees ranging from 7,000 to 16,000 feet apart, except
for an eight-mile levee-free section below Putah Creek (where the higher
elevations can contain all but extreme flooding). These levees guide
floodwaters down to the Sacramento-San Joaquin Delta. The Bypass floods
seven out of ten years some time during the period of October through June,
with peak flooding in January through March, and it is also intentionally
flooded during dry years to maintain fish populations (Smalling et al, 2005).
METHODS
I
started with Landsat TM imagery, available at no cost from the USGS’s Global
Visualization Viewer (GLOVIS) web site. These images are remotely sensed
digital photographs taken by Landsat satellites that provide data collection in
repeated coverage of the Earth’s surface, as part of a program jointly managed
by NASA and the USGS. Using coordinates from Google Earth to get the path and
row of imagery that would include the Yolo Bypass, I downloaded and
preprocessed images from different times of year, including one from January
2006, when there was significant flooding in the Bypass. These images provided
visual information for digitizing a polygon of the Bypass area, and the January
2006 image would serve as backdrop for a map showing flood features.
Next I
looked for GIS datasets that would help me build the maps. Yolo County’s
website didn’t have accessible data, and my call to their GIS Specialist went
unanswered; instead I obtained Yolo County data from the Sacramento Area
Council of Government’s Regional GIS Clearing House. The USGS’s National
Hydrography Dataset (NHD) provided a geodatabase of complex hydrologic data,
including watershed data, and I discovered ArcGIS’s Utility Network Analyst
toolbar specifically designed for analyzing geometric networks like the NHD flowlines
dataset that shows direction of water flow. Other sources yielding useful data
were the California Department of Water Resources (DWR) Land & Water Use
Data Collections and the
Yolo Natural Heritage
Program. (Links for all websites are listed in References).
I looked
in vain for data that accurately described the boundaries of the Bypass, and I
ended up making my own polygon using the Landsat imagery and an average of
information gleaned from one dataset, PDF maps from various groups,
and—surprisingly, my most detailed resource—a paper map from AAA.
I visited
the Yolo Bypass Wildlife Area twice to take photographs between rainstorms, and
I talked to a ranger at the California Department
of Fish and Game (DFG) Yolo Bypass Wildlife Area Headquarters who gave me
useful information about the Bypass boundaries, including pointing out on a
blown-up photograph the section that does not have a levee.
Online
research provided an overwhelming amount of information in the forms of land
management plans and strategies for both the Bypass and the subset of the
Wildlife—so much information, in fact, that distilling it down to a
manageable background for the project was a challenge. Many organizations and
governmental entities are invested in the management and future of the area,
including the Yolo Basin Foundation, Yolo County, DWR, DFG, and US Fish and
Wildlife Service.
RESULTS
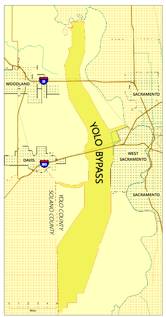
Map 1
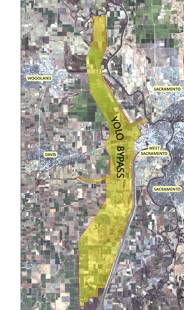
Map 2
Map 1 introduces the polygon that
describes the boundaries of the Yolo Bypass and places it in local context,
showing county boundaries, nearby cities, and the highways and railroads that
cross the Bypass. Map 2 shows the Bypass polygon over a true-color Landsat image
of the area, taken Oct. 1, 2010.
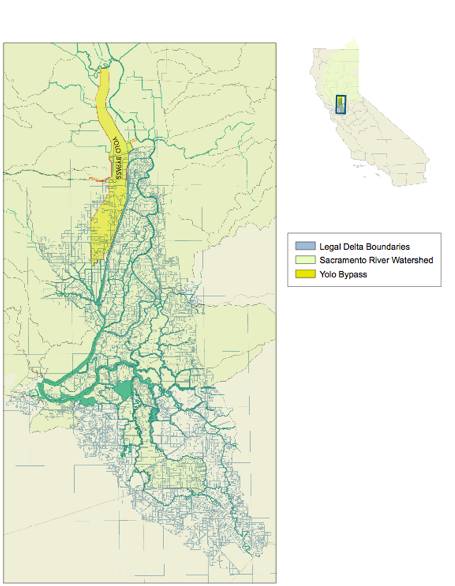
Map 3
In Map 3, the Bypass is placed in regional
hydrologic context, showing it in relationship to the Sacramento River
Watershed (hydrologic sub-region from the NHD data) and the legal boundaries of
the Sacramento-San Joaquin Delta (as defined by Section 12220 of the Water
Code).
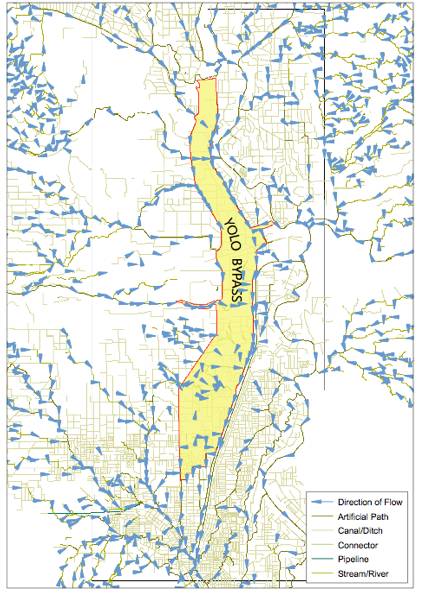
Map 4 shows the direction of water flow
into and from the Bypass, with directional arrows
that were
activated in the NHD flowlines layer when I viewed the NHD data in ArcGIS’s
Utility Network Analyst. The general flow is from the sides and above the
Bypass (from higher elevations to the north and west, and from
channeled/diverted water to the east); water then moves down the Bypass (mostly
along the Tule Canal and Toe Drain which run along its east side) and into the
Sacramento-San Joaquin Delta.

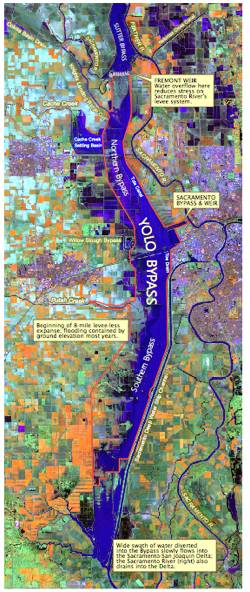
Map 5 shows inflow sources and flood
control features of the Bypass over a Landsat image
taken January 23, 2006, when the Bypass was flooded. The image bands have been
assigned to color channels in an R=4, G=5, B=3 combination that better
delineates areas of water (the smaller image shows a true-color version of the
flooding). Notice how the floodplain allows the water to spread out for slow
drainage into the Delta, while the Sacramento River stays within its path.

Fig. 3. Comparison of monthly Landsat images of the Yolo
Bypass region, showing seasonal change over the years 2008 (Row 1), 2009 (Row
2), and 2010 (Row 3). (Images for some months were not available.)
The
GLOVIS site is designed to make it fairly easy to view images before choosing and
downloading, and I took advantage of this by making screenshots of three years’
worth of monthly Landsat images. This enables a side-by-side comparison of
imagery for each month (where available and not cloud-covered), showing
seasonal patterns for 2008–2010. (Fig. 3)
ANALYSIS
I was
able to find data that allowed me to build maps showing the geographical extent
of the Yolo Bypass, as well as its water sources, direction of flow, and flood
control features, and to place the Bypass in a larger context in relationship
to the Sacramento-San Joaquin Delta.
However,
it was hard to find definitive data describing the Bypass boundaries. The GIS
data and maps I found had boundaries that greatly differed (mostly at the upper
and lower boundaries and in areas not clearly defined by levees or county
lines), and most were over generalized. So I made my own polygon for the Bypass
area, kind of a visual average of the best information I could find, and am
calling it a work-in-progress, to be updated as I find better, authoritative
data on the boundaries.
I barely
dipped into the complex NHD data for the Bypass and don’t pretend to have a
full understanding of the water dynamics of the Bypass, but the data established
a starting point for such an examination, and ArcGIS’s Utility Network Analyst
allowed me to use the NHD data to show direction of water flow, a pretty
amazing feature when figured out.
Screenshots
of satellite imagery provided a picture of seasonal changes over time, and I
found the most interesting aspect was how much the seasonal patterns are
unchanged, year after year. (I know the predictable nature of these changes is
basic to our understanding of seasons, but still it surprised me to see just
how closely a given month’s images correlated to those in other years.)
The
January 2006 Landsat image of a flooded Bypass provided a useful backdrop for
understanding the Bypass’s flood control features, and it is clear that the
design of the Bypass (levees and canals) take advantage of its natural,
historical function as floodplain.
CONCLUSION
Many
interests and users overlap in the Yolo Bypass. Wildlife habitat restoration
and protection (the Bypass is part of the Pacific Flyway bird migration route),
recreational users from bird watchers to hunters, farms and ranches with historic
family names, as well newer agricultural operations (with rice farming a $50
billion a year industry for Yolo County)—all overlay the Yolo Bypass’s
primary function as flood protection facility. They co-exist or give way to
each other in seasonal rotation, and they all are trumped by the heavy rains
and flooding of the Sacramento Valley winter. The Bypass is a rich and diverse
subject for study that could be approached in many ways, and I plan to revisit
it for future projects, building
on the foundation laid here.
It’s a
timely topic: The Yolo Bypass has been in the news in recent days, as what the
Sacramento Bee characterized as a “habitat land rush” is on, with at least one
developer pushing through a deal that may amount to speculation on the value of
habitat mitigation for the proposed Bay Delta Conservation Plan, and local
authorities hastily signing on to obtain surface water rights for Woodland and
Davis (Sangree and Weisner, Sacramento Bee, Dec. 19, 21, 2010).
REFERENCES
PUBLICATIONS
AND INTERNET RESOURCES
California Department of Fish and
Game, Yolo Basin Foundation, and EDAW, 2008.
Yolo Bypass Wildlife Area Land Management Plan. (Internet) (http://dfg.ca.gov/lands/mgmtplans/ybwa/)
Lillesand, T.M., R.W. Kiefer, and
J.W. Chipman, 2008. Remote Sensing and Image
Interpretation. Sixth Edition, John Wiley &
Sons, Inc.
Milliken, J., M. Shin, and R.
Neal, 2000. A Cooperative Project to Create Agricultural
Field-Boundary Databases in GIS—California. 2000 Esri
International User Conference. (Internet) (http://proceedings.esri.com/library/userconf/proc00/professional/papers/PAP388/p388.htm)
Sangree,
Hudson. “Habitat land rush worries rice farmers”: Sacramento Bee, Dec. 19,
2010.
Smalling, K.L., J.L. Orlando, and
K.M. Kuivila, K.M., 2005. Analysis of Pesticides in Surface
Water and Sediment from Yolo Bypass, California, 2004–2005: U.S. Geological
Survey Scientific Investigations Report 2005-5220, 20 p. (Internet)
(http://ca.water.usgs.gov/user_projects/toxics/YoloBypass.html)
U.S.
Environmental Protection Agency: Surf Your Watershed
(http://cfpub1.epa.gov/surf/locate/index.cfm)
Water Resources Association of
Yolo County, 2007. Integrated Regional Water Management Plan. (Internet) (http://www.yolowra.org/irwmp_documents.html)
Weiser, Matt. “Why Yolo Bypass Is
Prime Turf”: Sacramento Bee, Dec. 21, 2010.
Yolo Bypass Working Group, Yolo
Basin Foundation, and Jones & Stokes, 2001. A Framework for the Future:
Yolo Bypass Management Strategy. (Internet) (http://yolobasin.org/)
DATASETS
AND IMAGERY
California Department of Water
Resources: Land & Water Use: Land & Water Use Data
Collections (http://www.water.ca.gov/landwateruse/lwudatacoll.cfm)
Sacramento Area Council of
Government: Mapping Center: Regional GIS Clearing House.
(http://www.sacog.org/mapping/clearinghouse/)
U.S. Geological Survey: National
Hydrography Dataset (http://nhd.usgs.gov/data.html)
U.S. Geological Survey: USGS
Global Visualization Viewer (http://glovis.usgs.gov/BrowseBrowser.shtml)
Yolo Natural Heritage Program:
Maps, Data, and Documents. (http://www.yoloconservationplan.org/maps-and-documents.html)