Title
Bicycle and Pedestrian Transportation Trip Planner in the Sacramento Region
Author Information
Adam Davis
American River College, Geography 350: Data Acquisition in GIS; Fall 2010
Abstract
In an effort to encourage alternative forms of transportation, safe routes to
destinations, and to reduce green house gas emissions, the Sacramento Area
Council of Governments worked with local jurisdictions and advocacy groups to
develop an online Bicycle and Pedestrian Trip Planner released to the public in
the Spring of 2010.
Introduction
In an effort to provide the public with safe and alternative methods of
transportation throughout the region, the Sacramento Area Council of
Governments developed a master plan for the 6 counties in the region. With the help of local advocacy groups and
other California State departments, SACOG developed and released an online trip
planner connecting the region seamlessly and incorporating existing public
transportation systems. This trip
planner is a major highlight SACOG's Bicycle and Pedestrian Master Plan. By using this planner, the user will be doing
their part in improving air quality, decrease the number of (potential)
accidents/collision, improve personal health, as well as enjoy some of the
amazing bike trails that the Sacramento region has to offer.
Background
The Bicycle and Pedestrian Master Plan is a collection of research and projects head by the Sacramento Area Council of Governments. This plan falls within the scope of the Metropolitan Transportation Plan for 2035, a long-term plan for the entire region. The goal of this plan is to provide a link between regional and local public transportation systems, such as bus stops and light rail, fill in gaps between existing and expected areas of growth, improve safety, and provide the user with the best routes possible. The trip planner was developed and released in conjunction with the “May is Bike Month” programs which promotes and encourages participation from all agencies to use alternative transportation, specifically biking. The trip planner began to be developed in February 2008 and was released to the public as a google-map mash up. Similar transportation planners exist in Portland, Oregon as well as in Colorado, two of the front runners in sustainable planning.
Methods
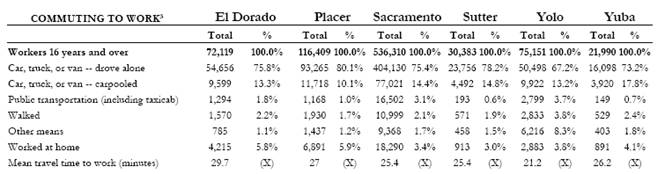
To begin the preliminary stages of planning, the
members of SACOG collected census information for the region from the 2000
Census. This information was used to
highlight the need for alternative transportation in the region. It is important to note that in almost all
counties, more than 70% of people commuted alone (see figure A). After
assessing the need for an alternative transportation planner, it was time to
collect data. The data for each county
was collected and inputted into ArcGIS. Using this software, the data was compiled
and altered so that the region was seem-less and had full connectivity of
roads, rivers, and highways between counties.
Though the use of surveys, meeting with various biking advocate groups,
and agencies such as Caltrans, Air Quality Management Districts, and each of
the six county members of SACOG, it was determined that the need for this
service was great. Through these
meetings, it was determined how to rank and classify each road way and to get
input from the specialists, in this case the cycling groups, to provide the
best approach to routing the user. Using
shapefiles provided by the counties, a complete
centerline file was created, allowing for full connectivity and correct
directionality for each road.
Implementing the advice of the bike groups, each road was classified as
being I,II, or II based on whether the road had a designated bike lane, no bike
lane, or unfit for riding (such as a freeway).
In addition to the centerline file that was created, there are many bike
trails and routes though parks that are not part of the main transportation
system. To create this file, SACOG used
aerial imagery to digitize the bike paths, making connections to the existing infrastructure. In addition, an address locator and network
analysis tool were used to create the best information possible for trip
origins and destinations.
Results
The product of this work is a Google mash up
application which was released to the public in the spring of 2010. The project uses cached imagery and presents
information in text directions and a graphic map. The map can be view as
satellite imagery or just as a transportation network. In addition SACOG has invited the public to
utilize this service and provide feedback regarding the information
provided. This is important because
there can be short term or long term changes to route which need to be
accounted for. The use of the web app
has been growing constantly work spreads about the service. The map does have its limitations, for
example, if someone wants to travel outside of county boundaries, they must
find an alternative source for routing data as it is not maintained by the
Council of Governments. In a few
instances, users have found that the tradeoff between safety and time of travel
are not equal. By maintaining the data
“in house,” and using the Google mash up style map, SACOG is able to easily
update and alter the service metadata.
The service is being published through ESRI’s ArcGIS
Server. I feel that the goals of the
project have been met. The promotion of
alternative transportation will continue to grow and influence travelers to
consider traveling by bike and public transportation. Each individual who bikes for one day, to and
from work, will be doing their part to curb car emissions and road
congestions. By using this service,
users will find the safest and most direct route to and from their destination. I also believe this to be a great tool to
provide adults and children the safest route to schools. This is a great application for this use
because it relies so heavily on the classification of roads which leads to
safety. Partnering
this service with a map of farmer’s markets leads to an even healthier
solution. Other potential destinations include, colleges, grocery
outlets, parks, restaurants, community centers, or other businesses.
Figures
and maps
Figure A (below):
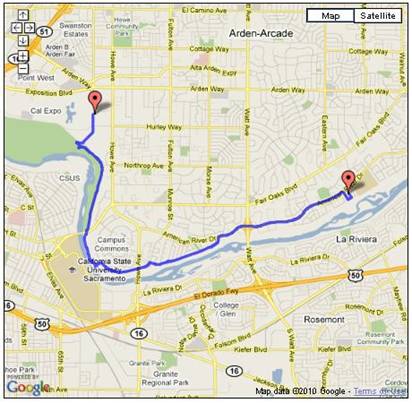
Above: Path Home to Ethan Way Center. Utilizes the American River Bike Trail. 6 mile trip.
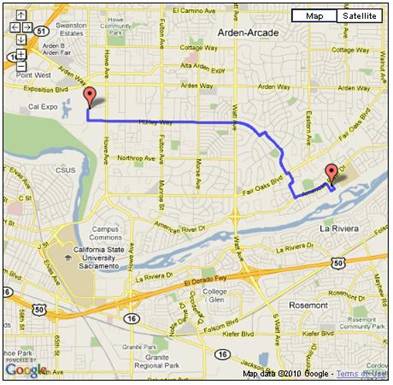
Above: The most direct route from Home to Ethan Way Center. The user will be crossing 5 major routes and
traveling on a shared roadway. 4 mile trip.
Analysis
I am very proud to have been part of the SACOG team and to have worked on this
service. I believe that the final
product fits the needs of the regions and meets the original goals established
in the Regional Bicycle and Pedestrian Master Plan. While the project took over a year to
complete since its conception, the final product represents the efforts of many
groups and individuals. The project was
well budgeted and the choice to maintain the information in-house, allows for a
cheap and effective process to alter data to create better public information. The files used in this project (specifically
the shape files for the centerline and existing bike routes) are available to
the public via the SACOG website. As the
month of May is quickly approaching, the “May is Bike Month” campaign will
focus on this service to provide riders with safe routes and good information. Accompanied by a marketing campaign to
encourage alternative transportation, the service will be highlighted and
utilized by many worker, student, and recreation users throughout the service
area. I would like to see this
information released as a mobile application for smart phones and for it to be
promoted in education systems. In
addition I believe it would be beneficial for the information be incorporated
into a different viewer allowing for multiple layers (schools, medical
facilities, parks, hiking trails, etc.) to be selected and have the application
be more user intuitive. By applying a
variety GIS techniques and layers, I strongly believe the public will utilize
this service to its full capabilities and embrace the service and new technology
available.
Conclusion
The main goal of this project is to highlight the importance of local
alternative transportation methods focusing on the use of pedestrian and
bicycle network routing. I hope that
highlighting the effort by SACOG to address the needs of the six counties in
our region will promote other states, regions, and counties to consider the
push for sustainable solutions to spatial issues. While it cannot be expected that alternative
transportation ridership will skyrocket, it is my hope that through exposure to
services such as the Bicycle and Pedestrian Trip Planner, users will be
encourage contributing to decreasing green house gas emission, increase safety
on public roads, and in the long run, help preserve our region by allowing interconnectivity
between counties. This service is a
great example of the increasing importance and trend of blending the planning
field with GIS.
References and Links
May is Bike Month Program
Sacramento Area Council of Governments, 2009. Bicycle/Pedestrian Master Plan, http://www.sacog.org/bikeinfo/pdf/masterplan/2009-08-19/Formatted%20Amend%20Regional%20Bike%20Ped%20Plan%202009%208-19-09.pdf
Sacramento Area Council of Governments, Metropolitan Transportation Plan 2035, http://www.sacog.org/mtp/2035/final-mtp/
Sacramento Area Council of Governments GIS Data Warehouse