Nancy Ying
Geog 350
Final Project
Fall 2010
Title:
Geospatial Support for Analysis of Airborne Allergens.
Abstract:
Dr. Geraghty’s research project is looking into the possibility of other factors other than pesticide spraying for West Nile Virus in making people ill. This project will look at the relationship, if any, between the pollen count on a particular day and the number of people hospitalized with asthma in Sacramento County for the year 2005.
Introduction:
This project will deal with a research project of Dr. Este Geraghty of the University of California Davis Medical Center. Dr. Geraghty is looking into the problem of when pesticide was sprayed for mosquitoes carrying West Nile Virus, many people became ill. They blamed their illness on the pesticide. Dr. Geraghty thinks there are other factors that may have contributed to people’s illness, such as pollution or pollen. Wind speed and direction will be a factor in this analysis. The scope will be limited to Sacramento County and the year 2005, since Dr. Geraghty has the data for this particular year.
Methods:
This project would look at what areas had a high pollen count and which areas had a low pollen count depending on wind speed and wind direction and if there is a relationship with the number of people hospitalized for asthma and the pollen count. These issues will be addressed by providing maps of the asthma cases within the zip code areas of Sacramento County, high and low pollen count days, and the difference in asthmas cases on the highest and lowest pollen count days.
Since Dr. Geraghty has pollen and wind speed/direction data for the whole state of California, this project, which pertains to Sacramento County, will be a model for the rest of the state data.
Results:
Wind speed/wind direction data was obtained from the California Air Resources Board, pollen count data was obtained from the National Allergy Bureau, asthma data was obtained from the California Office of Statewide Health Planning and Development, a digital elevation model (DEM) of the Sacramento region was downloaded from the USGS website, county data was obtained from the California Spatial Information Library (CaSIL), and zip code data was obtained from Sacramento County GIS.
A third-party software program was suggested by Dr. Geraghty to determine wind speed/wind direction. This software program, called WindNinja, was downloaded from the website on the Internet. (Missoula Fire Sciences Laboratory. <http://www.firemodels.org/content/view/133/169/>.
The wind speed/wind direction data was originally a .dbf file and it was saved as an Excel file. A file of monitoring sites for wind speed/wind direction in Sacramento County was originally a .dbf file with latitude/longitude, so this file was converted to an events file, then into a shapefile. The asthma data was originally a .dbf file which was saved as an Excel file. The pollen count file was an Excel file and the pollen stations file was a shapefile.
Some of the data had to be reprojected. The DEM was originally in GCS NAD 1983 and was reprojected to California Teale Albers NAD 1983. The zip code shapefile from Sacramento County was projected in California State Plane, Zone II, NAD 1983. The pollen stations shapefile was originally in GCS WGS 1984. Both the zip code shapefile and the pollen stations shapefile were reprojected to California Teale Albers NAD 1983.
Average wind speed/direction – low pollen count day:
|
SITE |
DATE |
AVG_WS |
AVG_WD |
|
2731 |
12/21/2005 |
1.5 |
246 |
|
2977 |
12/21/2005 |
3.5 |
240 |
|
3011 |
12/21/2005 |
2.5 |
257 |
|
3187 |
12/21/2005 |
2.5 |
92 |
|
5776 |
12/21/2005 |
0 |
93 |
|
5785 |
12/21/2005 |
2.5 |
253 |
|
5799 |
12/21/2005 |
1.5 |
235 |
Average wind speed/direction – high pollen count day:
|
SITE |
DATE |
AVG_WS |
AVG_WD |
|
2731 |
2/2/2005 |
2 |
142 |
|
2977 |
2/2/2005 |
3 |
193 |
|
3011 |
2/2/2005 |
3 |
224 |
|
3187 |
2/2/2005 |
2 |
201 |
|
3223 |
2/2/2005 |
2 |
208 |
|
5776 |
2/2/2005 |
1 |
208 |
|
5785 |
2/2/2005 |
3 |
349 |
|
5799 |
2/2/2005 |
1 |
210 |
Asthma cases – low pollen count day:
|
SEX |
PATZIP |
ZIPN |
SERV_DT |
|
F |
95842 |
95842 |
12/21/2005 |
|
F |
95828 |
95828 |
12/21/2005 |
|
F |
95817 |
95817 |
12/21/2005 |
|
F |
95826 |
95826 |
12/21/2005 |
|
M |
95630 |
95630 |
12/21/2005 |
|
F |
95822 |
95822 |
12/21/2005 |
|
F |
95823 |
95823 |
12/21/2005 |
|
M |
95610 |
95610 |
12/21/2005 |
|
F |
95823 |
95823 |
12/21/2005 |
|
F |
95834 |
95834 |
12/21/2005 |
|
M |
95841 |
95841 |
12/21/2005 |
|
M |
95843 |
95843 |
12/21/2005 |
|
F |
95864 |
95864 |
12/21/2005 |
|
F |
95630 |
95630 |
12/21/2005 |
|
M |
95628 |
95628 |
12/21/2005 |
Asthma cases – high pollen count day:
|
SEX |
PATZIP |
ZIPN |
SERV_DT |
|
F |
95838 |
95838 |
2/2/2005 |
|
F |
95610 |
95610 |
2/2/2005 |
|
F |
95838 |
95838 |
2/2/2005 |
|
M |
95829 |
95829 |
2/2/2005 |
|
F |
95632 |
95632 |
2/2/2005 |
|
M |
95828 |
95828 |
2/2/2005 |
|
F |
95821 |
95821 |
2/2/2005 |
|
F |
95823 |
95823 |
2/2/2005 |
|
M |
95818 |
95818 |
2/2/2005 |
|
F |
95838 |
95838 |
2/2/2005 |
|
M |
95833 |
95833 |
2/2/2005 |
|
F |
95628 |
95628 |
2/2/2005 |
|
F |
95821 |
95821 |
2/2/2005 |
|
F |
95826 |
95826 |
2/2/2005 |
|
F |
95823 |
95823 |
2/2/2005 |
Analysis:
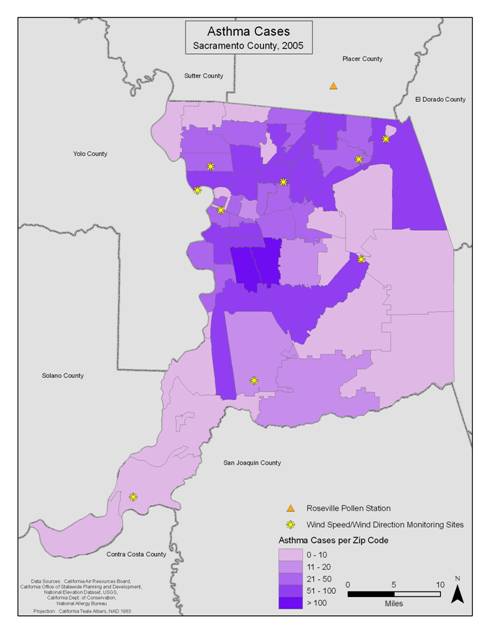
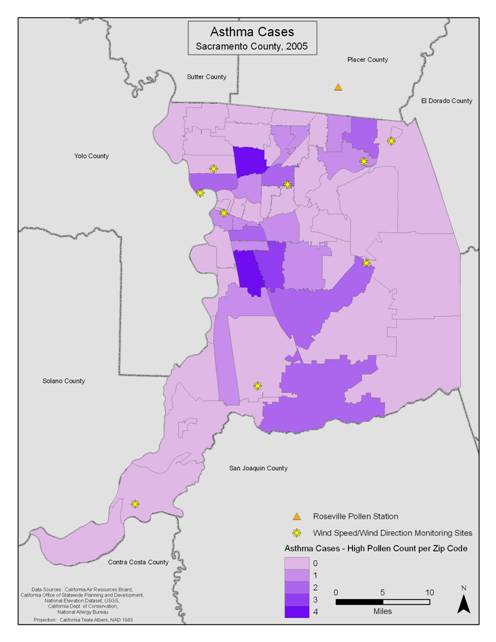
For the asthma cases, a choropleth map was developed to display the asthma cases for each zip code area in Sacramento County. An attempt was made to join the asthma cases to the zip code shapefile, but this did not work. A summary table was obtained of the total number of asthma patients for each zip code and this file was then joined to the zip code shapefile. This data was then exported into a shapefile. This procedure was also done for the high pollen count day and the low pollen count day. By doing a descending sort on the total pollen count field in the pollen data, it was determined that the highest pollen count day was February 2, 2005 and the lowest pollen count day was December 21, 2005. The asthma cases for these two days were then selected out, a summary table was obtained and joined to the zip code shapefile. Choropleth maps were then made of the asthma cases for the high pollen count day and the low pollen count day.
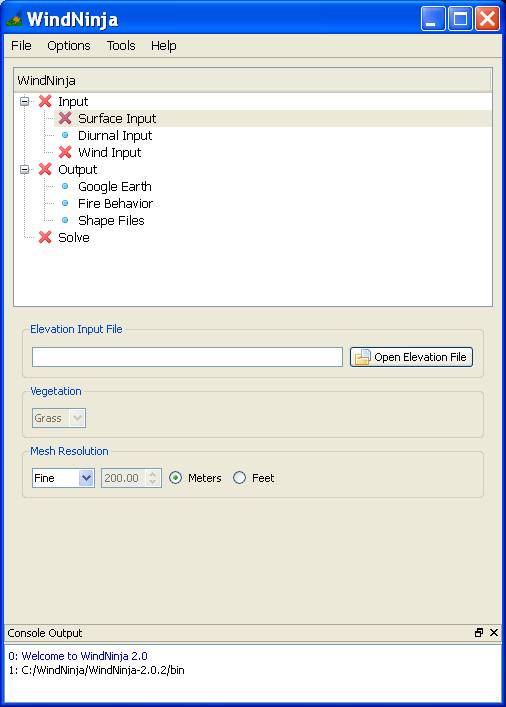
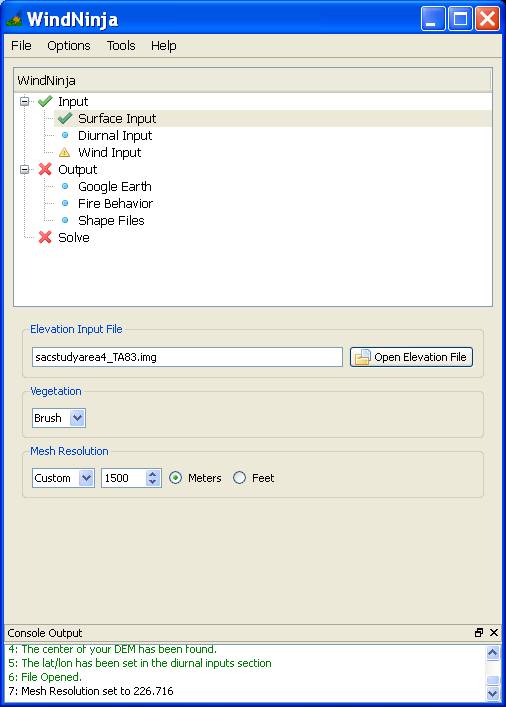
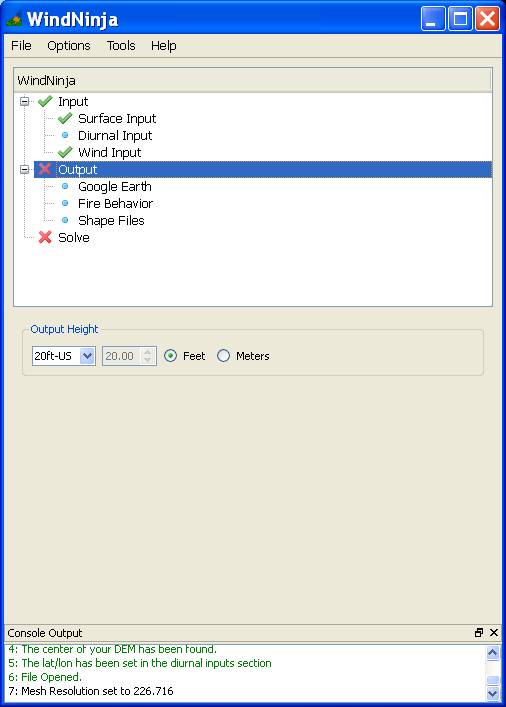
From the wind speed/wind direction data, an average wind speed and an average wind direction was obtained for the high pollen count day and the low pollen count day. This data was used in the WindNinja program, along with the DEM file. A problem occurred when the WindNinja program was first used. A runtime error occurred when the Solve button in the program was pushed. The problem was resolved when the DEM was clipped into quadrants of less than 30 x 30 miles each. Another issue was in determining the mesh resolution for the simulation. This was the distance between points in the simulation. The choices for input were “Coarse,” “Medium,” “Fine,” or “Custom.” Fine was chosen for the mesh resolution. In the resulting output, the shapefile contained 20,000 points. Dr. Geraghty was consulted about this issue and it was determined that a Custom mesh resolution of 1500 meters would be used. This was used in the simulation and a suitable amount of points (approximately 400 to 600) was generated. This was a much more manageable number of points. Another issue came up with the WindNinja program. It was possible to do a wind speed/wind direction simulation for diurnal winds using this program. Additional data was needed for the inputs, such as the date, time, cloud cover, and air temperature. The time and date was already in the wind speed/wind direction data, and the air temperature data was obtained. Research was done on the Internet to obtain cloud cover data, but there was either no historical cloud cover data for 2005 or when data was found, it had to be purchased. Because of this, it was decided that the basic wind speed/wind direction simulation would be done in WindNinja and not the diurnal winds simulation. Simulations for the high pollen count day and the low pollen count day were executed. The outputs from this program resulted in point shapefiles for each wind speed/wind direction input. These shapefiles had no projection defined, so they were defined as California Teale Albers NAD 1983. The wind speed/wind direction shapefiles were then displayed over the asthma cases for the high pollen count day and the low pollen count day and maps were generated.
Metadata sample

WindNinja program:
WindNinja – First dialog box for inputs
WindNinja – Input of Elevation data
WindNinja – Input of wind speed and wind direction

WindNinja – Output dialog box
WindNinja – Shapefile chosen as output

WindNinja – Solve

Asthma Cases in Sacramento County, 2005
Asthma Cases – Low Pollen Count Days

Asthma Cases – High Pollen Count Days
Asthma Cases on Low Pollen Count Day with Wind Speed/Direction

Asthma Cases on High Pollen Count Day with Wind Speed/Direction
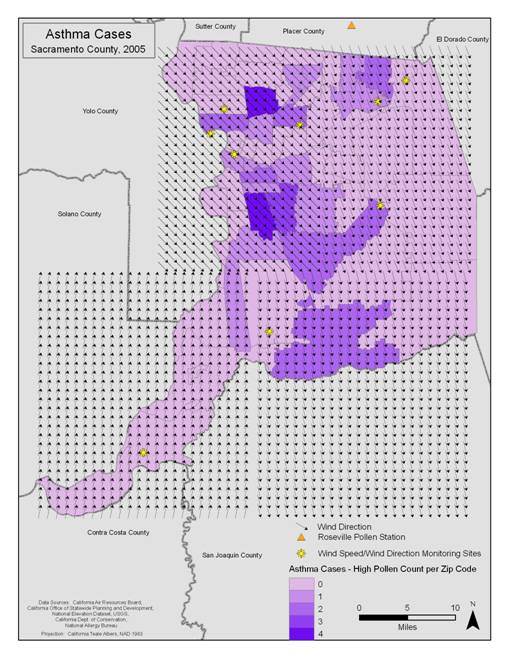
Asthma Cases on High Pollen Count Day with Wind Speed/Direction – close-up

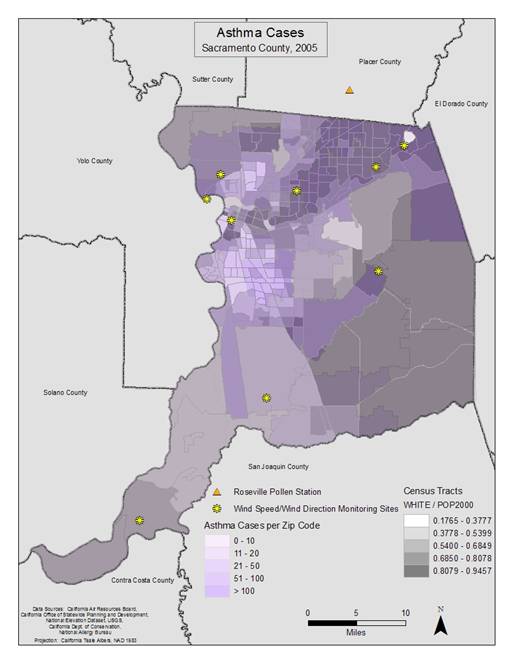
Asthma Cases with Census Tracts and Ethnicity
Conclusion:
As to the question of comparing the highest and lowest pollen
count days to asthma cases, since the pollen count data was from one station,
this would not be feasible. With more data from several stations within
the area, this analysis might be feasible.
References
California Air Resources Board . Web. <http://www.arb.ca.gov/homepage.htm>.
California Office of Statewide Health Planning and Development. Web. <http://www.oshpd.ca.gov/>.
California Spatial Information Library. Web. <http://casil.ucdavis.edu/casil/boundaries/>.
"National Allergy Bureau." American Academy of Allergy Asthma & Immunology. Web. <http://www.aaaai.org/nab/index.cfm>.
National Map Seamless Server, USGS. Web. <http://seamless.usgs.gov/website/seamless/viewer.htm>.