| Title Simulation of Bus Tracking with Integration of GIS and GPS | |
|
Author Abbasali J Alaei American River College, Geography 350: Data Acquisition in GIS; May 2011 Contact: (email: Abbas.alaei@yahoo.com ) | |
|
Abstract Making decisions based on geography is basic to human thinking. GIS technology provides a foundation for effective security management practice for public transport systems. Simulation is a tool that has been commonly used to assist with systems analysis. In this paper, GPS give us the online position of Bus and the GIS help us to view the bus position (it can be refresh to know the last position of buses) and have a query of any kind of information that we made in GIS database. For this goal we need interface software that the ARCinfo have a component for this reason. In this paper I have decided to show the sample view of bus tracking and some ability that is necessary for making decisions. | |
|
Introduction This section provides a means to know more about relation between Transportation and GIS. Transportation is all about geography. It is moving people and goods from one place to another. According to the United States Department of Transportation Bureau of Transportation Statistics, transportation goods and services were responsible for more than 10 percent of the gross domestic product in the United States in 2002. Transportation drives employment, whether it be manufacturing, driving vehicles, or maintaining the infrastructure on which these vehicles operate. One of seven jobs in the United States is transportation related. [1] Transportation geography is concerned with the patterns of movement of people and goods. These patterns, also called networks, influence the cost and availability of goods and the delivery of services. At any given geographic scale, local, regional, national, or international; the function of transportation networks has pervasive effects, both direct and indirect, on the economy, social structure, and environment for that area.[1] Because transportation networks are complex, developing networks that are safe, cost effective, and reliable typically requires considering a wide range of data that describes factors such as land use, economic conditions, and environmental considerations. In developed countries, transportation planning must take into account existing infrastructure and, for optimal efficiency, consider more than one mode of transportation. Instead of only one form of transportation, these networks employ a mix of types from automobile or railroad to pedestrian, bicycle, or light rail. This means that transportation planning can't be effectively handled in isolation from other factors. [1] GIS is an effective method for applying geography to problem solving. Datasets, data models, process and workflow models, maps and globes, and metadata are the building blocks for describing the earth; its contents and processes; and, more specifically, transportation networks. Using a geographic framework, GIS can integrate data incorporating diverse factors, resulting in solutions that realize cost savings through greater efficiency, better decision making, improved communication, and better geographic record keeping. [1] The ability to model many scenarios quickly means GIS can be used for evaluating the impact of new highway construction, identifying congestion points on a transportation network, analyzing traffic accidents and factors that contribute to their occurrence, or routing hazardous materials. The classic GIS transportation application is preparing a transportation plan. Not only does GIS enable participation in the planning process by a much broader group of stakeholders, but it can also be used in modeling both the current situation and future demand [1] .Also for controlling the driver’s act and critical accident managing, and analyzing, GIS with integration by GPS is usable for Safety and security in public transportation. Providing safe and secure public transportation systems is one of our top priorities. Situational awareness from a central location provides a way to access all our critical information in one place and monitor events that occur along the routes. GIS technology provides a foundation for effective security management practice for public transport agencies. In addition to enabling a shared view of our monitoring system, it also includes statistical and other tools for analyzing incident locations. [2] GIS tools and data sources have continually improved. Esri has advanced GIS beyond project, focused desktop applications to a complete system for authoring, serving, and using geographic information that encompasses desktop, server, Web, and mobile-based GIS. The development of three-dimensional modeling provides a more comprehensive way for dealing with transportation planning than was possible with CAD or two-dimensional mapping. Software such as the ArcGIS Network Analyst extension has been designed specifically for analyzing transportation networks. [1] The ArcGIS Data Interoperability extension has greatly enhanced direct read and translation capabilities. Now data created in many more formats can be immediately used by a GIS. Imagery data is now more available than ever. The quantity, quality, coverage, currency, and costs associated with remotely sensed data have all improved significantly in the last several years. Integrating imagery with other data sources helps maintain data that is more accurate and current. [1] .In this research we used the imagery data of city of Davis for better view and background, also the imagery has some information about intersections and serving access. Through mapping, modeling, and simulation, GIS applications for transportation can enhance the decision making process by communicating more effectively with policy makers and enabling collaboration with many stakeholders who may or may not be specialists. [1] GPS Data for online tracking GPS technology has demonstrated stellar performance ever since its inception. The uses and applications have grown at an incredibly rapid rate. From navigation to recreational uses, from mapping to precision surveying and GIS, the ubiquitous nature of GPS is impacting our lives in a positive manner. Many of these applications provide precise positions, some in real time. Delivered with this precision is an implied understanding of some fundamental concepts that are often overlooked. The GPS, Geodesy, and Application Program (GPS-GAP) is an online educational initiative by the University of Maine that offers in-depth knowledge about this fantastic system to help GPS and GIS users understand all the parameters necessary for precise positioning, including the geodetic foundation. [3] Having ambiguity fixed solutions available in real time. The discovery that emerges from the GPS-GIS intersection, supported by a solid geodetic foundation can only be described as huge. GPS users will be logging their precise GPS positions in GIS servers in real time. [3] GPS benefits Some of the benefits we might receive from GPS are: Economic reason: This is especially important for generation for several Buses and get services. Utilizing a GPS system will give us accurate directions for tracking. We will get accurate direction and constant monitoring of our current position. Also, tracking ability, easy to use, and pervasive are another reason that we use GPS. Simulation Simulation is a tool that has been commonly used to assist with systems analysis. Simulation is still widely used and is often use in combination with other techniques that we have examined including linear programming, expert systems, and neural networks. In its broadest sense, computer simulation is the process of designing a mathematical, logical model of a real system and experimenting with this model on a computer. Thus simulation encompasses a model building process as well as the design and implementation of an appropriate experiment involving that model. These experiments or simulations permit inferences to be drawn about systems: · Without building them, if they are only prototyped systems · Without disturbing them, if they are operating systems that are costly or unsafe to experiment with · Without destroying them, if the object of an experiment is to determine their limits of stress In this way, simulation models can be used for design, procedural analysis, and performance assessment. [4] Simulation modeling assumes that we can describe a system in terms acceptable to a computing system. In this regard, a key concept is that of a system state description. If a system can be characterized by a set of variables, with each combination of variable values representing a unique state or condition of the system, then manipulation of the variable values simulates movement of the system from state to state. A simulation experiment involves observing the dynamic behavior of a model by moving from state to state in accordance with well-defined operating rules designed into the model. Interpolation methods produce one value for every location. In reality, there are many, equally probable values that could occur at each un sampled location (the true value for each un sampled location is unknown). Geo statistical simulation produces multiple surfaces that mimic the real phenomenon and provide these possible values, giving a basis for risk analyses, economic decision making, and other estimations involving uncertainty, allowing analysts to make more informed decisions. [4] · Conditional Simulation · Unconditional Simulation · Post processing (clipping, summary statistics for cells and for polygonal areas of interest)[5] We almost use simulation method to achieve these goals: 1. With simulation we can estimate the cost and time to do real project. 2. With simulation we make special goal .for example if we want to make a decision on critical situation or emergency time, we need to check how does the system work? Also we can estimate system respond and get feedback. 3. To make and find the best method to generate it for all parts of our systems or network 4. The simulation system is a best way for training personnel. 5. We can have a relation between real world and fake view (temporal GIS) 6. We can test our module and model in simulation program. | |
| |
|
Background Between the 1860’s and 1902 the mines on the northern foothills of Mount Diablo California produced an estimated 20 million dollars worth of coal (Purcell, 1940). During that period five towns were established based upon the coal industry. The towns of Nortonville and Somersville were the largest. The most extensively written work available to the public is the book “History of Contra Costa County”, by Mae Purcell. In the book, a brief chapter details coal industry during that period. The book is well written, however it lacks any maps.What sparked my interest in the actual location of the town sites were several pictures in the above mentioned book. The pictures gave me an idea of the layout of Nortonville. However as already explained, there were no maps readily available to give me the actual layout of both Nortonville and Somersville. | |
| |
|
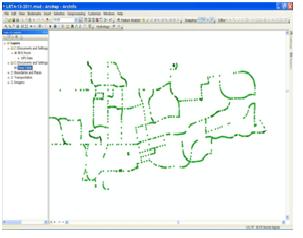
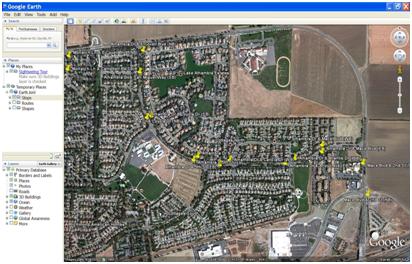
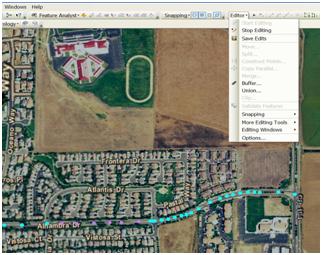
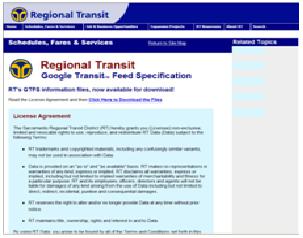
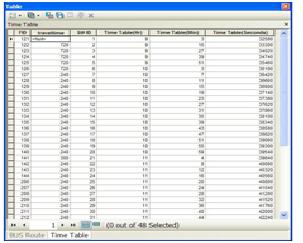
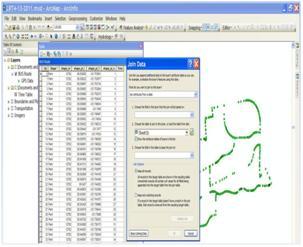
Methods Methodology: 1. Data Gathering: For simulation we need to have a data that is categorized in three different kinds. They are consisting: a) Providing a Map for background Google earth is one of best resource for background and 3D view of earth and our project area (city of Davis, ca). b) GPS data of bus route The Data source is from internet. [6] c) Time table of bus schedule 2. Editing and viewing data: a) Projection First step for getting the map is checking and changing the Projection system and Datum for base map and all other data. b) Versify GPS data for viewing in Arcmap c) Edit the GPS data In the next step, we have to edit GPS data because the bus has a variable velocity and it makes different distance of GPS points. So for having better view in tracking we add some points in bus route with editor menu in Arcmap (start editing in Arc map). d) Working on Databases ,using joint function between GPS data and bus time table: This part is very important and is a hard part because if the excel file has a bug or wrong format, the tables cannot joint together. So it takes time to know the problems and fix them. e) Time Table : For jointing the tables we have to Change the bus time table to different format to get ready for Simulation. Bus speed is changing and it changes when start moving from station, stopping before each station, intersections, and topography, the map shows between points that GPS get them is different distance and it makes a problem for processing and viewing, so I simulate the route path with adding some point. Also we need time table of buses. the database needs time to shows tracking in different time; also it shows speed of bus to have better feel in simulation. So we changed the regular time to second from 12:00 pm for example 08:25:36 A.m. is equal to 36+ (25*60) + (08*3600) =30336 seconds. f) Final database Final database included FID, lat, long, H, start and end points of bus station, time, and more fields that we can add in our database. 3. Simulation process: --- The simulation process has tree part. They are: a) Make an application or writing code for refresh the view page every one or two seconds (optional time in program). b) Making a symbol of bus for view on the map c) Making the Database of our information such as: the name of driver, bus plate number, Driver’s Cell phone number, car speed, maximum speed limit, and … . St # Address Bus # Driver name Cell # Capacity Max Speed Dist. From Start Direction to Estimate time to End St1 How crossing Hurley B1 Alex 916-283-1111 36 35 Mph 500 ft B 1890seconds B2 Jay 916-283-1112 40 46 Mph 980 ft B 1360 seconds B3 Merry 916-283-1113 36 33 Mph 170 ft A 2053 seconds St2 Watt crossing Elcamino B4 Kavin 916-283-1114 36 41 Mph 640 ft A 3533 seconds At the end we have to had the route of buses, online position of buses, and Database and query option.Also as in the last figuration shows we have a view of route of buses and database of some information that we can use it emergency time or for making deciesion. --- --- | |
Data Input | |

| |
Data Input | |
| |
| |
| |
Results of Data Acquisition: | |
| |
|
Conclusions A good GIS program is able to process geographic data from a variety of sources and integrate it into a map project. To have a better result, more research and writing the program is required. This simulation system is as a pilot project and we can improve it for school buses, trains, LRT, trucks, and company’s deliveries. In this paper the technique for transferring data from vehicle to central office supposed to be an important part of project that is not our goal. The query option and log system should be in the program. Having ambiguity fixed solutions available in real time. The discovery that emerges from the GPS/GIS intersection supported by a solid geodetic foundation can only be described as huge. GPS users will be logging their precise GPS positions in GIS servers in real time. | |
|
Acknowledgement: This paper is based upon work supported by instuctor Paul Veisze, American River College. Thanks for his support and guidance during this project and paper. | |
|
References 1) http://www.esri.com/news/arcuser/1006/umbrella-37.html 2) http://www.esri.com/industries/public_transit/business/security.html 3) http://www.esri.com/library/bestpractices/using-gis-with-gps.pdf 4) https://engineering.purdue.edu/~engelb/abe565/week13.htm 5) http://www.esri.com/software/arcgis/extensions/geostatistical/simulate.html 6) www.sacrt.com/gtfs.stm 7) ArcGIS software help, Using GIS with GPS, march 2009, www.ESRI.com 8) http://www.articlecity.com/articles/auto_and_trucks/article_870.shtml | |