| Title WELL BEING INDEX (WBI) / HAPPINESS INDEX
|
Author HoangChi Smith American River College, Geography 350: Data Acquisition in GIS; Spring 2011 Contact Information hoangchi.hcsmith@gmail.com |
||||||||||||||||||||||||
|
Abstract The Sacramento Green Initiative lead by SACOG, selected governmental agencies, public sectors, concerned citizens and mayor Kevin Johnson to implement the Blueprint vision for a greener Sacramento. Sacramentans want to thrive and prosper in a greener way. I've attended some of the Blueprint events and I was fascinated with the notion of the collective Well-Being of our citizens in the Sacramento area. Coupled with the newly acquired knowledge of the "N" dimension, or the abstract notion for the Geospatial coordinate, I've became interested in finding out what is the definition of Well-Being, how it's being measured, why it's being measured, and by whom. The study involved perusing many websites and online articles, many of which referenced the data powerhouse Gallup-Healthways. As a result, ESRI and Gallup-Healthways provided the majority of my data sources for my study and mapping. The focus of the study was on the selected California cities on their Well-Being Index, and their six subindexes. Their WBI standing is shown in tabular , spatial and graphic formats. I chose nine large cities to compare and contrast their standing and hoped to see some meaningful trends. It's premature and superficial to draw conclusions or significance from this study and it begs further research. However, the study accomplishes its preset goals and serves as a sufficient starting point for an in-depth study on Well-Being for these said cities, but most importantly, for the city of Sacramento. The processes of data acquisition highlighted the importance of updated, accurate, and free datasets. Plenty of data is available but it may not be the most updated or will require extensive preparations for analysis and mapping. I've learned to collect free datasets whenever they are available to build a repository for future analyses. Using alternate source of data and information is part of the research and study of any project when there is a budget of time and resources, and this project is not an exception. I would like to spend more time to refine the study, find additional datasets, and perform analyses on key components for successful and healthy communities-hence their well-being. | |||||||||||||||||||||||||
|
Introduction Happiness is a qualitative and subjective notion that is based on cultural and personal experience and is not easy to quantify. However, statiscally, Gallup-Heathways scientifically polls and analyzes 1000 people daily and compiles the Well-Being Index which could be synonomous with Happiness. It is an accumulative result index from six subindexes to quantify the attributes of well-beings. Well-Being can be looked at as the abstract "N" dimension in Geospatial, apart from the "x, y, z, and t" dimensions, which will be discussed later in the study. | |||||||||||||||||||||||||
|
Background The first lecture at American River College's Data Acquisition class introduced the "N" dimension of the GIS Data where coordinates are known in x, y, z (depth), t (time), and n (abstract attributes and notions). This lecture inspired my project paper's topic on the notion of "Happiness", what it is, how it might be measured, why it is being measured, and by whom. Several articles have captured my attention on the subject of Happiness, but three are worth noting: Mendez, Elizabeth. “Americans' Life Evaluation Climbs to Three-Year High. More Americans "thriving" in January than in any other month on record.” Well-beingindex.com. 10 February 2011. Web. Date accessed, 28 February 2011. Mendez' article, "Americans' Life Evaluation" From Mendez's article, I learned that the majority of my data sources would come from Gallup-Healthways's robust data compilation. I've searched the web for other sources but they invariably referenced their findings back to Gallup-Heathways. For example, for my selected California Cities' Well-Being Index, I used their in-depth research and study: State of Well-Being. 2009. A PDF of State report of cities, counties and congressional district's well-being index. On July 14th, 2010 Forbes magazine drew a possible correlation between income, basic access and happiness in this article, The World's Happiest Countries. I've visited many websites for data, one was worth noting, If It were My Home. It categorizes fundamental living conditions in every country in the world, and provides this webtool to compare one country's conditions to another's. This added contextual information for the Well-Being Study but its data was not used. | |||||||||||||||||||||||||
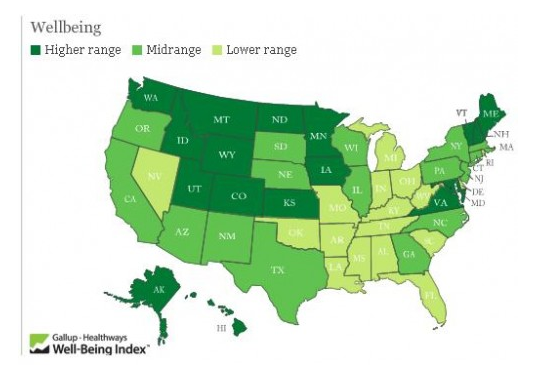
The topic of Happiness and Well-Being have been studied and discussed by by Eastern and Western philosophers since ancient times. In modern day, data is methodically collected and statiscally analyzed to be used in government agencies for policy making, and in private sectors to either promote corporate's bottomline, or to promote collective social good. There are many reasons for collecting and analyzing data for the Well-Being Index of a city, state or nation. These are foundations for policy changes, public health and wellness, economic development, etc. Social Scientists can now tap into the Well-Being study from the Gallup-Healthways for its robust data and information: The Society Pages. The followings are excerpts of sale pitches from Gallup and ESRI. ESRI "You Can Use Updated Demographics to: * Study population changes. * Evaluate how seniors impact community services. * Determine if area housing options fit your population. * Identify services needed for seniors, children, and non-English speakers." Gallup "City Prosperity-Gallup metrics and research-based consulting help cities grow and prosper. Historically, leaders have focused on traditional indicators such as GDP, unemployment, educational test scores, and literacy levels to assess the health of cities. Behavioral economics research, however, demonstrates the limitations of these traditional measures. Gallup expertise on community attachment, economic competitiveness, and talent and innovation informs and empowers leaders to create healthy and economically vibrant cities that attract and retain top talent." "Additionally, the Gallup Student Poll measures and tracks hope, engagement, and wellbeing in schools to help students become creative, productive, and healthy members of their community. These metrics create the connection between what is happening in schools to the wider community as well as adding a new perspective on teacher quality and school environment." The inset map, Well-Being, is published on Gallup-Healthways website to show the current month of May's USA Well-Being of each state in three ranges. This website publishes daily report of Well-Being Index and its six subindexes in a graph formats. Mapping data such as feature classes with attributes for each city and state is not made available. The only data Gallup-Healthways made available for downloads is in .csv files. Since the instructor covered in class in great lengths how to convert different file formats to be useful for mapping, this process of obtaining .csv file, and converting it to .xls and .dbf files to be joined to spatial feature class made data acquisition and processing a meaningful reality. My workflow for data acquisition follows two folds, collecting tabular and spatial data for Well-Being for the USA as a nation, 50 states, and selected cities in California. Most importantly, both data formats are for the year 2009. This is the most recent year with complete information on the Well-Being Index. |
| ||||||||||||||||||||||||
| Data acquisition is time consuming to mine for meaningful and updated data in useful formats. The challenges I've faced was the lack of alternate tabular data sources besides Gallup-Healthways. For examples, the 2000 Census data is available but it is outdated, and ESRI's data is only available in data layers, not feature classes with attributes. In addition, .cvs files obtained from Gallup-Healthways were monthly data only for the whole country of the United States, not cities or states, where the focus of my study lies. In addition, this data needed to be normalized for classifications, symbolization, and joined to spatial data. Alternatively, I symbolized the states and city feature class obtained from Cal-Atlas and ESRI, and categorized them in five quintiles of Well-Being Index based on the available graphic data from page 3 of 18 of the PDF for 2009 Well Being. (See inset on the right). Top Quintile being the highest, and Fifth Quintile being the lowest or bottom Prior to the study, I had the impression that coastal states with good weather would promote healthier habits, physical and emotional health which would lead to higher quality work environments, and consequently yields higher index of well-being and life evaluation. However, this assumption is not validated by the findings nor there is evidence of direct correlations. On the contrary, land-locked Midwestern states such as Utah, Colorado, Kansas, Iowa, and Montana were ranked in the top quintile. |
| ||||||||||||||||||||||||
|
Results Gallup-Healthways provides the tabular data source for Well-Being Index. This data was used to fill out the attribute fields in spatial data for cities, states, and the USA's political boundaries. Each selected city has seven additional attributes added to the original feature class. These attributes are the Well-Being Index, Life Evaluation, Emotional Health, Work Environment, Physical Health, Basic Access, and Healthy Behaviors. Again, I used the Quintile method classified by Gallup-Healthways to rank and symbolized these selected cities, states, the USA's Well-Being and subindexes. The followings are Gallup-Healthways'definitions of Well-Being Index, its six subindexes, and the criteria for their Cantril-Scale of measurement for Life Evaluation. “The Well-Being Index score is an average of six sub-indexes, which individually examine life evaluation , emotional health , work environment , physical health , healthy behaviors , and access to basic necessities . The Index is calculated on a scale of 0 to 100, where a score of 100 would represent ideal wellbeing.” “The Emotional Health Index: smiling or laughter, learning or doing something interesting, being treated with respect, enjoyment, happiness, worry, sadness, anger, stress, and diagnosis of depression.” “The Healthy Behavior Index includes four items: smoking, eating healthy, weekly consumption of fruits and vegetables, and weekly exercise frequency.” “The Physical Health Indexincludes 18 items, which measure: sick days in the past month, disease burden, health problems that get in the way of normal activities, obesity, feeling well-rested, daily energy, daily colds, daily flu, and daily headaches.” “The Basic Access Indexincludes 13 items: access to clean water, medicine, a safe place to exercise, affordable fruits and vegetables; enough money for food, shelter, healthcare; having health insurance, having a doctor, having visited a dentist recently; satisfaction with the community, the community getting better as a place to live, and feeling safe walking alone at night.” “The Work Environment Index, includes four items: job satisfaction, ability to use one's strengths at work, supervisor's treatment (more like a boss or a partner), and is it an open and trusting work environment.” Cantril Self-Anchoring Striving Scale used in Life Evaluation: "Thriving -- wellbeing that is strong, consistent, and progressing. These respondents have positive views of their present life situation (7+) and have positive views of the next five years (8+). They report significantly fewer health problems, fewer sick days, less worry, stress, sadness, anger, and more happiness, enjoyment, interest, and respect. Struggling -- wellbeing that is moderate or inconsistent. These respondents have moderate views of their present life situation OR moderate OR negative views of their future. They are either struggling in the present, or expect to struggle in the future. They report more daily stress and worry about money than the "thriving" respondents, and more than double the amount of sick days. They are more likely to smoke, and are less likely to eat healthy. Suffering -- wellbeing that is at high risk. These respondents have poor ratings of their current life situation (4 and below) AND negative views of the next five years (4 and below). They are more likely to report lacking the basics of food and shelter, more likely to have physical pain, a lot of stress, worry, sadness, and anger. They have less access to health insurance and care, and more than double the disease burden, in comparison to "thriving" respondents." In conclusion, Gallup-Healhways has the most comprehensive database of Well-Being Index and is most scientifically researched. For this reason, it is the sole source of my tabular data for this study. . | |||||||||||||||||||||||||
|
This table ranks nine selected California cities by their Well-Being Index. Top Quintile being the highest ranking, and 5th being the lowest ranking. Top Quintile cities are San Jose, San Francisco, and Santa Rosa. 2nd Quintile cities are Los Angeles, San Diego and Sacramento. 3rd Quintile city is Vallejo. 4th Quintile city is Fresno. 5th Quintile city is Bakersfield. | ||||||||||||||||||||||||
|
Map of Selected Cities Well-Being Index | |||||||||||||||||||||||||
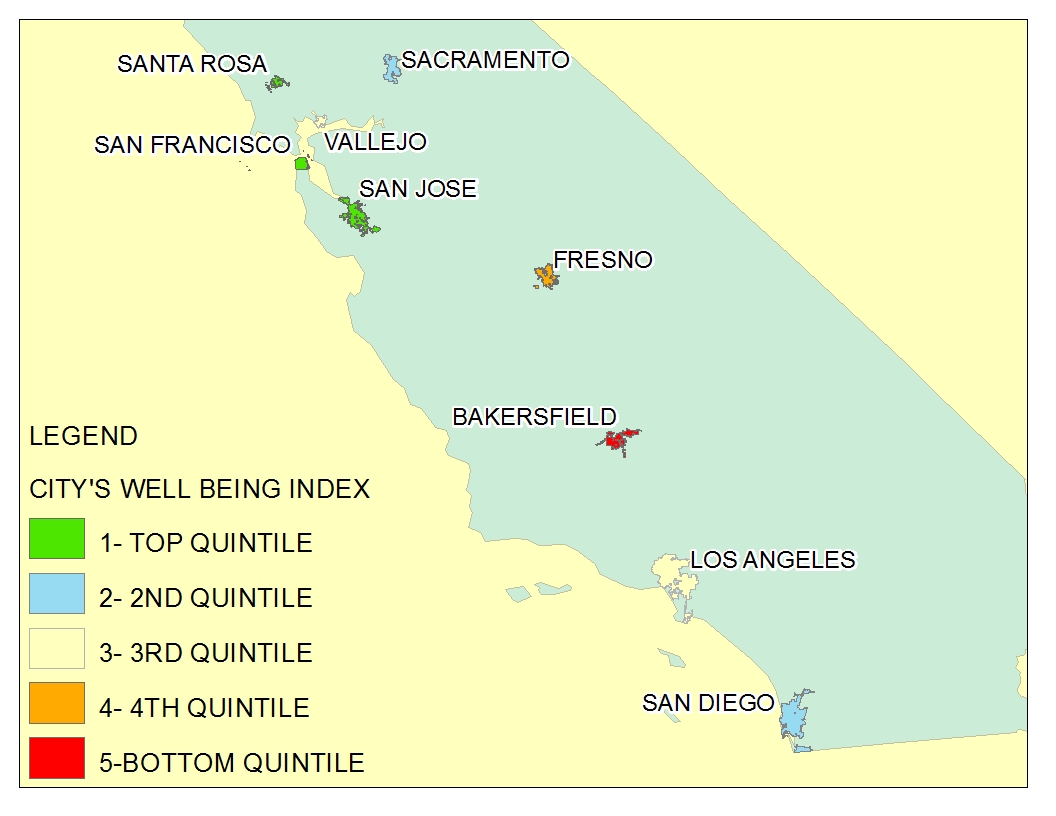 |
This map shows California ranks in the 2nd Quintile nationwide on the State level. In addition, it shows nine selected cities and their Well-Being Indexes. | ||||||||||||||||||||||||
|
Table and Map for City of Sacramento | |||||||||||||||||||||||||
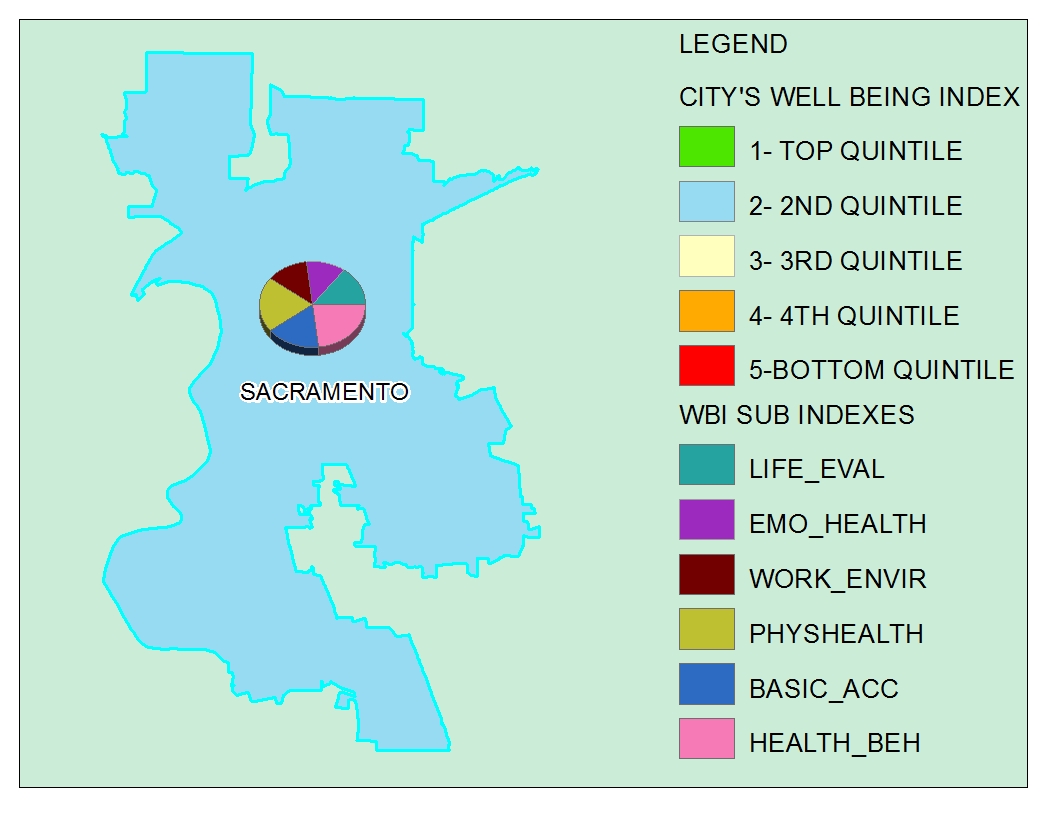 |
CITY OF SACRAMENTO | ||||||||||||||||||||||||
| |||||||||||||||||||||||||
|
Table and Map for Cities of Vallejo and San Diego . | |||||||||||||||||||||||||
CITY OF VALLEJO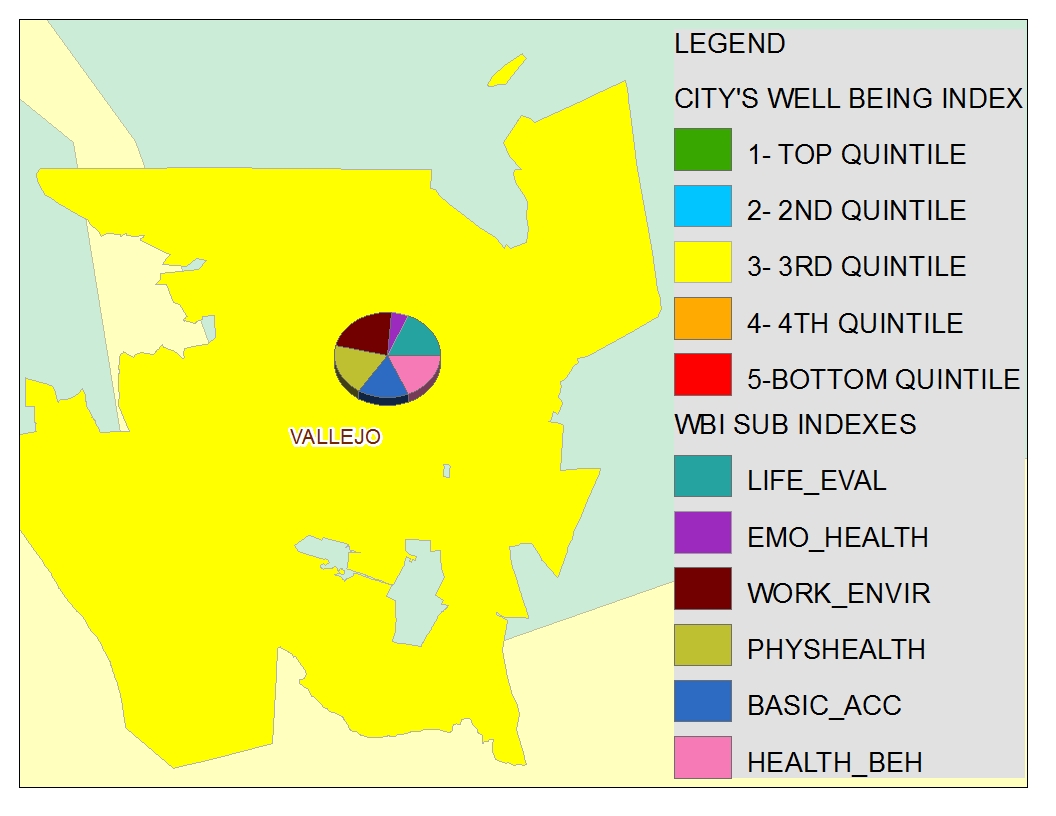 |
CITY OF SAN DIEGO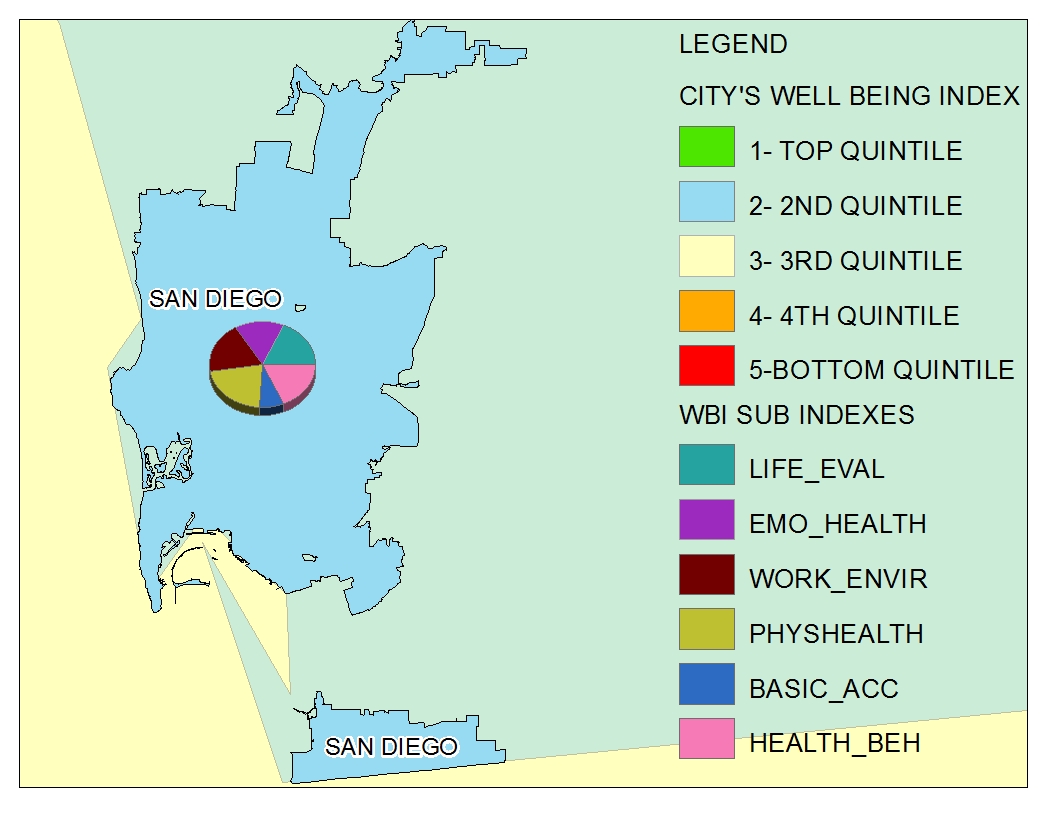 |
||||||||||||||||||||||||
|
|||||||||||||||||||||||||
|
Table and Map for the Cities of San Jose and San Francisco . | CITY OF SAN JOSE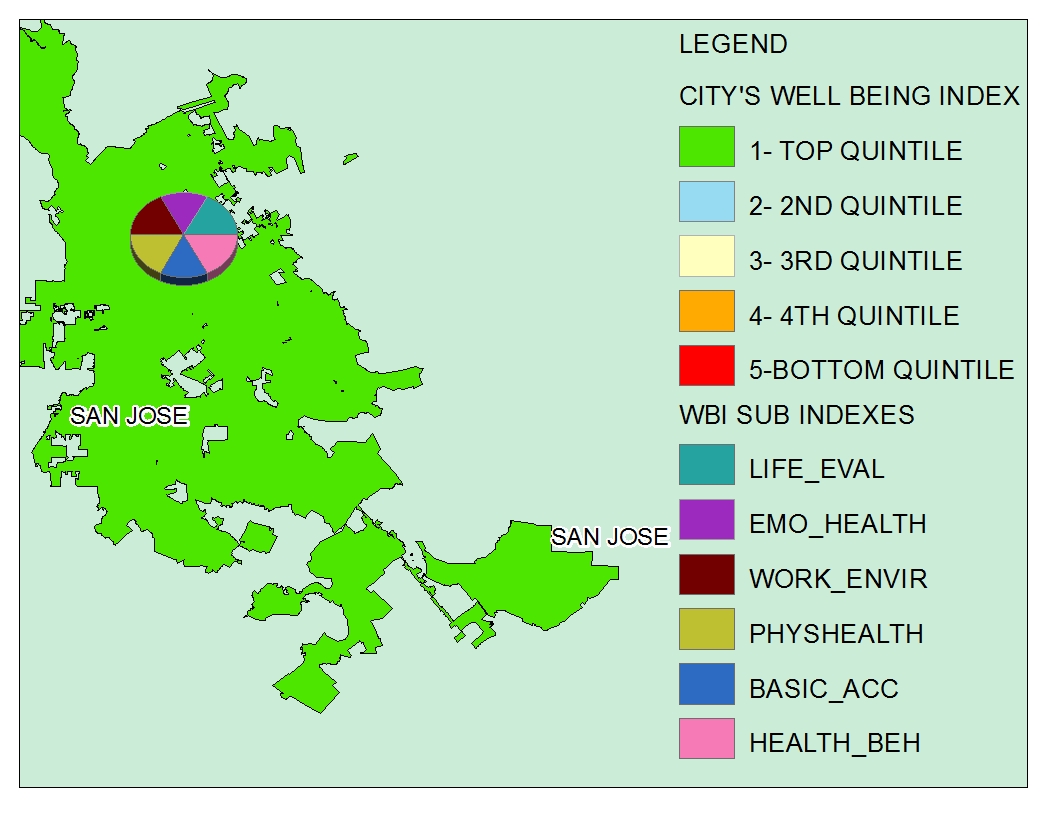 |
CITY OF SAN FRANCISCO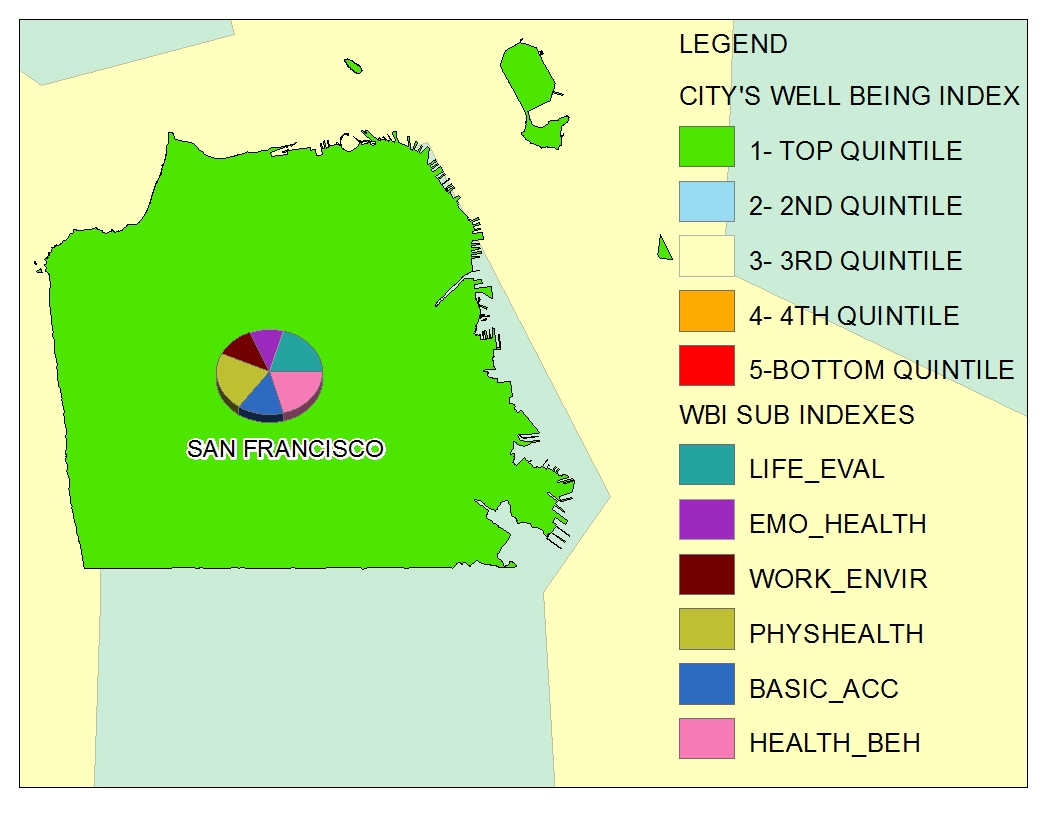 |
|
||||||||||||||||||||||
|
Table and Map for Cities of Bakersfield and Los Angeles . | |||||||||||||||||||||||||
CITY OF BAKERSFIELD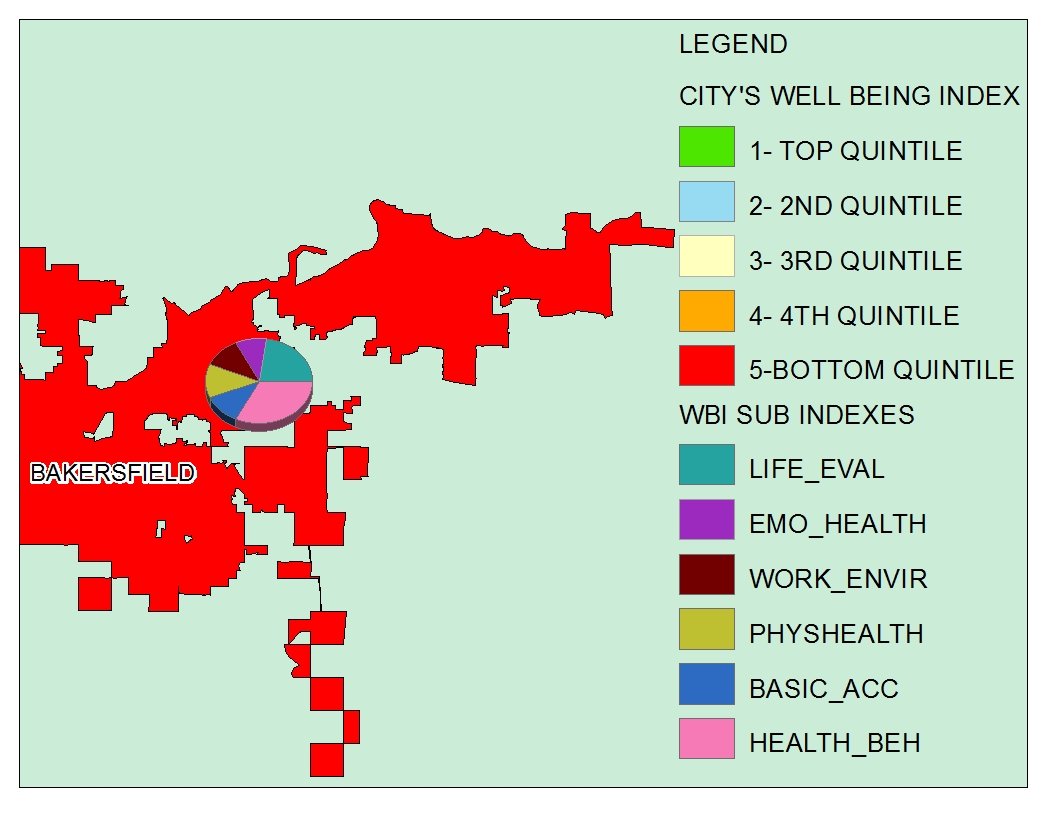 |
CITY OF LOS ANGELES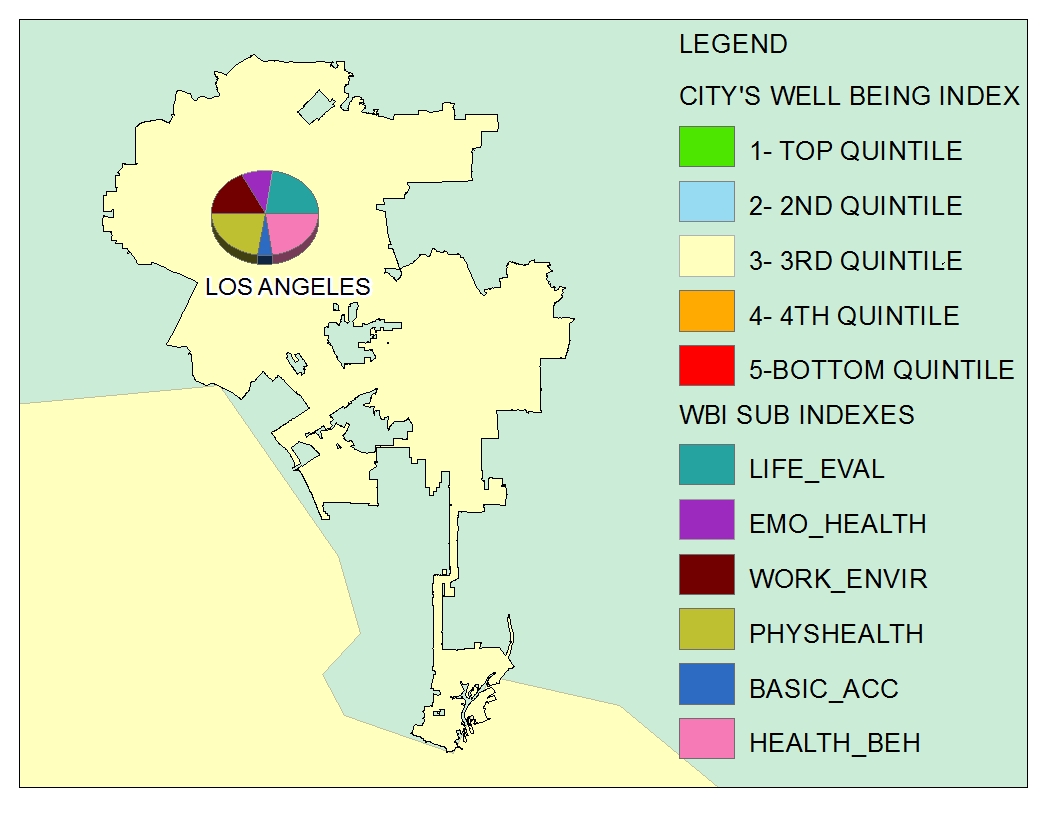 |
||||||||||||||||||||||||
|
|||||||||||||||||||||||||
CITY OF SANTA ROSA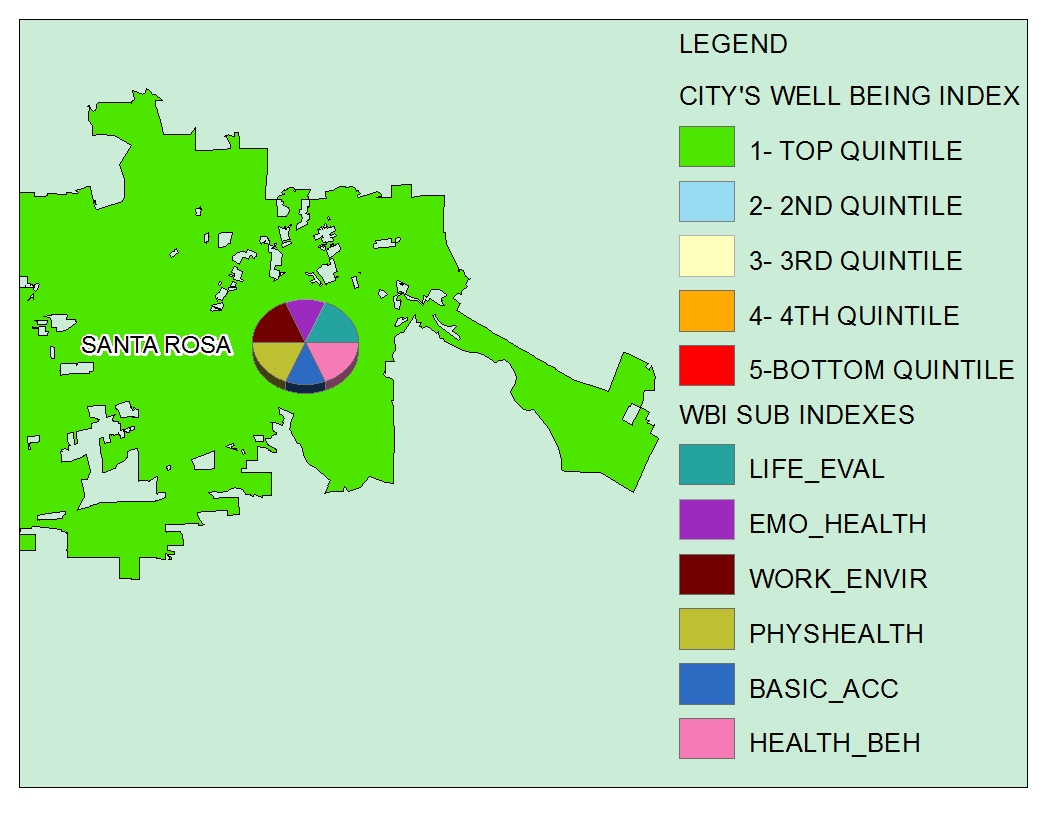 |
CITY OF FRESNO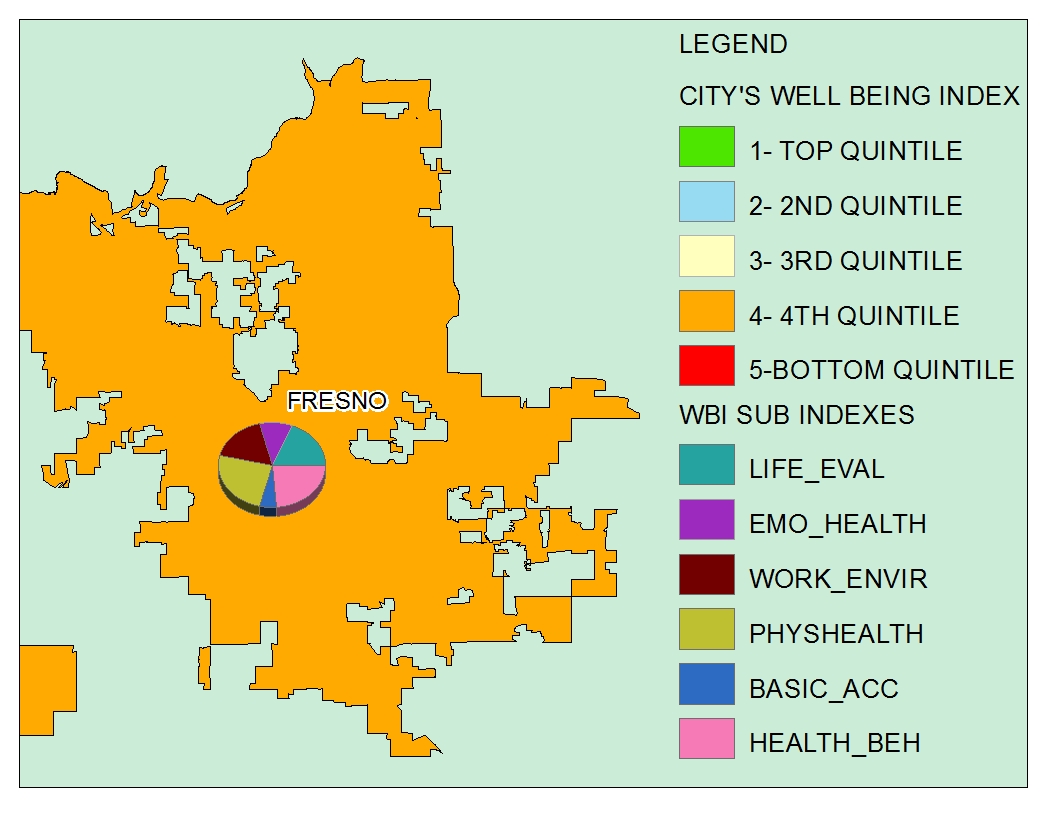 |
|
|||||||||||||||||||||||
|
Analysis The purpose and scope of this study is to apply one standard scale and methodology to categorize, symbolize and graphically present the Well-Being Index for the whole of the United States, the 50 states, and the selected cities of California. It is beyond the scope of this study to analyze the causes for the index and subindexes, although, one visual trend can be ascertained, the California coastal metropolitan cities are ranked amongst the highest in Well-Being Index, and the land-locked cities are ranked amongst the lowest. It is most challenging and time consuming to obtain free attributive datasets as opposed to image layers. For example, ESRI has many map applications to show the country's medium income, unemployment, change in population, age groups, etc. However, these datasets are sold at a premium and not available as free downloads. California cities'datasets can be accessed only in county shapefiles via the city, county's, and national GIS websites. However, the Well-Being Index data from Gallup-Healthways were presented in city-wide formats and this necessitated the acquisition of the illusive city's shapefiles. Fortunately and ultimately, the source for my California cities came from the instructor's CD collection from ESRI, as a part of the ARC's ArcGIS software purchase. | |||||||||||||||||||||||||
|
Conclusions Overall, I'm satisfied with the study as an initial foundation for an in-depth research project, where I can compare and contrast the highest ranked versus the lowest ranked California cities. Although the visual trend for the United States doesn't show coastal states ranking highest, the visual trend for California cities does draw that initial assessment and correlation. The map shows three out of four coastal cities ranked highest on the Well-Being Index, and that there might be a correlation of geographic locations of coastal cities being ranked higher than those land-locked cities. Again, this is only an observation based on the nine selected cities and is beyond the scope of this study. | |||||||||||||||||||||||||
|
References http://www.diva-gis.org http://www.forbes.com http://www.well-beingindex.com http://nationalatlas.gov/mld/bound0m.html http://www.ifitweremyhome.com/compare/US/AF http://www.esri.com/ and http://explorer.arcgis.com http://data.geocomm.com/catalog/US/61069/index.html http://thesocietypages.org/socimages/2011/03/07/map-of-u-s-well-being-indicators/ Literature cited. Levy, Francesca. "The World's Happiest Countries".forbes.com. July 14 2010, 05:00 PM EDT. Web. Date accessed, March 2011. Mendez, Elizabeth. “Americans' Life Evaluation Climbs to Three-Year High. More Americans "thriving" in January than in any other month on record.” Well-beingindex.com. 10 February 2011. Web. Date accessed, 28 February 2011. Sharp, Gwen Ph.D. and Wade, Lisa Ph.D. "Map of U.S. Well-Being Indicators".thesocietypages.org. Mar 7, 2011, at 04:44 pm. Web. Date accessed, 8 May 2011. | |||||||||||||||||||||||||
|
Appendices Galllup-Healthways Survey Methods Results are based on telephone interviews conducted as part of the Gallup-Healthways Well-Being Index survey Jan. 1-Jan. 31, 2011, with a random sample of 29,199 adults, aged 18 and older, living in all 50 U.S. states and the District of Columbia, selected using random-digit-dial sampling. For results based on the total sample of national adults, one can say with 95% confidence that the maximum margin of sampling error is ±1 percentage point. Interviews are conducted with respondents on landline telephones and cellular phones, with interviews conducted in Spanish for respondents who are primarily Spanish-speaking. Each daily sample includes a minimum quota of 200 cell phone respondents and 800 landline respondents, with additional minimum quotas among landline respondents for gender within region. Landline respondents are chosen at random within each household on the basis of which member had the most recent birthday. Samples are weighted by gender, age, race, Hispanic ethnicity, education, region, adults in the household, cell phone-only status, cell phone-mostly status, and phone lines. Demographic weighting targets are based on the March 2010 Current Population Survey figures for the aged 18 and older non-institutionalized population living in U.S. telephone households. All reported margins of sampling error include the computed design effects for weighting and sample design. The Life Evaluation Index is based on the Cantril Self-Anchoring Striving Scale, which asks respondents to evaluate their present and future lives on a scale with steps numbered from 0 to 10, where "0" is the worst possible life and "10" is the best possible life. Those who rate today a "7" or higher and the future an "8" or higher are considered to be "thriving." Those who rate today and the future a "4" or lower on the scale are considered to be "suffering." The overall Life Evaluation Index score is calculated as the percentage of thriving Americans minus the percentage of suffering Americans. In addition to sampling error, question wording and practical difficulties in conducting surveys can introduce error or bias into the findings of public opinion polls. For more details on Gallup's polling methodology, visit http://www.gallup.com/. | |||||||||||||||||||||||||