| Title U.S. Agricultural Industry and Immigration | |||||||||||||||||||||||||||||||||||||||||||||||||||||||||||||||||||||||||||||||||||||||||||||||||||||||||||||||||||||||||||||||||||||||||||||||||||||||||||||||||||||||||||||||||||||||||||||||||||||||||||||||||||||||||||||||||||||||||||||||||||||||||||||||||||||||||||||||||||||||||||||||||||||||||||||||||||||||||||||||||||||||||||||||||||||||||||||||||||||||||||||||||||||||||||||||||||||||||||||||||||||||||||||||||||||||||||||||||||||||||||||||||||||||||||||||||||||||||||||||||||||||||||||||||||||||||||||||||||||||||||||||||||||||||||||||||||||||||||||||||||||||||||||||||||||||||||||||||||||||||||||||||||||||||||||||||||||||||||||||||||||||||||||||||||||||||||||||||||||||||||||||||||||||||||||||||||||||||||||||||||||||||||||||||||||||||||||||||||||||||||||||||||||||||||||||||||||||||||||||||||||||||||||||||||||||||||||||||||||||||||||||||||||||||||||||||||||||||||||||||||||||||||||||||||||||||||||||||||||||||||||||||||||||||||||||||||||||||||||||||||||||||||||||||||||||||||||||||||||||
|
Author Brian Coward American River College, Geography 350: Data Acquisition in GIS; Fall 2011 Contact Information (1110 West Capitol Ave, West Sacramento, CA, 95691, (916)617-4673, email: brianc@cityofwestsacramento.org) | |||||||||||||||||||||||||||||||||||||||||||||||||||||||||||||||||||||||||||||||||||||||||||||||||||||||||||||||||||||||||||||||||||||||||||||||||||||||||||||||||||||||||||||||||||||||||||||||||||||||||||||||||||||||||||||||||||||||||||||||||||||||||||||||||||||||||||||||||||||||||||||||||||||||||||||||||||||||||||||||||||||||||||||||||||||||||||||||||||||||||||||||||||||||||||||||||||||||||||||||||||||||||||||||||||||||||||||||||||||||||||||||||||||||||||||||||||||||||||||||||||||||||||||||||||||||||||||||||||||||||||||||||||||||||||||||||||||||||||||||||||||||||||||||||||||||||||||||||||||||||||||||||||||||||||||||||||||||||||||||||||||||||||||||||||||||||||||||||||||||||||||||||||||||||||||||||||||||||||||||||||||||||||||||||||||||||||||||||||||||||||||||||||||||||||||||||||||||||||||||||||||||||||||||||||||||||||||||||||||||||||||||||||||||||||||||||||||||||||||||||||||||||||||||||||||||||||||||||||||||||||||||||||||||||||||||||||||||||||||||||||||||||||||||||||||||||||||||||||||||
|
Abstract Undocumented workers currently make up a large percentage of the US labor force, especially in the agriculture industry. Current immigration policy does not meet the demand for agriculture workers not met by US citizens and legal residents. This paper will explore the relationship between undocumented and documented, foreign-born agricultural workers and will illuminate the gaps, if any between supply and demand in the agriculture workforce and serve as a starting point for discussion about meaningful and practical immigration reform in the United States. | |||||||||||||||||||||||||||||||||||||||||||||||||||||||||||||||||||||||||||||||||||||||||||||||||||||||||||||||||||||||||||||||||||||||||||||||||||||||||||||||||||||||||||||||||||||||||||||||||||||||||||||||||||||||||||||||||||||||||||||||||||||||||||||||||||||||||||||||||||||||||||||||||||||||||||||||||||||||||||||||||||||||||||||||||||||||||||||||||||||||||||||||||||||||||||||||||||||||||||||||||||||||||||||||||||||||||||||||||||||||||||||||||||||||||||||||||||||||||||||||||||||||||||||||||||||||||||||||||||||||||||||||||||||||||||||||||||||||||||||||||||||||||||||||||||||||||||||||||||||||||||||||||||||||||||||||||||||||||||||||||||||||||||||||||||||||||||||||||||||||||||||||||||||||||||||||||||||||||||||||||||||||||||||||||||||||||||||||||||||||||||||||||||||||||||||||||||||||||||||||||||||||||||||||||||||||||||||||||||||||||||||||||||||||||||||||||||||||||||||||||||||||||||||||||||||||||||||||||||||||||||||||||||||||||||||||||||||||||||||||||||||||||||||||||||||||||||||||||||||||
|
Introduction With recent debate over immigration reform and budgetary issues affecting government and industry alike, we must be fully aware of the actions necessary to achieve immigration reform. There are several industries that are directly impacted by the immigration policies set forth by our government, and perhaps the largest industry affected is agriculture. The U.S. Citizenship and Immigration Services provides a temporary worker classification, H-2A, to foreign-born agricultural workers to meet the harvesting needs that aren't met by US Citizens. The H-2A program provides a legal channel for farm owners to apply for temporary work permits for foreign-born workers through the H-2A program. Undocumented workers make up a large proportion of the U.S. agriculture industry’s labor force. By design, the H-2A program is intended to meet the labor demands of the agriculture industry, but falls short as evidenced by the large number of undocumented workers in the U.S. agriculture labor force. In this analysis I hope to illustrate the discrepancy between the number of foreign-born workers permitted under the H-2A program, and undocumented agriculture workers working in the industry. | |||||||||||||||||||||||||||||||||||||||||||||||||||||||||||||||||||||||||||||||||||||||||||||||||||||||||||||||||||||||||||||||||||||||||||||||||||||||||||||||||||||||||||||||||||||||||||||||||||||||||||||||||||||||||||||||||||||||||||||||||||||||||||||||||||||||||||||||||||||||||||||||||||||||||||||||||||||||||||||||||||||||||||||||||||||||||||||||||||||||||||||||||||||||||||||||||||||||||||||||||||||||||||||||||||||||||||||||||||||||||||||||||||||||||||||||||||||||||||||||||||||||||||||||||||||||||||||||||||||||||||||||||||||||||||||||||||||||||||||||||||||||||||||||||||||||||||||||||||||||||||||||||||||||||||||||||||||||||||||||||||||||||||||||||||||||||||||||||||||||||||||||||||||||||||||||||||||||||||||||||||||||||||||||||||||||||||||||||||||||||||||||||||||||||||||||||||||||||||||||||||||||||||||||||||||||||||||||||||||||||||||||||||||||||||||||||||||||||||||||||||||||||||||||||||||||||||||||||||||||||||||||||||||||||||||||||||||||||||||||||||||||||||||||||||||||||||||||||||||||
|
Background Current estimates by the US Department of Labor put our 2007 number of crop workers at 1.4 million, and suggest that 2/3 are undocumented. Using data from the US Citizenship and Immigration Services, the Department of Labor, and data from the National Agriculture Workers Survey (NAWS), I will illustrate how the current H-2A program falls short of providing sufficient workers to meet demand for temporary workers in the agriculture industry for the years 2006-2009. (Bureau of Labor Statistics, 2006-2009) (Foreign Labor Certification Data Center, 2006-2009) (The National Agriculture Workers Survey, 1989-2009)
The UC Giannini Foundation of Agricultural Economics provided an excellent analysis of the California Agriculture Industry in ‘Labor Trajectories in California’s Produce Industry’.(Martin and Calvin, 2011) Figures and methodologies for statistical immigration information in the United States, were obtained from the Urban Institute. (Passel, Capps, and Fix, 2004) Estimates of Unauthorized Immigrants can be found in ‘A Portrait of Unauthorized Immigrants in the United States’ by the PEW Hispanic Center. (Passel & Cohn, 2009) For a clear understanding of the H-2A immigration program, and the challenges of being a foreign-born agricultural worker, ‘Ending the Silence: Thai H-2A Workers, Recruitment Fees, and the Fair Labor Standards Act’ was an excellent source. (Schmitt, 2007) A brief history of the California agriculture industry was provided by the ‘California Hired Farm Labor 1960-2010’. (Martin, 2011)
| Methods The National Agriculture Workers Survey (NAWS) conducts an annual survey of farm employees across the United States. This survey is done on a Regional rather then State basis, and allows employees to safely disclose their citizenship status. This survey allows for the calculation of a ratio of ‘UNAUTHORIZED’ to ‘CITIZEN’, ‘GREEN CARD’, ‘OTHER WORK AUTHORIZED’ workers to be obtained on a Regional level. For the purposes of this analysis, that ratio was applied to each State within it’s Region to determine the estimated number of undocumented agricultural workers. This percentage of undocumented workers was then applied to Department of Labor estimates of the total number of workers in the agricultural industry, by State, to determine the number of undocumented workers in each State. The Department of Labor publishes annual reports that estimate U.S. work force by classification. Each classification was evaluated to determine whether or not it was agricultural in nature. The total number of agricultural workers per state was obtained from this data. The following are agricultural classifications used to estimate a by state agriculture labor force: "Agricultural workers, all other", "Farming, fishing, and forestry occupations", "Farmworkers and laborers, crop, nursery, and greenhouse", "Farmworkers, farm and ranch animals", “Agricultural equipment operators”, “Animal breeders”, “Animal trainers”, “Farm equipment mechanics”, “Fishers and related fishing workers” The H-2A program provides data on the number of documented guest workers allowed into each State annually. Using that data, estimated numbers of undocumented agricultural workers (by State) were calculated, and compared to number of H-2A workers admitted, as illustrated in the maps and data sets below. Results are organized by State, and by year.
| Results
Undocumented : Documented Guest Agricultural Labor
U.S. Agriculture Data
| 2006
| 2007
| 2008
| 2009
|
| Figures and Maps
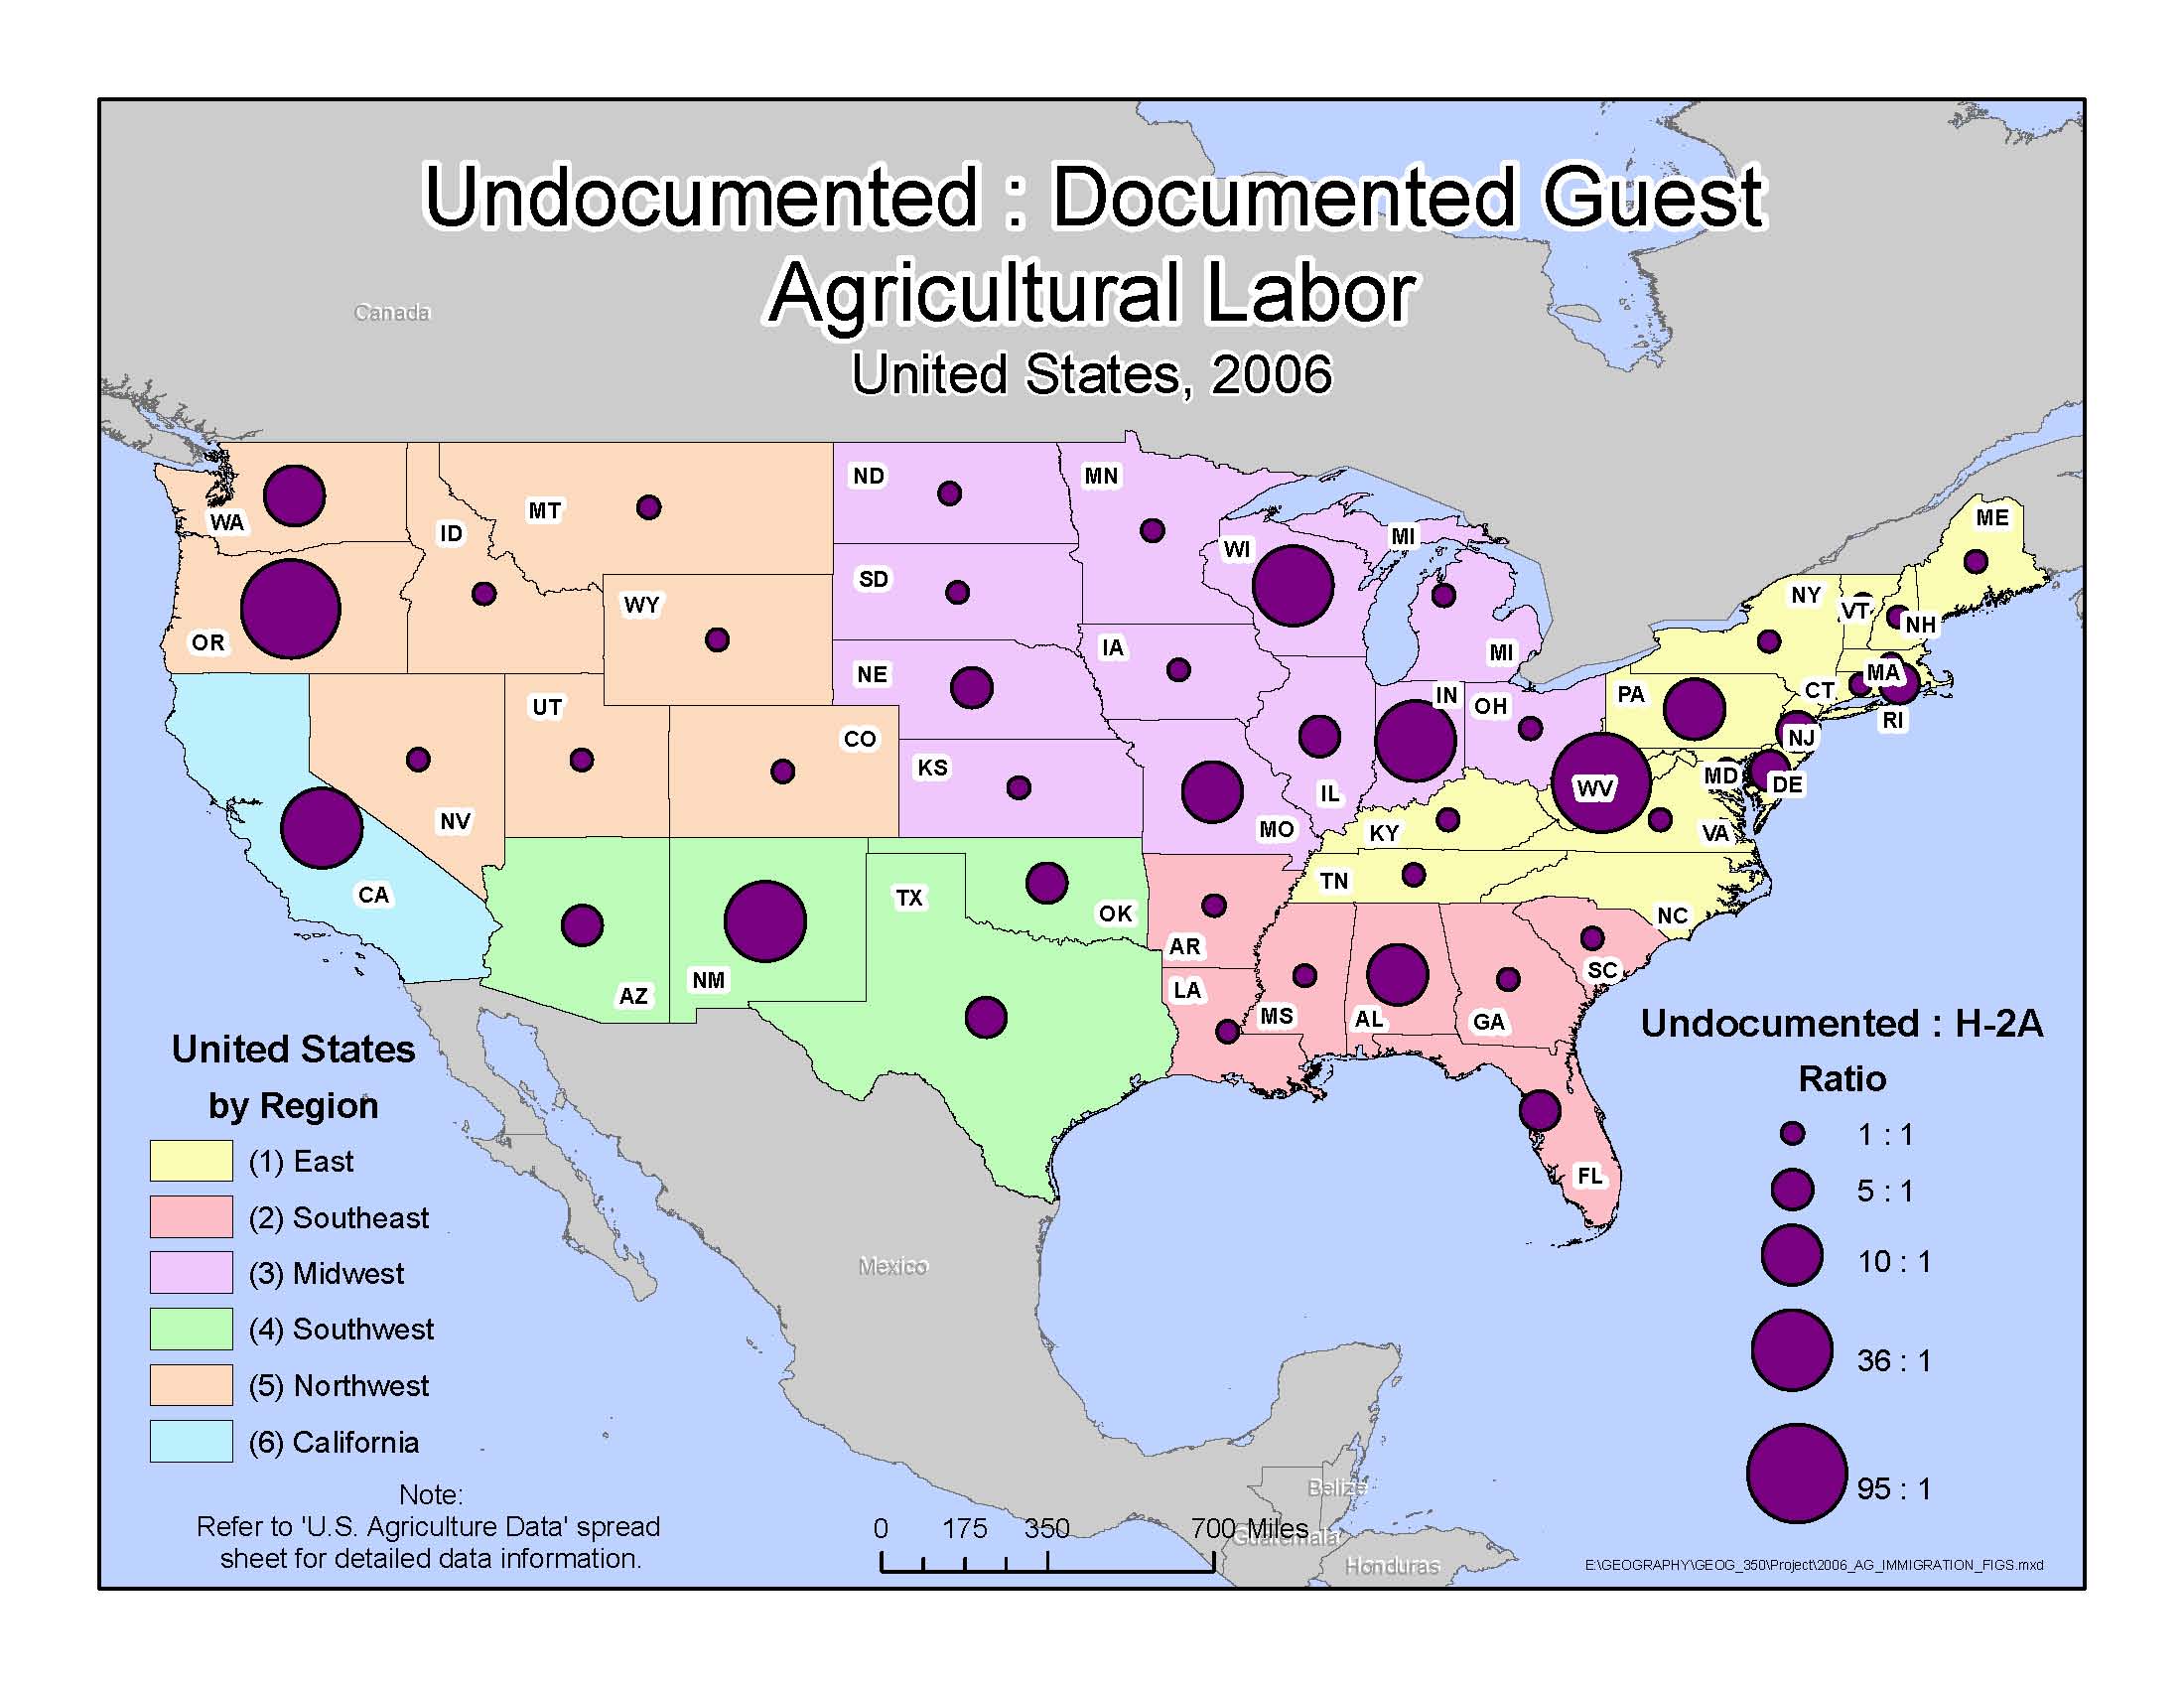
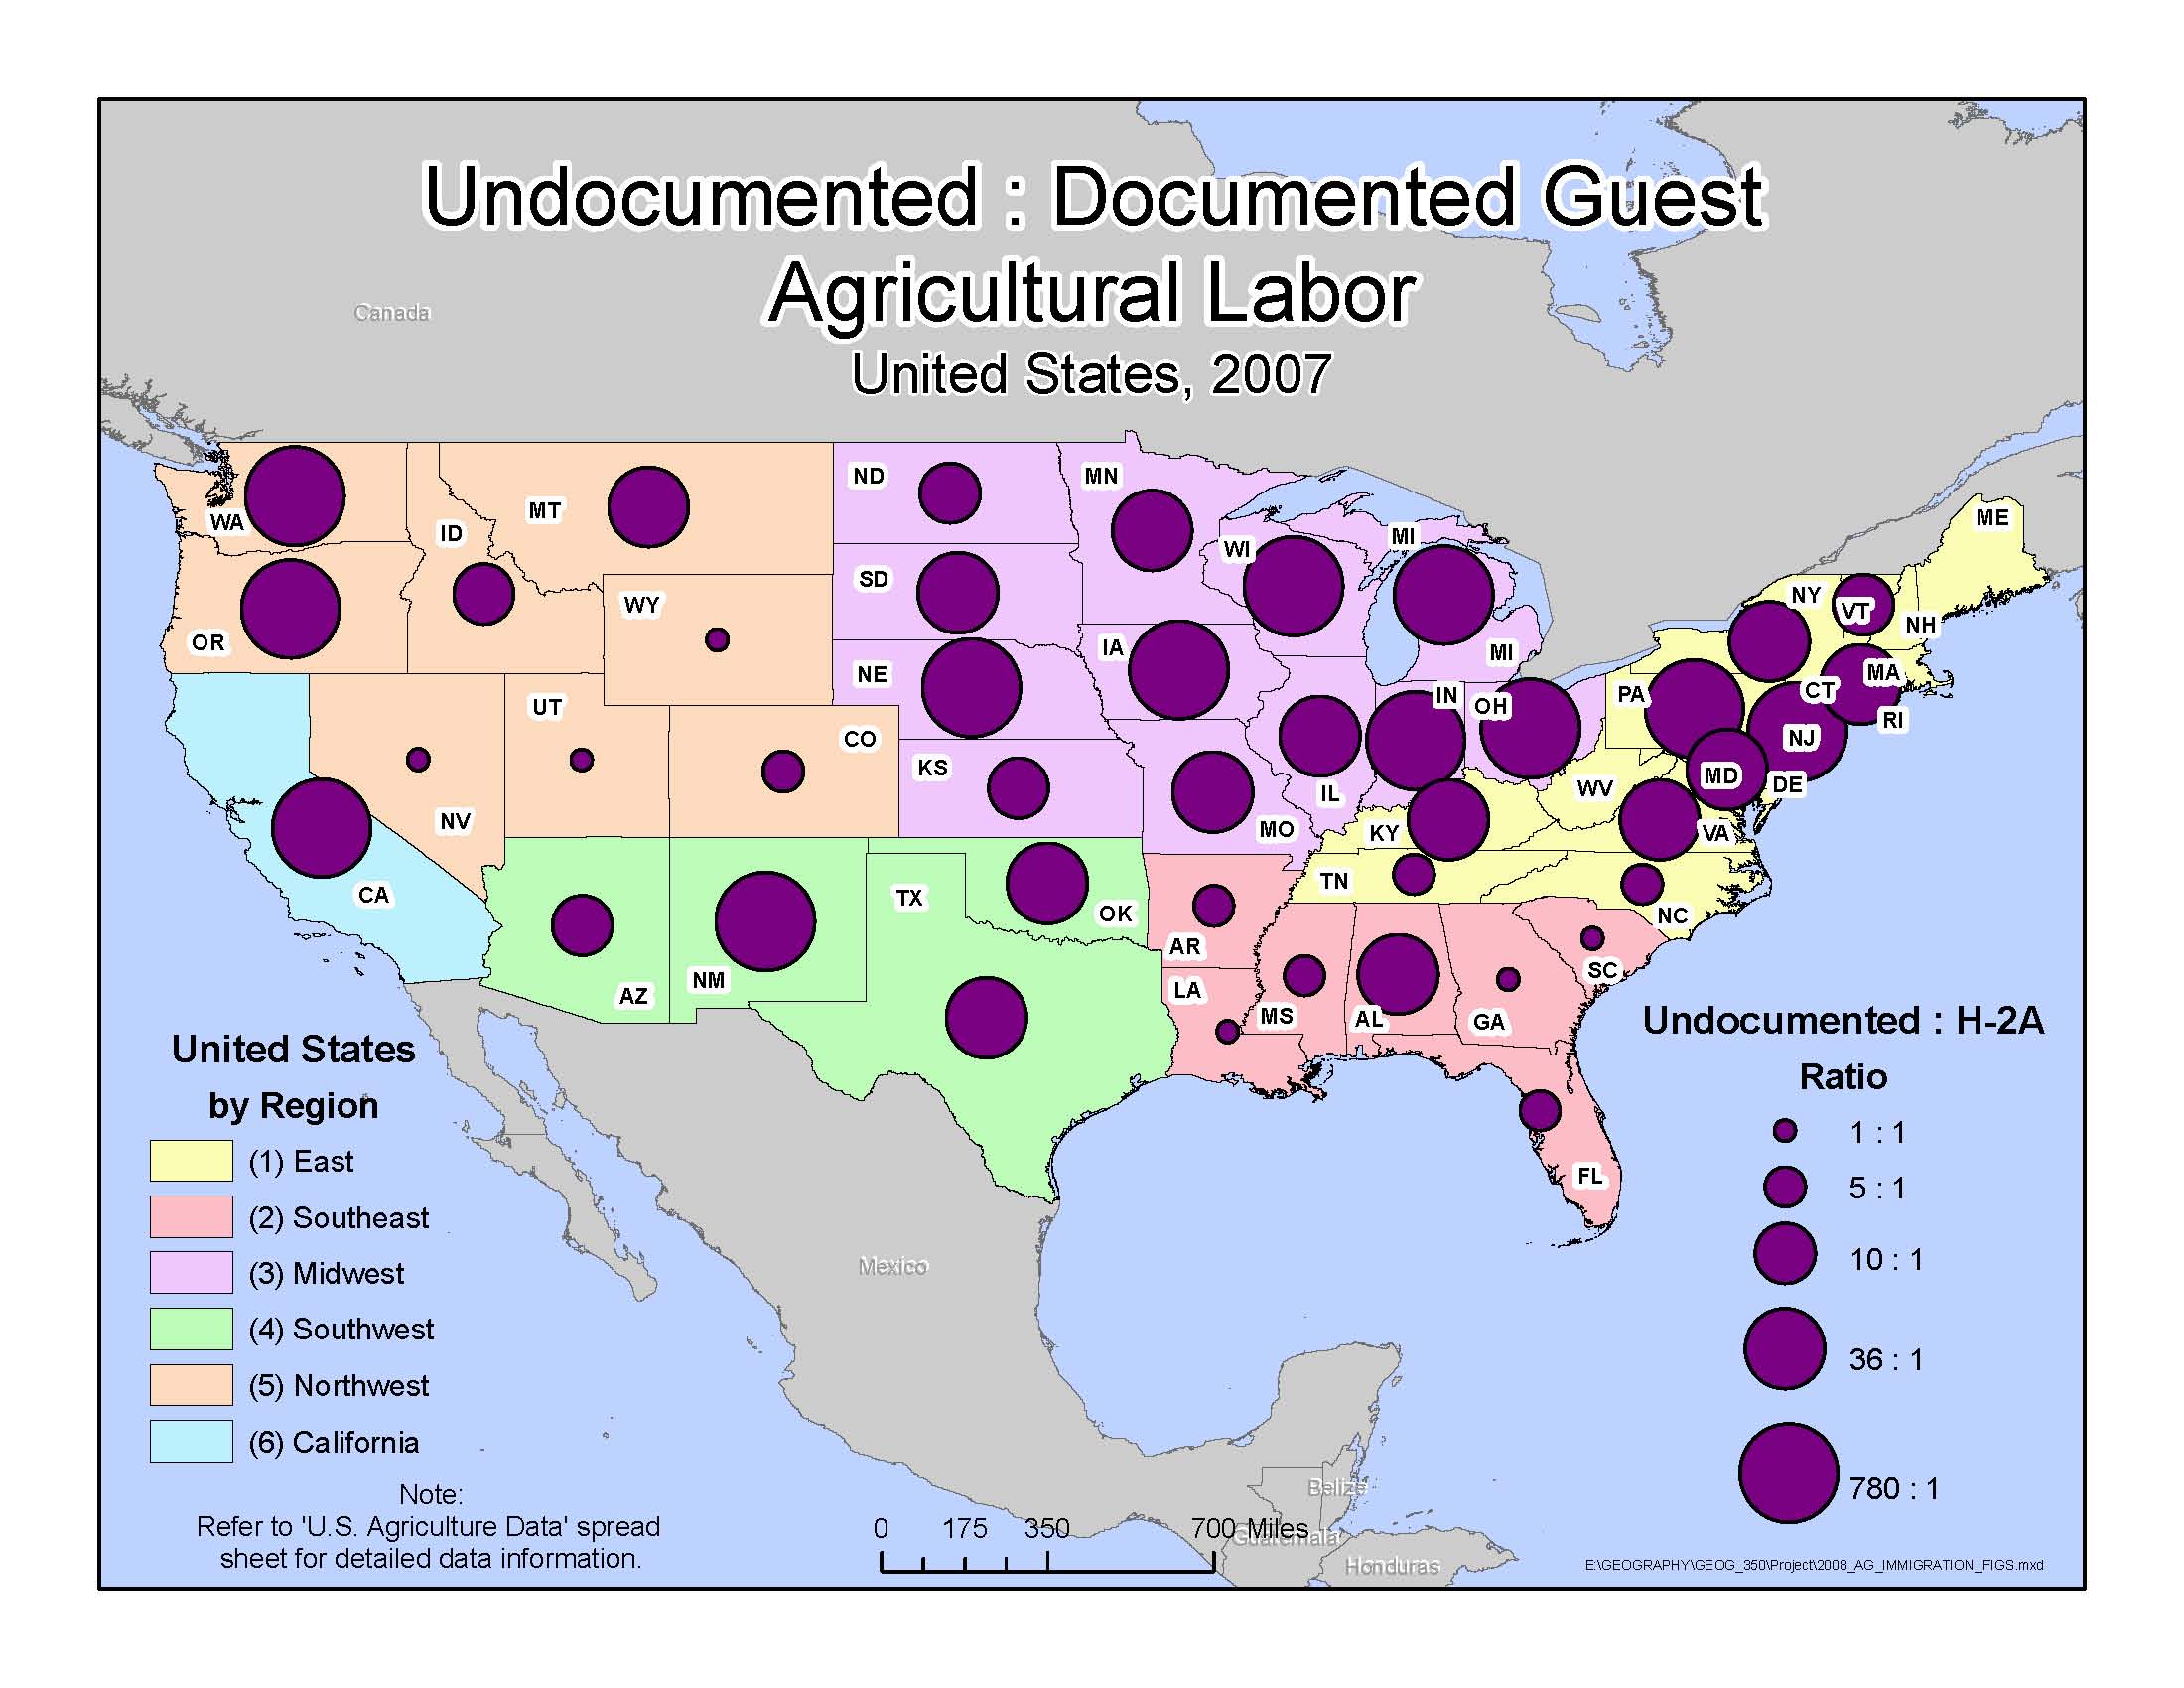
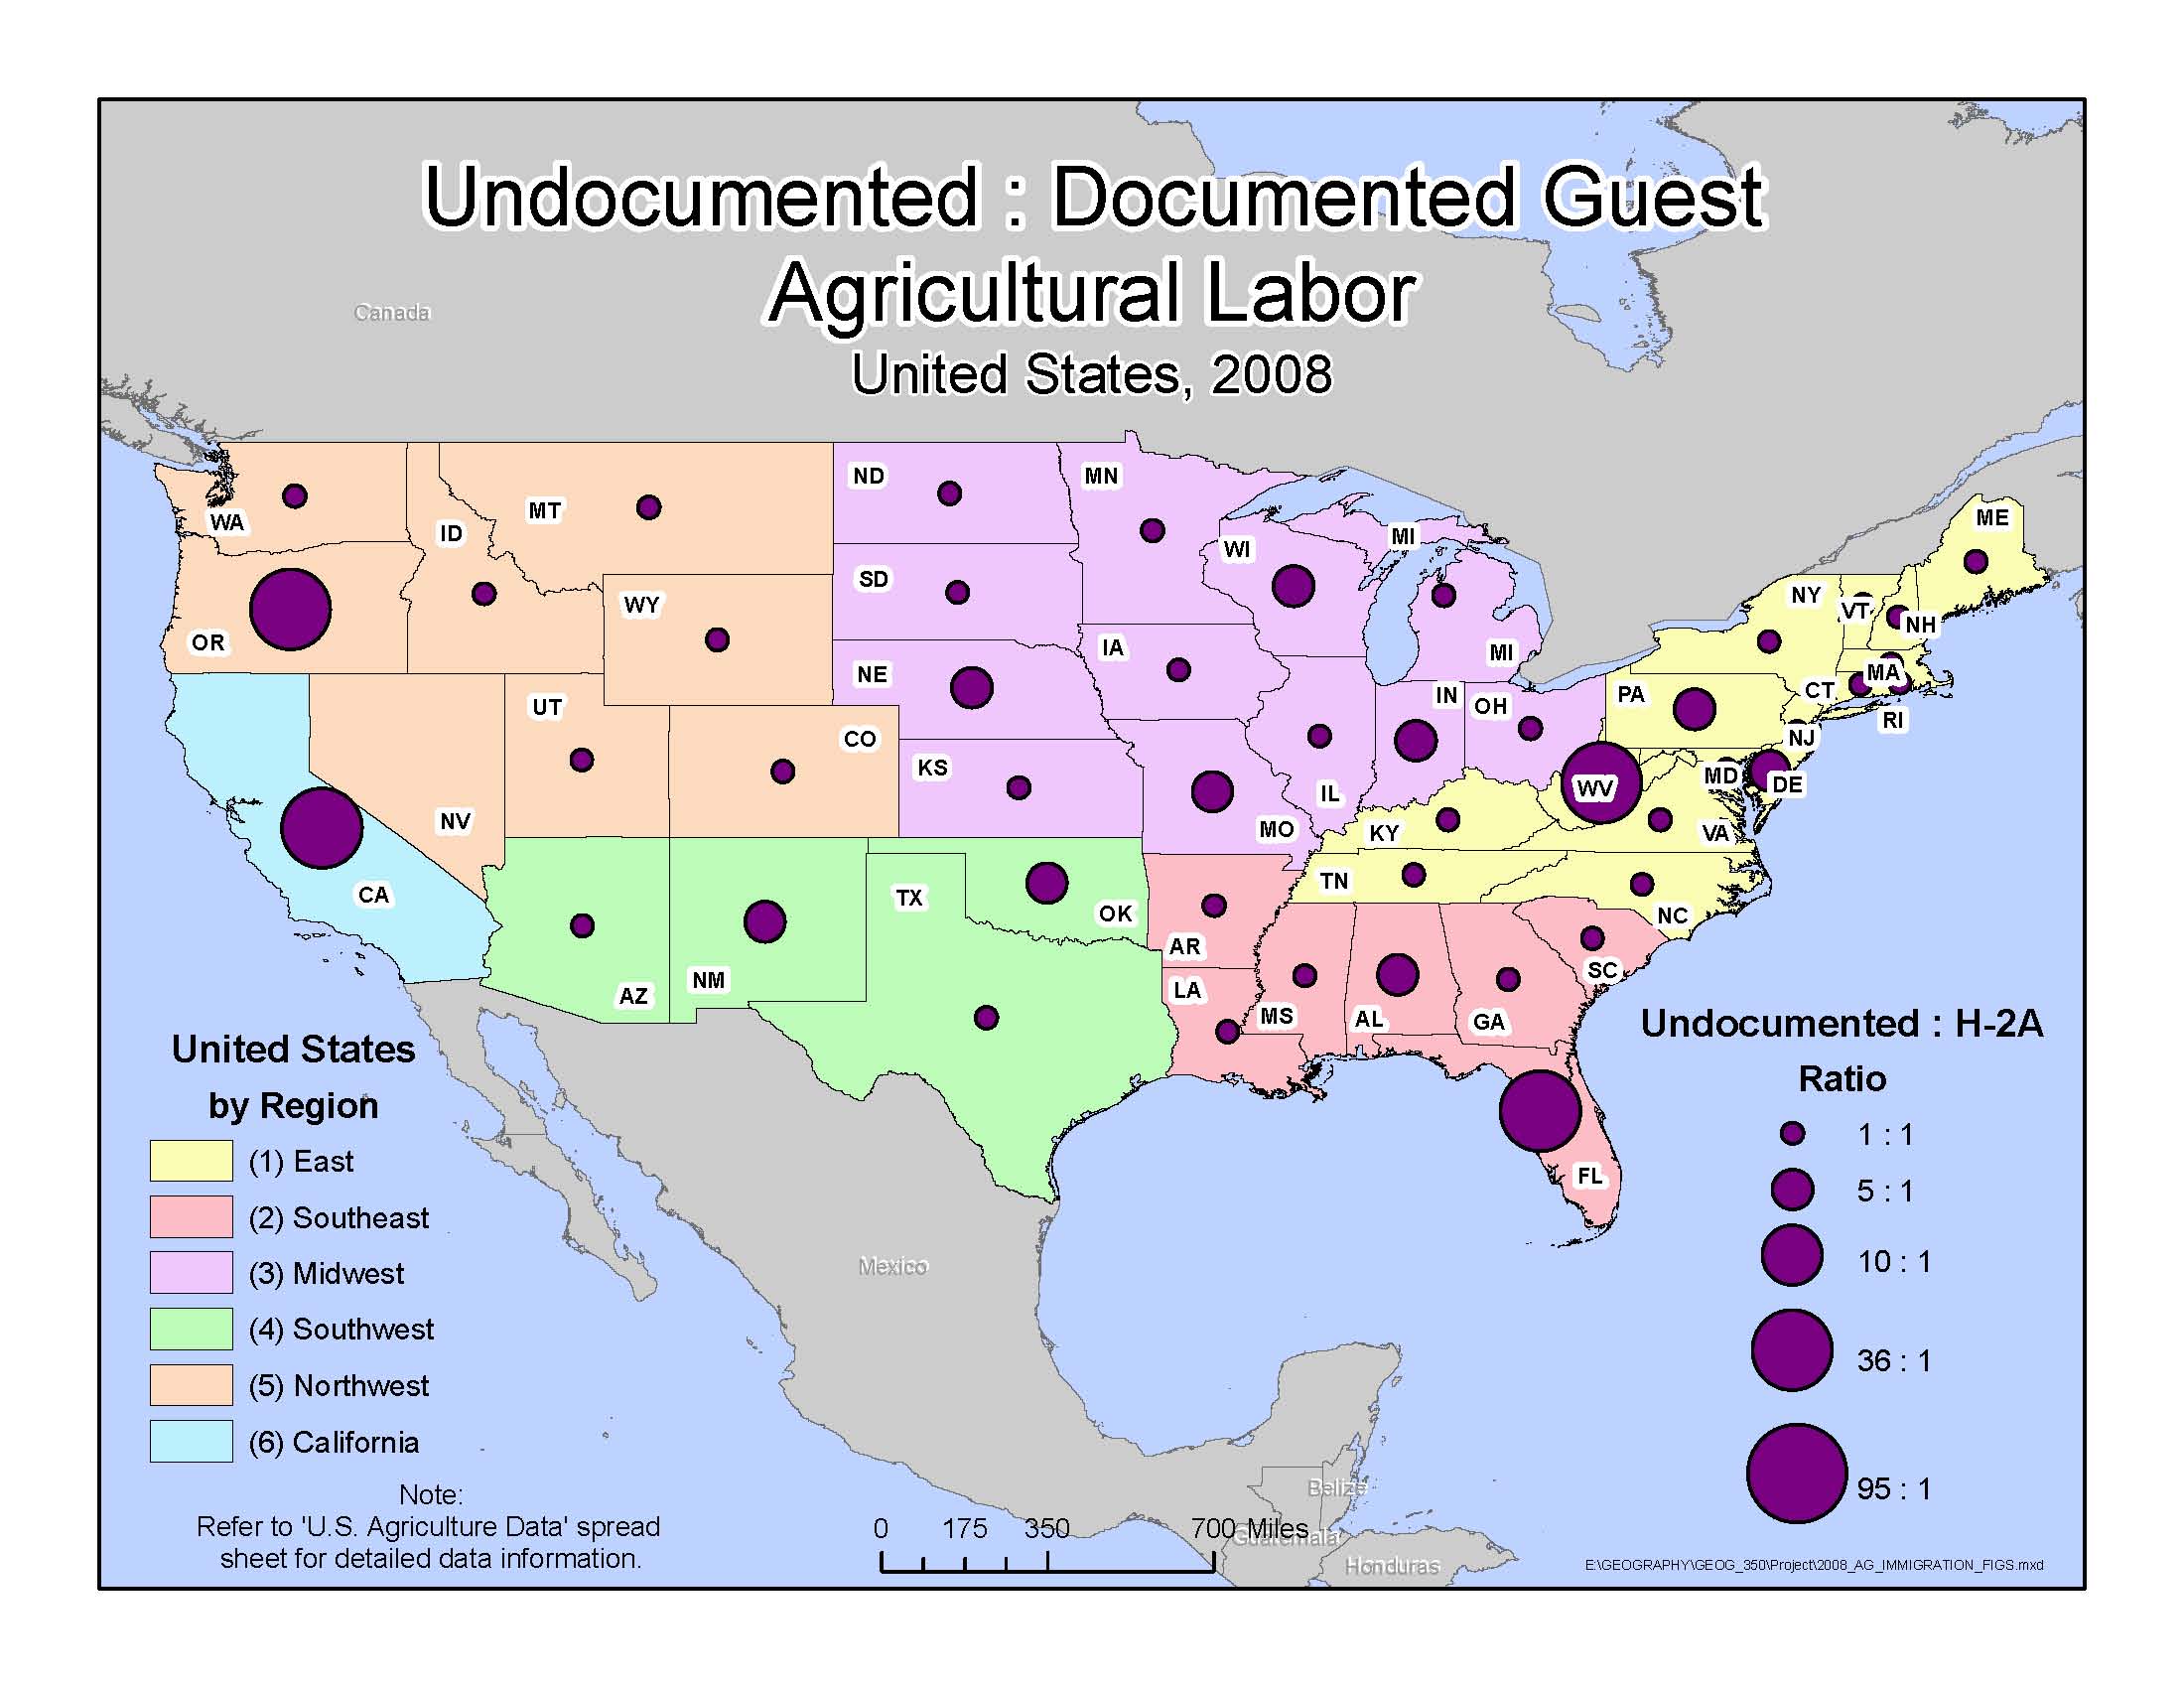
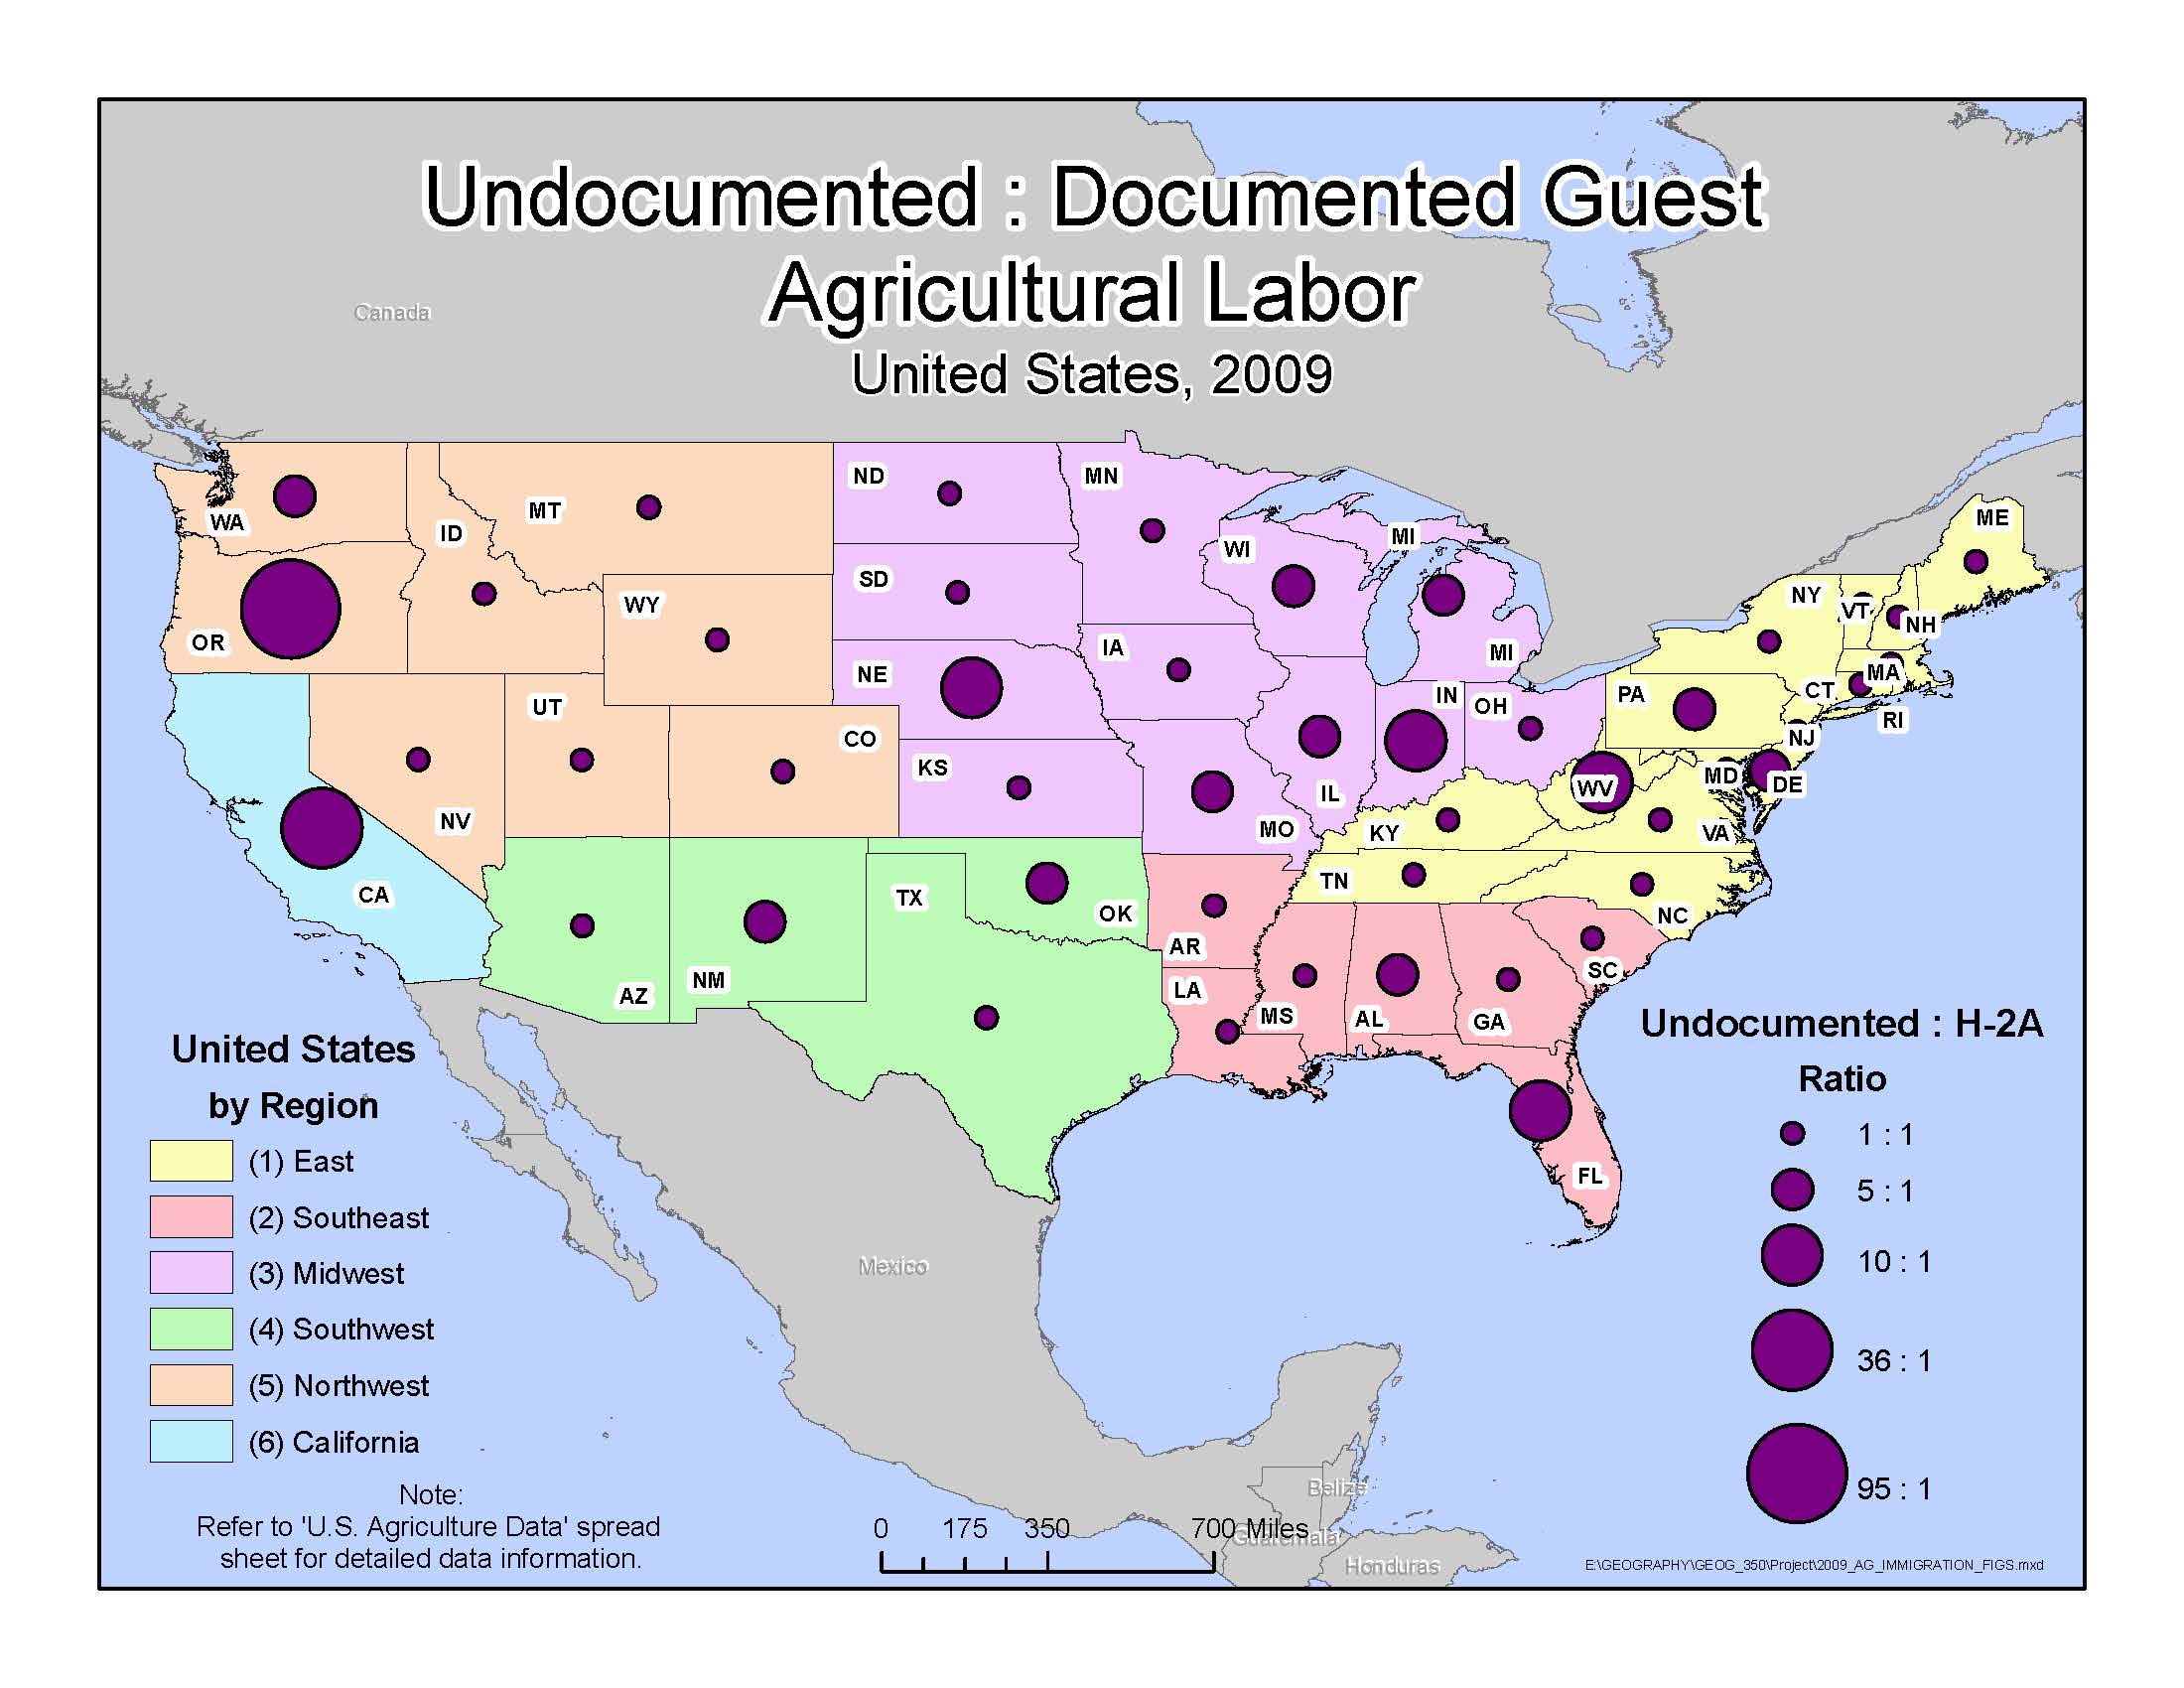
| Analysis Each year more than a million undocumented workers participate in the agriculture industry. In some States, the number of undocumented workers is equal to the number of documented H-2A workers, and in many others undocumented workers far outnumber documented H-2A workers. In 2006, Oregon and West Virginia had the highest number of undocumented to documented H-2A workers with a ratio of 95:1. California, New Mexico, Wisconsin, and Indiana also had a high number of undocumented to documented H-2A workers with a ratio of 36:1. The remainder of the States had 10:1 or fewer undocumented to documented H-2A workers. In 2007, many more States had very high ratios of undocumented to documented H-2A workers; this was the case for all Regions. California, Washington, Oregon, New Mexico, Nebraska, Iowa, Wisconsin, Michigan, Indiana, Ohio, Pennsylvania, and New Jersey all had undocumented to documented H-2A ratios of 780:1. Texas, Oklahoma, Alabama, Virginia, Kentucky, Missouri, Illinois, Maryland, South Dakota, Montana, and Rhode Island had undocumented to documented H-2A workers was 36:1. It is unclear if fewer permits were applied for, the needs of the industry were much higher than average, respondents from the NAWS survey were more forthcoming in their responses, or if fewer H-2A permits were granted. This is a huge increase in the proportion of undocumented workers in the agriculture work force from 2006. In 2008, Oregon and California had undocumented to documented H-2A worker ratio of 95:1. West Virginia and Florida had undocumented to documented H-2A worker ratios of 36:1. The remainder of the States had undocumented to documented H-2A worker ratios of 10:1 or fewer. In 2009, only Oregon had an undocumented to documented H-2A worker ratio of 95:1. California had an undocumented to documented H-2A worker ratio of 36:1. The remainder of the States had undocumented to documented H-2A worker ratios of 10:1 or fewer. The maps and data tables above give a rough estimate of the scope of the problem of undocumented workers in the U.S agricultural industry. Obtaining precise data about the number of undocumented workers in the agriculture industry is impossible because there is no way to quantify the exact number of undocumented workers. NAWS data provides the closest estimate of the number of undocumented agriculture workers available. These data were extrapolated and applied to each State in the Region of the NAWS study. The calculation of the estimated number of undocumented workers was then straightforward. What is obvious after analyzing the data, is that there are a huge number of undocumented workers in the US agriculture labor force, and the number of work permits granted by the H-2A program falls short of the needs of the agricultural industry necessitating the employment of undocumented workers when documented workers cannot provide sufficient labor.
| Conclusions Based on the number of undocumented workers compared to the number of H-2A guest workers admitted into the agriculture work force each year, it appears that the number of temporary work permits granted falls woefully short of what is needed to meet the demands of the agriculture industry. One possible place to begin to address the problem of undocumented workers is through reform of the H-2A guest worker program. By allowing a sufficient number of guest workers into the country, and applying more strict rules about verifying documentation of workers, the problem of undocumented workers can begin to be addressed. More accurate estimates of the actual work force needs of the agricultural industry are necessary to better project the number of guest worker permits that should be granted each year. Only by having a system that realistically meets the demands of the agriculture industry, can we begin to address the problem of undocumented workers in the agricultural work force.
| References Martin, Philip. "California Hired Farm Labor 1960-2010: Change and Continuity" Farmworkers Forum. Craig C. Smith. 30 Apr. 2011. University of California-Davis. 1 Nov 2011 <http://farmworkersforum.wordpress.com/2011/05/04/california-hired-farm-labor-1960-2010-change-and-continuity/>. Schmitt L., Andrea. “Ending the Silence: Thai H-2A Workers, Recruitment Fees, and the Fair Labor Standards Act” Pacific Rim Law & Policy Journal Volume 16 No. 1(2011). Retrieved from http://digital.law.washington.edu/dspace-law/bitstream/handle/1773.1/606/16PacRimLPolyJ167.pdf?sequence=1 Passel S., Jeffrey. “A Portrait of Unauthorized Immigrants in the United States” PEW Hispanic Center. Cohn, D’Vera. 14 Apr 2009. PEW Research Center Publications. 1 Nov 2011 <http://pewresearch.org/pubs/1190/portrait-unauthorized-immigrants-states> Passel S., Jeffrey, Capps, Randolph, & Fix E., Micheal. “Undocumented Immigrants: Facts and Figures” Health Policy Center Casey E., Annie. 12 Jan 2004. Urban Institute 1 Nov 2011 <http://www.urban.org/health_policy/url.cfm?ID=1000587> Martin, Philip & Calvin, Linda. “Labor Trajectories in California’s Produce Industry” Giannini Foundation of Agricultural Economics - University of California-Davis Volume 14 No. 4 (2011) Retrieved from <http://giannini.ucop.edu/media/are- | ||||||||||||||||||||||||||||||||||||||||||||||||||||||||||||||||||||||||||||||||||||||||||||||||||||||||||||||||||||||||||||||||||||||||||||||||||||||||||||||||||||||||||||||||||||||||||||||||||||||||||||||||||||||||||||||||||||||||||||||||||||||||||||||||||||||||||||||||||||||||||||||||||||||||||||||||||||||||||||||||||||||||||||||||||||||||||||||||||||||||||||||||||||||||||||||||||||||||||||||||||||||||||||||||||||||||||||||||||||||||||||||||||||||||||||||||||||||||||||||||||||||||||||||||||||||||||||||||||||||||||||||||||||||||||||||||||||||||||||||||||||||||||||||||||||||||||||||||||||||||||||||||||||||||||||||||||||||||||||||||||||||||||||||||||||||||||||||||||||||||||||||||||||||||||||||||||||||||||||||||||||||||||||||||||||||||||||||||||||||||||||||||||||||||||||||||||||||||||||||||||||||||||||||||||||||||||||||||||||||||||||||||||||||||||||||||||||||||||||||||||||||||||||||||||||||||||||||||||||||||||||||||||||||||||||||||||||||||||||||||||||||||||||||||||||||||||||