| Modeling Runoff and Sediment Yield Post Fire Conditions with GeoWEPP | |||||||||||||||||||||||||||||||||||||||||||||||||||||||||||||||||||||||||||||||||||||
|
Author Shannon Holt American River College, Geography 350: Data Acquisition in GIS; Fall 2011 shannon@shannonholt.com | |||||||||||||||||||||||||||||||||||||||||||||||||||||||||||||||||||||||||||||||||||||
|
Abstract Excess sediment transport and deposition from runoff can be harmful to stream and ecosystem health (Crumbley 196-199). Government agencies and land managers have developed models to predict the amount of runoff that will occur to quantify the sediment yield. Excess runoff and sedimentation can be cause by several things including, land development, anthropogenic activity and fire. Fire can have an effect on several of the hydrologic process in a watershed and in result alter the peak runoff rates. The parameters needed to run the GeoWEPP models are discussed and shown using San Diego County as an example. San Diego has a Chaparral community and low precipitation levels. After reviewing the DEMs (Digital Elevation Models), land cover, climate and large fires in the area we can suggest that even if a large fire takes out most of the vegetation and causes hydrophobic soils the runoff rates and erosion will be low due to a more gentle elevation and low precipitation levels. | |||||||||||||||||||||||||||||||||||||||||||||||||||||||||||||||||||||||||||||||||||||
|
Introduction Excessive sedimentation in forest streams and other waters can be harmful to water quality and ecosystems (Crumbley et al.) Government agencies and land managers use models to forecast changes on the landscape due to human activity, climate change and fire. A model is a simplified system of the natural system and used to measure processes and parameters that are not easily measured or are costly to obtain all the desired data. A model that is able to predict runoff, erosion, sediment transport and deposition from different severity fires would allow better water and land management. I am going to look at landscapes in southern California, specifically San Diego County that has experienced severe fires. The main vegetation and climate type in southern California is chaparral. Chaparral is a shrub dominated vegetated area with shrub heights between 1 to 4 meters tall (Beyers, and Wakeman). Some vegetation species require fire to germinate; therefore, fire is an important component in some ecosystems. In the chaparal community the fire return interval is 20 to 70 years for fire to be beneficial for these vegetation species ( Beyers, and Wakenman). When fire is more frequent or too catastrophic, so that it wipes out entire plants, negative side effects are imposed on the area. One side effect of catastrophic fires is an increase in runoff and erosion. The extent to this increase is determined by the area and the different components in the area. As a means of land management being about to quantify the amount of erosion and runoff is import. The GeoWEPP model can predict the amount of runoff and sediment transport post fire conditions with the input of several components in the area. As a means of land management, being about to quantify the amount of erosion and runoff is import. The GeoWEPP model can predict the amount of runoff and sediment transport post fire conditions with the input data of several components in the area. | |||||||||||||||||||||||||||||||||||||||||||||||||||||||||||||||||||||||||||||||||||||
|
Background GeoWEPP is an extension to WEPP (Water Erosion Prediction Project). It is used to not only predict peak flow but also sedimentation amounts. This will allow better assessment of the area as it relates to the water quality of the stream or other bodies of water. This model looks at post burned areas in three categories low, moderate and high intensity fires. The key variables in predicting soil erosion are storm intensity, fire intensity, soil type and topography (Crumbley 196-199). GeoWEPP is used in a geographical information system therefore it is spatially referenced and can look at multiple layers within the parameters at a time. DEM (Digital Elevation Models), climate data, soil information, land use and land cover information are inputted in the model. The main output of this model is total sediment yield from the entire hillslope. By looking at fire return periods and time to achieve pre-fire conditions is a way to evaluate fire intensity on the landscape (Crumbley 196-199). The San Diego area has had 5 catastrophic fires from 1956 to 2007, the total damages of these fires are listed in table 1 (“Worst U.S. Forest Fires”). Other fires have gone through this area but none like these with such destruction. By using the GeoWEPP model predictions can be made about the amount of increased runoff and erosion that will occur after fire events. Another factor to configure when looking at runoff rates is the amount of precipitation in the area. San Diego’s climate has very little precipitation throughout the year which might also lead to low levels of runoff and erosion after a fire. Lower precipitation can also lead to a drier area in which fires are more easily started. The climate data for San Diego area can be found in table 2 (“San Diego Climate”). | |||||||||||||||||||||||||||||||||||||||||||||||||||||||||||||||||||||||||||||||||||||
| |||||||||||||||||||||||||||||||||||||||||||||||||||||||||||||||||||||||||||||||||||||
| |||||||||||||||||||||||||||||||||||||||||||||||||||||||||||||||||||||||||||||||||||||
|
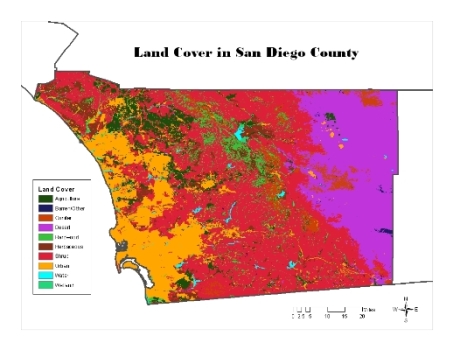
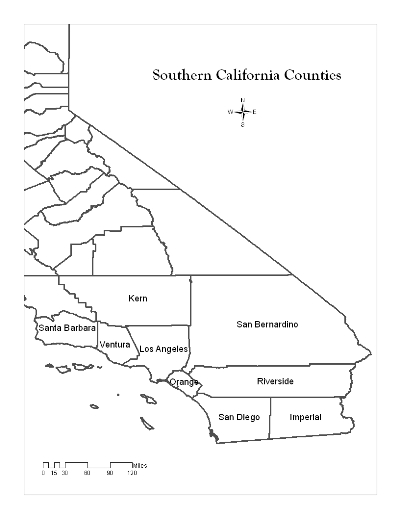
Methods My methods are looking into the way the GeoWEPP model worked and gathering the input parameter data needed to run the model. The input data is DEM, climate data, soil information, and land use and land cover information. The DEMs were found by doing a general search for Digital Elevation Models in California on the internet. The only free data information came from someone’s personal home page that displayed elevation data. DEMs for the southern California regions were downloaded and mosaic together, using the spatial analyst tools, to view elevations within the area. These elevation models were not downloaded from a trusted website and show visible errors in the output, however they give a general sense of the input parameter needed. The DEM for San Diego County region is shown in figure 1 (“California DEM”). The land cover data was downloaded from Cal-Atlas, a California government agency site. Soils data could not be found but the type of land cover in the area could give some indication as to what types of soils are in the area (“Cal-Atlas Geospatial Clearinghouse”). This information is displayed in figure 2. California Department of Forestry and Fire Protection (FRAP) is a California Government website and has free GIS data listed on it. I downloaded a GIS data file that displays areas in San Diego County where the high risk for fire is. This information is shown in figure 3 (“GIS Downloads”). Lastly, additional data was downloaded from Cal-Atlas. The outline of the county boundaries in the state of California was downloaded to give reference of the study site (“Cal-Atlas Geospatial Clearinghouse”). The actual GeoWEPP model was not run because it requires the WEPP model and is not a tool that is available to me at this time. | |||||||||||||||||||||||||||||||||||||||||||||||||||||||||||||||||||||||||||||||||||||
|
Figure 1 || Figure 2 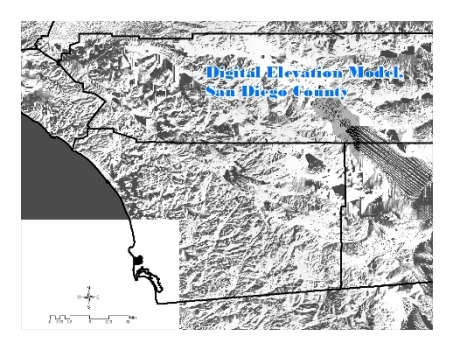
| |||||||||||||||||||||||||||||||||||||||||||||||||||||||||||||||||||||||||||||||||||||
|
Figure 3 || Figure 4 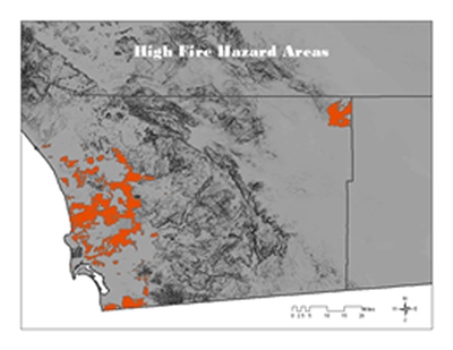
| |||||||||||||||||||||||||||||||||||||||||||||||||||||||||||||||||||||||||||||||||||||
|
Results A study conducted by Crumbley et al. concluded that during low prescribe burns sediment yield and runoff rates were too low to pose a concern. During high intensity wildfires sediment yield following the fire posed a large threat to stream and water body health and downstream sedimentation. Southern California has experienced catastrophic fires that would have wiped clean and of the vegetation and ground litter. The large fires would have produced a lot of heat for a long duration of time which could then have resulted in hydrophobic soils. Although southern California does now have many steep slopes and the average precipitation in the area is low, which could mean that even though there are large fires there might not be as much runoff due to the other conditions. . | |||||||||||||||||||||||||||||||||||||||||||||||||||||||||||||||||||||||||||||||||||||
|
Analysis The overall purpose of this project was to compline all the things I learned in this class and past classes to devise a project that could incorporate GIS data. In this aspect, my research was a success. Although I could not run the GeoWEPP model and view the results myself, I learned the different parameters inputted into the model and how to obtain the necessary data. Finding free GIS data is sometimes a challenge especially when you are looking for specific data. I was able to research online the data needed to input into the model and display it. Some of the data sources were not as good of data as I would have liked but it gives an overall representation of the actual data needed to run the model. | |||||||||||||||||||||||||||||||||||||||||||||||||||||||||||||||||||||||||||||||||||||
|
Conclusions GeoWepp is a GIS interface model that is an extension to the WEPP model. GeoWEPP is a model used to model runoff and erosion and geo-reference these results based on the GIS component of the model. This model can also look at runoff rates and erosion rates post fire conditions. This is a useful tool for government agencies and land managers to predict the conditions after a fire. When researching the input data I chose a site location of San Diego County. San Diego has had some large fires in the past and those fires could have possibly disrupted the water quality as well as ecosystem health. Viewing the input data for the GeoWEPP model will give insight as to where the most runoff and erosion will occur and help with management and mitigation practices. . | |||||||||||||||||||||||||||||||||||||||||||||||||||||||||||||||||||||||||||||||||||||
|
References
Beyers, Jan L., and Carla D. Wakeman. "Season of Burn Effects in Southern California Chaparral." USDA Forest Service. Pacific Southwest Research Station, USDA Forest Serivce, 1997. Web. 13 Dec 2011.http://www.fs.fed.us/psw/publications/4403/SeasonOfBurn California Government. Cal-Atlas Geospatial Clearinghouse.Cal-Atlas Geospatial Clearinghouse. 2010. Web. http://www.atlas.ca.gov/download.html. "California DEM (Digital Elevation Models) 1 Degree- 30 Meters."California DEM (Digital Elevation Models) 1 Degree- 30 Meters. N.p., 2006. Web. 13 Dec 2011.http://www.brenorbrophy.com/California-DEM.htm. Crumbley, Tyler et al. "Modeling Soil Erosion and Sediment Transport from Fires in Forested Watersheds of the South Carolina piedmont." 196-199. Print. California Government. California Department of Forestry and Fire Protection. GIS Dowloads. 2007. Web. http://frap.fire.ca.gov/data/frapgisdata/select.asp. "infoplease." Worst U.S. Forest Fires. Pearson Education , 2007. Web. 13 Dec 2011.http://www.infoplease.com/ipa/A0778688.html. "San Diego." San Diego Climate. N.p., n.d. Web. 13 Dec 2011. http://www.san- diego.us/san-diego-climate.html. . | |||||||||||||||||||||||||||||||||||||||||||||||||||||||||||||||||||||||||||||||||||||
|
links California Chaparral || GIS Data || DEM || Fire Risk Data || Worst Forest Fires || Climate Data | |||||||||||||||||||||||||||||||||||||||||||||||||||||||||||||||||||||||||||||||||||||