| Title The Spatial Distritbution of Birds in Costa Rica | |||||||||||||||||||||||||||||||||||||||||
|
Author Lacy Smith American River College, Geography 350: Data Acquisition in GIS; Fall 2011 | |||||||||||||||||||||||||||||||||||||||||
|
Abstract I used a Geographic Information System to compare the spatial location of birds with habitat type, human population density, and distance to roads within the country of Costa Rica. Some high bird densities occurred in regions with both high and low human population densities. All bird orders were found in almost all habitat types. | |||||||||||||||||||||||||||||||||||||||||
|
Introduction and Background Spatial data can inform conservation planning for the protection of wildlife species. Many species are limited in geographical extent and their former ranges are shrinking as a result of human encroachment. In order to protect populations from extinction it is important to understand the habitat components that exist within their range and may be required for their survival. By understanding the environmental characteristics of a habitat we can determine which areas may provide suitable habitat and be worth protecting. Spatial data has been used for landscape level conservation planning and understanding the spatial distributions of species such as jaguar (Sanderson et al., 2002), amphibians (Ray et al., 2002), beetles (Copris species; Chefaoui et al., 2005), and plants (Ferrier et al., 2002). Furthermore, the use of radio and satellite telemetry data of animal locations within a geographic information system allows scientists to understand what area a given animal uses and its relationship to environmental variables. The tropics contain a large portion of the planet’s biodiversity and are losing habitat to land conversion for agriculture, subsistence farming, wood for fuel, and other development. Costa Rica is well known for its protection of a sizeable portion of its land for conservation and is a well-studied area. It is important to understand the spatial distribution of species in relation to urban development and protected areas as well as environmental variables. For example, Daily et al. (2001) found that 50% of the species that occurred in forest fragments also occurred in neighboring areas that had been deforested for human use in Costa Rica. In this paper I will address the spatial distribution of bird locations within Costa Rica in relation to habitat type (ecosystem) and urbanization (roads and human population density). |
Methods I obtained spatial datasets from the website DataBasin.org and performed spatial analysis in ArcGIS 10 (ESRI, Redlands, CA). I used a dataset of bird locations within Costa Rica (IABIN et al.) to understand the spatial relationships between birds and the environment. The original dataset contained over 130,000 X, Y locations of bird species from 1864 to 2009. I reduced the dataset down to over 97,000 records from the years 2000 to 2009 to limit the analysis to the most recent available locations. The records contain the bird’s order, family, genus, and species. I analyzed the bird data at the order level (n = 19 orders; Table 1). I obtained polygon shapefiles of the terrestrial ecosystems of Costa Rica (The Nature Conservancy and NatureServe) and the human population density by ecoregion in 2000 (The Nature Conservancy). The population density shapefile contained the entire world so I used the “Clip” tool to reduce it to Costa Rica. I performed a spatial join to assign an ecoregion to each bird location. I summarized the percentage of locations found within each ecoregion. I selected two orders, Apodiformes and Passeriformes, with the greatest number of locations to examine the location density by ecoregion and compared this with the human population density. I used a polyline shapefile of major Costa Rican roads (ESRI) to examine the distribution of bird locations in relation to their distance from roads. I used the “Near” tool to calculate the distance between every location and the nearest road. I summarized the average distance to a road for each bird order. |
||||||||||||||||||||||||||||||||||||||||
|
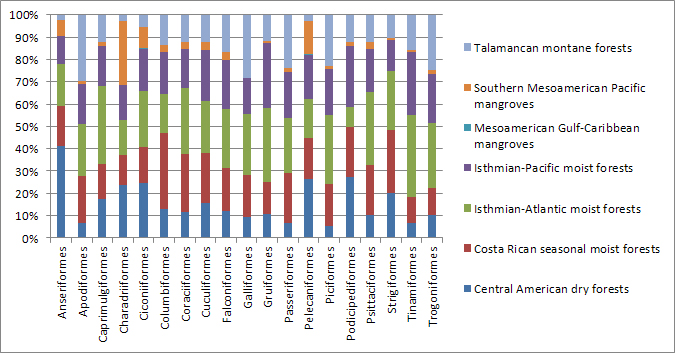
Results Excluding the Mesoamerican Gulf-Caribbean mangrove habitat, all bird orders were observed in all habitat types (Figure 1). The Southern Mesoamerican Pacific mangroves had predominantly more Charadriiformes and Pelecaniformes than other orders. This is expected given that these two orders consist of waterbirds that use coastal habitats. Anseriformes were more abundant in Central American dry forests than any other bird order.
The Isthmian-Alantic moist forests contained the greatest number of bird locations (23,370). However, it was followed closely by the Costa Rican seasonal moist forests (20,504), Talamancan montane forests (19,772), and the Isthmian-Pacific moist forests (18,843). The Mesoamerican Gulf-Caribbean mangroves had the fewest locations (100) but this habitat also occupies the least area. Evaluating habitats by bird location density produces different results. The Southern Mesoamerican Pacific mangroves had the highest location density (0.01 birds/km2), followed by Mesoamerican Gulf-Caribbean mangroves (0.007), Talamancan montane forests (0.0002) and Costa Rican seasonal moist forests (0.0001). The remaining habitats had a density of less than 0.0001 birds/km2.
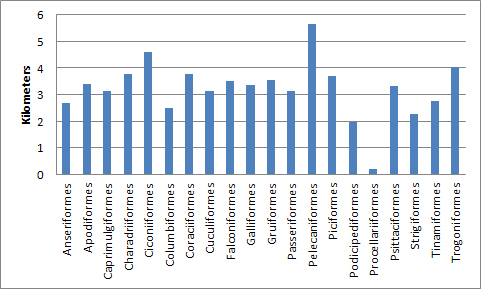
Taken together, all bird locations averaged a distance of 3.4 km from the nearest major road (range 0.2 to 5.7 km; Figure 2). The Pelecaniformes were the only order greater than 5 km away from roads. Most orders were within 2 to 4 km of a major road (Figure 2). Only one order, the Procellariiformes, was less than 1 km from a road.
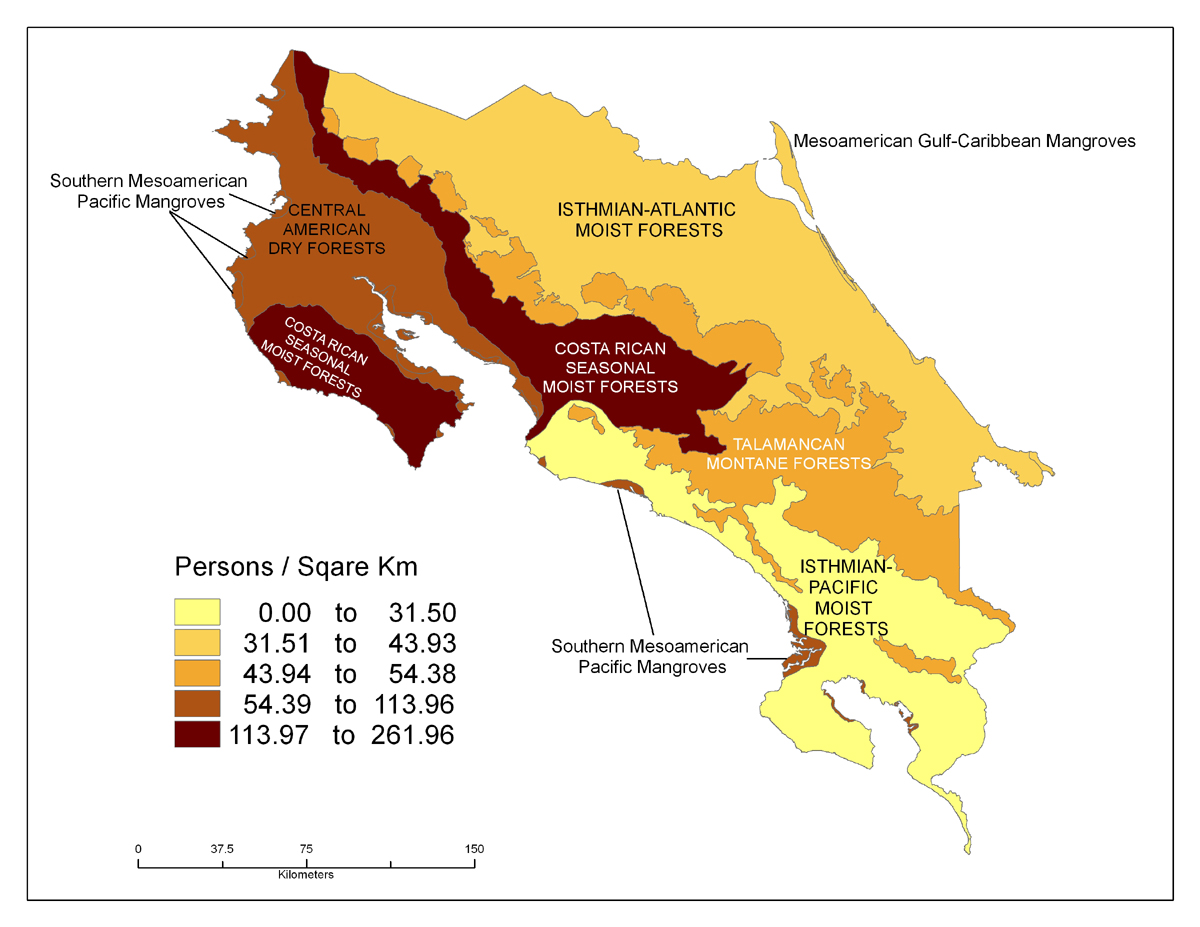
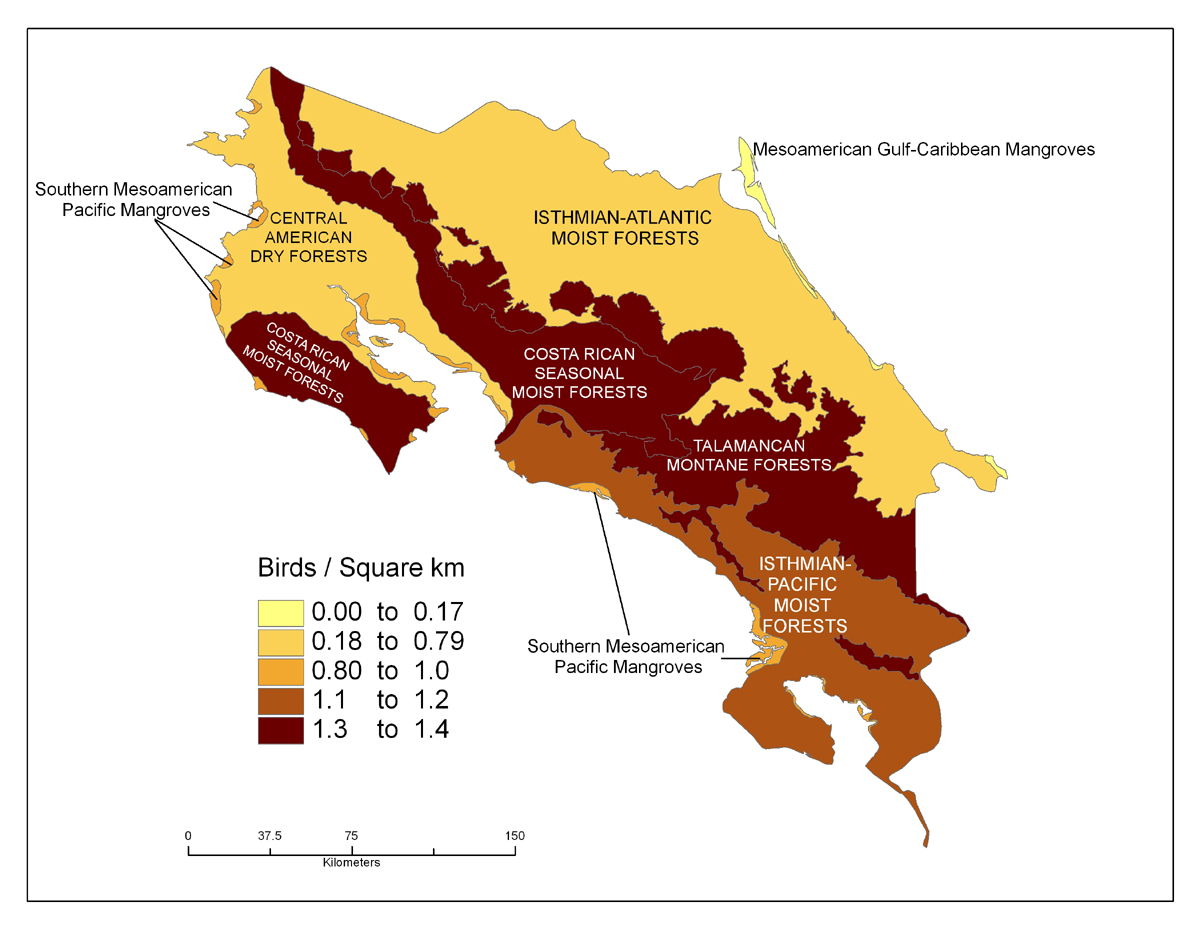
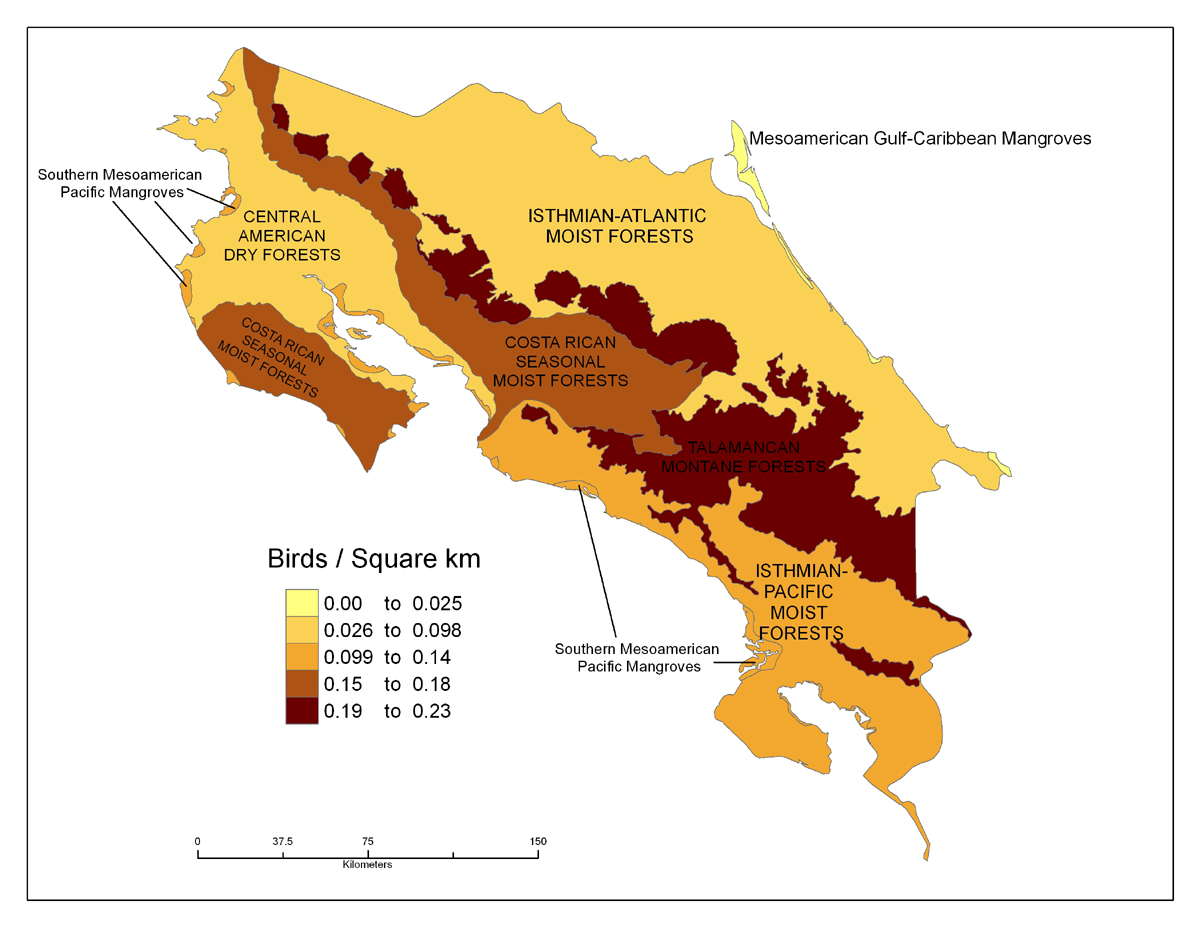
The highest human population density occurred in Costa Rican seasonal moist forest (Figure 3). The lowest density occurred in the Isthmian-Pacific moist forests. The highest density of Passeriformes locations was found in both the Costa Rican seasonal moist forests and the Talamancan montane forests (Figure 4). Their second highest density occurred in the Isthmian-Pacific moist forests. The highest density of Apodiformes was in the Talamancan montane forests and their second highest density was in the Costa Rican seasonal montane forests (Figure 5). Both orders had the lowest density in the Mesoamerican Gulf-Caribbean Mangroves.
| |||||||||||||||||||||||||||||||||||||||||
|
Table 1. The bird orders used in the analysis and the common names of the species within each order. | ||||||||||||||||||||||||||||||||||||||||
|
Figures | |||||||||||||||||||||||||||||||||||||||||
|
Figure 1. Percent of bird order locations found within each ecoregion. | ||||||||||||||||||||||||||||||||||||||||
|
Figure 2. The average distances of bird locations from major roads. | ||||||||||||||||||||||||||||||||||||||||
|
Figure 3. The density of the Costa Rican human population by Ecoregion. | ||||||||||||||||||||||||||||||||||||||||
|
Figure 4. The density of Passeriformes by Ecoregion. | ||||||||||||||||||||||||||||||||||||||||
|
Figure 5. The density of Apodiformes by Ecoregion. | ||||||||||||||||||||||||||||||||||||||||
|
Analysis
Some areas of high bird density correspond to areas of high human density while others correspond to areas of low human density. The Southern Mesoamerican Pacific mangroves and Mesoamerican Gulf-Caribbean mangroves had the highest density of all bird order locations and a high and relatively low level of human population density, respectively. The Mesoamerican Gulf-Caribbean mangroves are geographically isolated from the mainland and this may help keep the human population low. Passeriformes have the highest density in the ecoregion with the high human density. However, they also have a fairly high density in the ecoregion with the fewest people. In contrast the Apodiformes have the highest density in an ecoregion of moderate human population density. Some bird species may be habitat generalists and can survive in fragmented landscapes that exist where human population densities are highest. However, a low human population density is not indicative of an undisturbed landscape. Many agricultural areas likely have low human density but highly degraded and fragmented landscapes that may not support populations of many sensitive bird species. It would be interesting to look more closely at areas with high bird and human densities and see if there are long term trends for both. As human population density increases bird density may decrease as land is modified.
The results present an interesting preliminary look at bird presence in relation to habitat, human population density, and road networks. I found it difficult to tie all these different results together. A more appropriate approach would use a statistical model to determine the significance of each variable to the presence of a bird species. For this purpose it might have been more informative to use an individual species with a high number of locations rather than all of the different orders. Furthermore, an extensive literature review of individual species or familes would help provide a better interpretation of these results.
When I first acquired the data I downloaded layer packages. However the tool within ArcGIS to open these packages was not functional. I tried using the code for it in a python script but was still unsuccessful. As a result I had to re-download the data in shapefile format.
| |||||||||||||||||||||||||||||||||||||||||
|
Conclusions
The use of physical landscape data in combination with biological data in a geographic information system provides important insights into animal space use. Of the species detected, most birds have been found at distances greater than 3 km away from major roads. This information could serve as a useful component for an analysis to determine areas to protect or restore for the future. The data could be analyzed at the species level if a particular species becomes in need of special protection.
To more carefully determine areas that are heavily used by birds it would be useful to examine the bird locations in relation to protected areas, urban areas, and more specific habitat designations. The majority of habitats are used within a similar range of percentage across bird orders. While this analysis did not find any strong results, this type of analysis could be used to help determine areas of importance for different orders or species. More specific habitat categories within these broad habitats may be required to observe more meaningful trends.
Limitations of the Data
The sampling methods used for these various bird detections are unknown. Sampling may have been biased to areas that were easily accessible or within natural habitats. If sampling was biased towards natural areas then it is impossible to determine if the trend of locations being farther away from roads is accurate. The birds may exist within 1 km of a road but such human-modified areas may have been underrepresented in the sample.
Further, the terrestrial ecosystems shapefile did not contain an urban component so it is unknown how many of these bird locations came from urban areas. The ecosystems are broad categories that span large geographic areas. Presumably there are differing habitat types that exist within the broad category. Species in the Charadriiformes and Pelecaniformes orders are likely using bodies of water that exist within the forests that are not detected at the scale of the dataset.
| |||||||||||||||||||||||||||||||||||||||||
|
References Chefaoui, R.M., J. Hortal, and J. M. Lobo, 2005. Potential distribution modeling, niche characterization and conservation status assessment using GIS tools: a case study of Iberian Copris species. Biological Conservation, 122: 327-338. Daily, G.C., P.R. Ehrlich, and G.A. Sanchez-Azofeifa, 2001. Countryside biogeography: use of human-dominanted habitats by the avifauna of southern Costa Rica. Ecological Applications , 11(1): 1-13. ESRI, 1993. Roads of Costa Rica from Digital Chart of the World. Shapefile available from DataBasin.org. Accessed 20 November 2011. Ferrier, S., G. Watson, J. Pearce, and M. Drielsma, 2002. Extended statistical approaches to modeling spatial pattern in biodiversity in northwest New South Wales. I. Species-level modeling. Biodiversity and Conservation, 11: 2275-2307. IABIN, InBio, and Global Biodiversity Information Facility, year unknown. Las aves de Costa Rica. Shapefile available from DataBasin.org. Accessed 20 November 2011. Ray, N., A. Lehmann, and P. Joy, 2002. Modeling spatial distribution of amphibian populations: a GIS approach based on habitat matrix permeability. Biodiversity and Conservation, 11: 2143-2165. Sanderson, E.W., K.H. Redford, C.L.B. Chetkiewicz, R.A. Medellin, A.R. Rabinowitz, J.G. Robinson, and A.B. Taber, 2002. Planning to save a species: the jaguar as a model. Conservation Biology, 16: 58-72. The Nature Conservancy, 2010. Population density, 2000, by terrestrial ecoregion. Shapefile available from DataBasin.org. Accessed 20 November 2011. The Nature Conservancy and NatureServe, 2007. Los ecosistemas terrestres de Costa Rica. Shapefile available from DataBasin.org. Accessed 20 November 2011. | |||||||||||||||||||||||||||||||||||||||||