A Special Presentation of Poverty and Human Development Index in Sub-Saharan Africa
Author Information
Laleh Rastegarzarzadeh
American River College, Geography 350: Data Acquisition in GIS; Fall 2011
Abstract
This section may also be known as a literature review, previous work, etc. Examples from the literature are described along with explanation of how that previous work relates to the authorís project. The required citation format in text shows author names and year of publication in parentheses, for example: (Goodchild and Proctor, 1997).
Introduction
Human welfare has been the quest of mankind since the dawn of history. It is evident that this issue is beyond each individual and deeply interconnected with local and global well being of the people and environment. There has been a national effort to understand the parameters impacting human wellness and define them as measurable values for better policy making and improvement.
Poverty is the most common agreed parameter degrading the life quality. UN defined poverty as an economic condition of lacking both money and basic means to access to food, education, healthcare and shelter. http://www.worldhunger.org/articles/Learn/world%20hunger%20facts%202002.htm Although in past decades the number of people in poverty has decreased but still, as of 2008 , the World Bank has estimated that there were an estimated 1,345 million poor people in developing countries who live on $1.25 a day or less. In Sun-Saharan Africa, the number of people in extreme poverty has increased.
In 1990, UN Human Development Programme (HDP) introduced Human Development Index (HDI) to report the welfare status of countries. HDI is a composite index including health, education and income. Special presentation of poverty and HDI indicators could be helpful in better understanding the regional human welfare and study further the correlation of indicators as well as possibility of impact of other unconsidered parameters. In this paper, the poverty status and HDI indicators are presented spatially.
Background
The main three dimensions of HDI are: 1) A long healthy life 2) Education index 3) A decent standard of living. The definition and calculating method of indicators associated with each dimension has been developed in past decade. Figure-1 shows three dimensions of HDI and their indicator.
The healthy long life is indicated by life expectancy of minimum of 20 years and maximum of 83.4 years. This is the maximum age observed in developed countries in time series, 1980-2010. The main change in HDI is related to measuring the education index. The education component is now measured by mean year of schooling for adults aged 25 years and expected years of schooling for children of school age. The living standard has the minimum value of $100 (PPP) and a maximum of $107,721 (PPP), estimated at the same time range, 1980-2010. The decent standard of living component is measured by GNI per capita (PPP$) instead of GDP per capita (PPP$) The HDI uses the logarithm of income, to reflect the diminishing importance of income with increasing GNI. The scores for the three HDI dimension indices are then aggregated into a composite index using geometric mean (Human Development Report 2011).
(http://hdr.undp.org/en/reports/global/hdr2011/).
Methods
The HDI data were extracted from UNDP website. The following table shows the highest and lowest HDI as well as the average HDI value for Sub Saharan Africa(Human Development Indeces & Data).
|
|
Norway
|
Em. Rep. Congo
|
Sub-Saharan Africa
|
|
HDI
|
0.943
|
0.286
|
0.463
|
The data of percent population of African countries living under $1.25 were collected from UNdata.
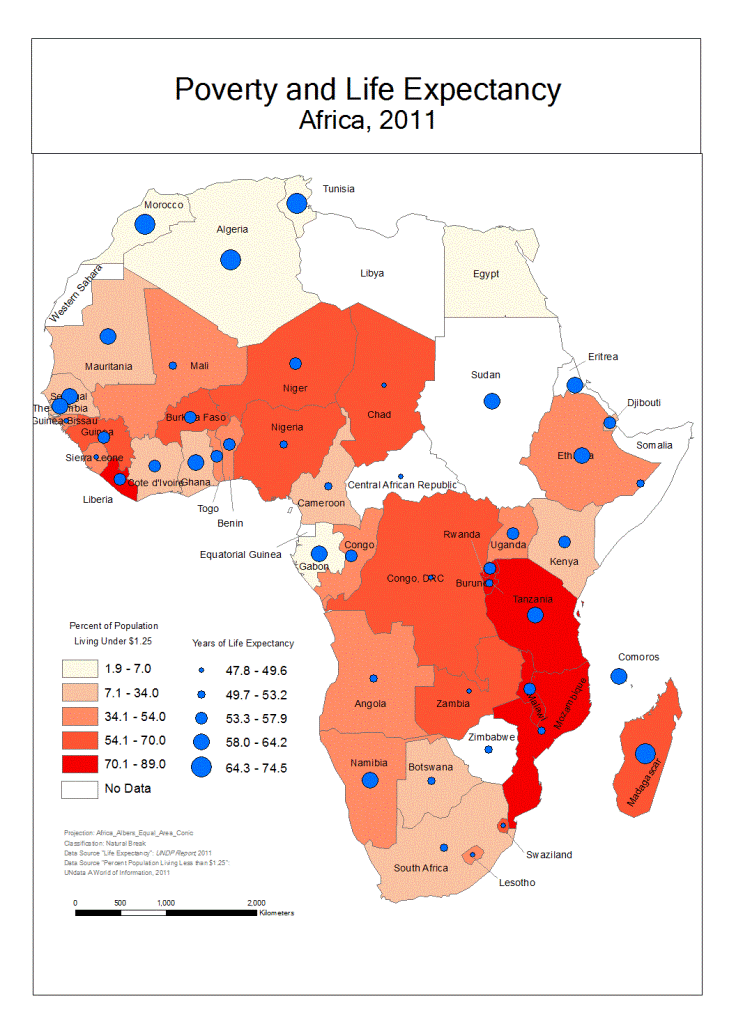
A bivariate map of African countries was prepared in Arc-GIS 10, presenting percent population living with less than $1.25 per day and life expectancy of adult.
Results
For most of the countries a direct relation is observed between poverty and low life expectancy. More investigation is required to understand the other factors affecting the life expectancy rather than income.
Conclusion
The special presentation of poverty and life expectancy demonstrate the complexity of cause and effects in human wellness. Other factor affecting life expectancy could be environmental degradation due to man natural disasters or exploitation. Also political instability strongly affects the healthcare, educational program and natural resources which all interconnected with viability of a healthy and sustainable community.
References
Akinyemi, F.O..2003.Mapping selected Human Development Indicators in Sub-Saharan Africa.Department of Geography.Obafemi Awolowo University.Osun State, Nigeria.
Heninninger, Norbert.1998. Mapping and Geographic analysis of Human Welfare and poverty. World Resources Institute, Washington, D.C., USA.
Hickey, Samuel. 2001. Chronic Poverty in Sub-Saharan Africa and South Asia. ISBN Number: 1-904049-00-1.


