WASHINGTON UNIFIED SCHOOL DISTRICT'S
2011 ACADEMIC PERFORMANCE
Prepared for GEOG 350 Professor Paul Veisze
Prepared by Leonora Antonio
ABSTRACT
Schools performances are based on standardized test results. Those test results determine a public school's Academic Performance Index. A school that has the highest expenditure per pupil does not guarantee that that school is performing at the API 800 benchmark. Living in close proximity to a high performing school also does not guarantee your children will attend that school. School boundaries that are set in place may shift and change and your children may be transferred to another school.
INTRODUCTION
The Academic Performance Index (API) is a number score ranging between a low 200 and a high 1,000 which measures a school's performance based on statewide test results, with a benchmark of 800. The API was established by the Public Schools Accountability Act (PSAA) of 1999 to measure a school's growth. The No Child Left Behind (NCLB) Act of 2001 was put in effect in 2002, designed to make teachers more accountable for students' education. The NCLB's goal is to have every student be proficient in math and reading by 2014. This paper is to compare the current API growth differences of schools in Washington Unified School District (WUSD).
BACKGROUND
My children's education is important to my husband and me. We believe that our children's education includes both teacher and parent involvement, and not the sole and exclusive responsibility of teachers to teach them. We read to/with them almost every evening and try to make weekly trips to the library. They each have their own library card, including my youngest who just turned five. I communicate with my children's teachers via email and track my children's progress online via Homelink. I used to volunteer in their class when I could.
We moved out of the bay area to raise our children partly because of the housing market. In West Sacramento, we wanted our son to attend Bridgeway Island Elementary School (Bridgeway) which is one of the newest schools; but, the neighborhood we moved into was not located within that school boundary. Three years later, we moved into a new development within the boundaries of Bridgeway. We enrolled our son in kindergarten. About a month before the school year began, we received a notice in the mail indicating that the school boundaries have been rezoned and our son was transferred to Southport Elementary School (Southport). Since then, I've been checking the performances between Bridgeway and Southport elementary schools based on their API scores via the California Department of Education website (http://www.cde.ca.gov/ta/ac/ap/).
Last year, my son was accepted into the GATE (Gifted and Talented Education) program. We transferred him to Westmore Oaks Elementary (Westmore) where the program is located. In the Washington Unified School District (WUSD), there is only one GATE class for each grade level between 4th and 8th graders. Interestingly, the GATE program in WUSD is not located in the highest performing school. The API score for Westmore ranks below Southport and Bridgeway elementary schools. Some of the children in the GATE program are transfers from other elementary schools in WUSD except for those children who were already attending Westmore.
Last fall we discovered, through our son's baseball coach, that we could transfer our children to a school in Davis even though we do not live in Davis because Davis and West Sacramento are in the same county. I considered this. I looked into the Davis Unified School District and compared its API scores and ranking with WUSD. Sure enough, Davis has higher API scores. My youngest is going to start kindergarten this coming school year and kindergarten is half day. This would mean three separate trips to Davis instead of two. If the three boys would have the same class schedule, we might have transferred them to Davis and coordinated a carpool schedule with his previous coach.
METHODS
Initially, I wanted to compare Davis Unified School District and WUSD API scores growth from when we first moved to West Sacramento to present. I downloaded API scores between 2002-2003 and 2010 2011 from CDE website and intended to prepare a comma delimited file. I was able to download a shape file containing school district boundaries in California (http://www.census.gov/cgi-bin/geo/shapefiles2010/layers.cgi). Upon reading Understanding the Academic Performance Index (Ed Data, September 2011), I discovered API scores are not intended to track growth through several years.
"The meaningful comparison is within each annual API cycle, between the Base API and the Growth API, because the computation of the API is kept as similar as possible within each cycle."
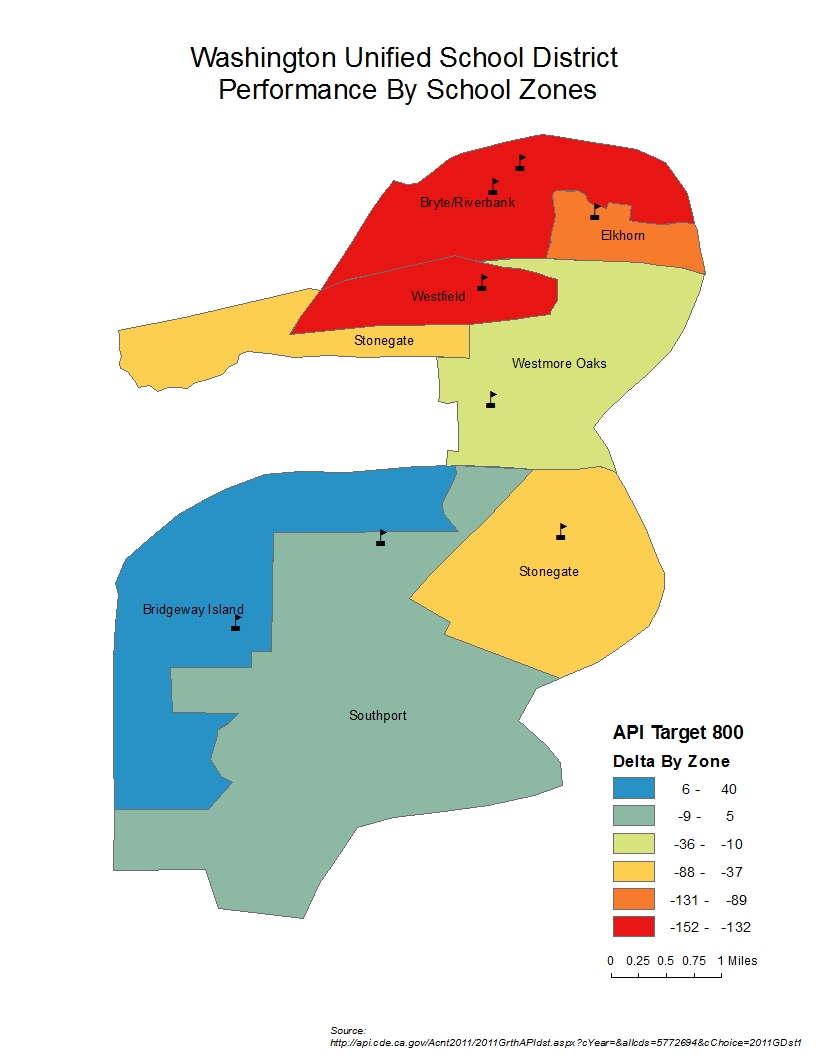
Comparing WUSD and Davis Unified School District would have been a map of just two polygons. Instead, I digitized WUSDs elementary school boundaries and compared the elementary schools within WUSD. I digitized WUSD's elementary school boundaries using WUSD's school boundaries map (http://www.wusd.k12.ca.us/Additional/Elementary_Boundaries/elementary_boundaries.html) as a guide and one of ArcDesktop base maps. When digitizing the school boundary polygons, I included the API growth score from 2010 and 2011 in the attribute table and the difference of those values against the 800 API standard was calculated. A dichotomous map was then prepared comparing the schools API score against the statewide API standard of 800.
RESULTS
The following are my list of references and sources for the results.
California Department of Education (CDE). 2010–11 Academic Performance Index Reports Information Guide. http://www.cde.ca.gov/ta/ac/ap/documents/infoguide11.pdf
____. 2012. Private Schools Frequently Asked Questions. http://www.cde.ca.gov/sp/ps/rq/psfaq.asp#d1
Ed-Data Education Data Partnership. 2011. Understanding the Academic Performance Index. September. http://www.ed-data.k12.ca.us/_layouts/EdDataClassic/articles/Article.asp?title=Understanding%20the%20API
U.S. Census Bureau. 2010 Census Data. http://2010.census.gov/2010census/data/
____. 2012a. Your source for population, housing, economic, and geographic information. http://factfinder2.census.gov/faces/nav/jsf/pages/index.xhtml
____. 2012b. Tiger Line shape files. http://www.census.gov/cgi-bin/geo/shapefiles2010/layers.cgi
Washington Unified School District. 2012. School Boundaries. http://www.wusd.k12.ca.us/Additional/Elementary_Boundaries/elementary_boundaries.html
ANALYSIS
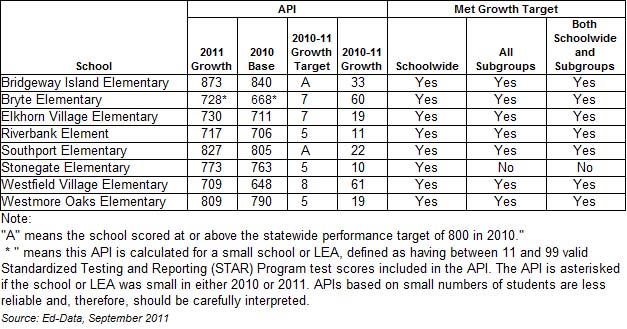
The results on the dichotomous map were predictable. Areas on the map in red hues indicate the school overall is not meeting the 800 API standard, whereas areas that are blue indicate the school is at or above the 800 API standard. Bridgeway is the only elementary school in WUSD that is not a Program Improvement School. The second top performing school in WUSD is Southport. It is designated as a Program Improvement School even though it met the 800 API standard, and its growth goal. Even though Southport met its growth targets, not all of its subgroups (subgroups of ethnic, socioeconomically disadvantaged [SED] students, English learners, and students with disabilities) were at or above the 800 API standard. Not only does the school overall need to meet the 800 API standard, the subgroups need to meet the standard as well.
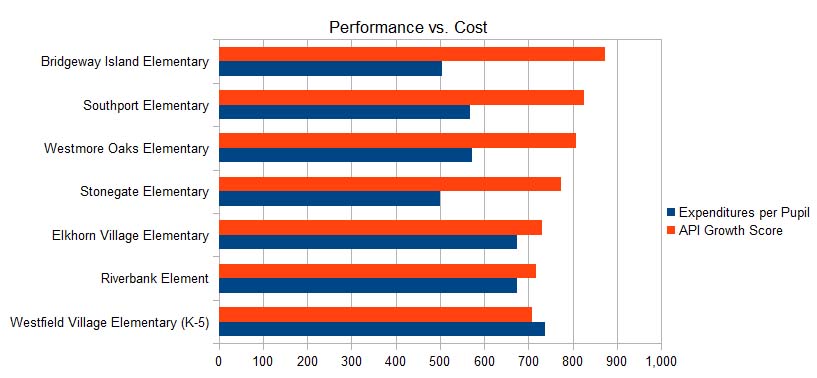
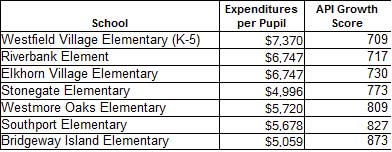
Information was easily obtained via the CDE and WUSD websites. WUSD contain links to each of its public schools websites where the schools Accountability Report card can be viewed. The Accountability Report card also indicates the schools expenditure per pupil. It was interesting to compare the expenditure per pupil by school and its API score. The highest performing school (Bridgeway) spent the second to least amount per pupil, whereas the lowest performing school has the highest expenditure per pupil. Census data regarding income by zip code or specific areas in West Sacramento was not obtained.
Schools in the newer neighborhoods performed better compared to schools in the older neighborhood. The map boundaries indicated are for public schools. Only locations of those public schools were symbolized. Private schools were not assessed or indicated on the map because private schools are not included in the API . To check how a private school is performing, one must request from that private school the school's profile and standardized test results per grade (http://www.cde.ca.gov/sp/ps/rq/psfaq.asp#d1). The map does not indicate how home-schooled children are performing and what neighborhood children are being home-schooled.
CONCLUSION
Further research needs to be conducted to compare the subgroups and subgroup's performances per school in WUSD. Also, further research needs to be conducted to determine the correlation between the schools expenditure per pupil and API score, and what those expenditures include. The lowest performing school spends the most per pupil whereas the highest performing school spends the second least per pupil. The highest performing school is located in one of the newest and one of the priciest neighborhoods. It would be interesting to compare household income with academic performance in these specific areas.