Title
Protecting
California's Water Bodies:
An Analysis of Urban Runoff in Urban Areas Contributing to Impaired Water
Bodies
Written By:
Jane Herrig
American River College, Sacramento, California
Geography 350: Data Acquisition in GIS; Spring 2012
Contact Information:
environmentalist10@gmail.com
Abstract
Regulating California’s
water bodies based on available data. California's water bodies are evaluated
every two years mandated by the US EPA and conducted by the Water Boards. The
most recent intergraded report came from 2010.
Introduction
California water bodies are now polluted what is now considered the most
significant source of water pollution; storm water and non-storm water
discharges. The State Resources Water Control Board is renewing their phase II
small municipal separate storm water systems (MS4s) permit. This permit
regulates storm water discharges from MS4s. This report will evaluate land
boundaries such as urban census areas, city limits, and impaired water body
segments in order to approximate the creeks that should have urban runoff
pollution as a direct result from being in an urban area within city limits of
MS4s. This will be regional analysis.
Background
The Water Boards created GIS for the 2010 Integrated Report and 303(d) listed water bodies for reporting purposes. They Boards leave a disclaimer that the development of these GIS files should not be considered for authoritative purposes in regards to TMDLs or other things. Documenting the California water segments is a work in progress and is updated every two years. Information for all of the California water segments is not addressed. I am using the GIS files as if there were to be used for authoritative purposes for targeting SMS4s who would have to monitor water segments under the new draft permit.
California has a total of three million acres of lake, bays, estuaries and wetlands (4). Approximately 50% of California’s water bodies are not meeting water quality standards. Out of California’s expansive water bodies only 60% have been assessed for water quality standards (4). Of the 12 pollutants found in urban runoff bacteria (pathogen), trash, and pesticides have increased since the last listing in 2008. Bacteria listing have increased due to increased awareness and not increasing bacteria levels. The same goes to trash and pesticide listings on California water bodies, increased and better reporting (4).
The most recent report based on California water bodies and their associated pollutants was issued by USEPA on Oct. 11, 2011. The Boards added this list to the California’s 2010 303(d) list. The Integrated report places each water body into one of three categories based on beneficial use.
Each water segment on these categories is not meeting water quality standards or not expected to meet water quality standards. For this project I have interested in only two categories (5 & 4A) and from these categories water segments not meeting and not required to meet water quality standards. These categories might require the development of a TMDL or is being addressed by a USEPA approved TMDL. Water bodies on the list are based on the readily available data and information. The information is weighted to indicate whether or not there is enough evidence to justify adding the water segments.
Methods
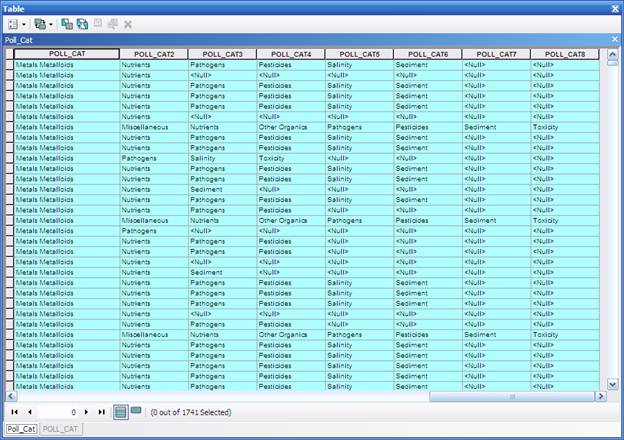
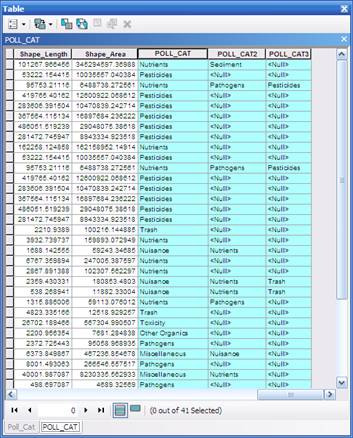
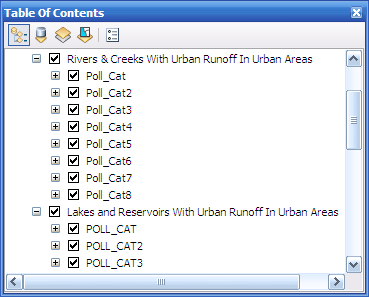
The information for this topic was relatively easy to find. The data was all available online through the SWRCB website or given to me through class. However, the data was not readily available for analysis. Half of the data was in an excel spreadsheet with no ties to the downloadable geodatabase from SWRCB website. The excel spreadsheet of the impaired water bodies had to be massaged into the correct format and refined for only the information needed for the analysis. The analysis was only concerned with Small MS4s and this information was available as another excel spreadsheet on the SWRCB website but had no relation to the intergraded 2010 report. Again I had to sort out the Phase I and Phase II MS4’s and fix the data into the correct format for ArcMap 10. I created a data set with only Phase II MS4s. The Phase II MS4s city names were than linked to the city limits or county limits of shapefile obtain from the instructor. This was done because impaired water bodies from the 2010 intergraded report list stretch outside the city limits and/or county limits of Phase II MS4s and this analysis is only concerned with segments which lye inside the city limits/ county limits. From here was I able to only display impaired water body segments from the 2010 intergraded report in areas inside Phase II MS4’s with urban runoff. The next part was to display the type of pollutants in each impaired water body segment. This was done by adding 8 pollutant category fields to an attribute table. This was done to create the easiest display for symbology purposes. Some water bodies and segments had up to 8 different types of pollutant categories per urban runoff. To be able to show the impairments of the water bodies I had to copy the layer 8 times and stack them accordingly to their order of pollutant. There was up to 12 different kinds of pollutants but not all segments had all 12 pollutants. The most any one segment had per urban runoff in a Phase II Small MS4 was 8 pollutants. Each pollutant was given a certain color and was labeled the same color for all 8 layers and only symbolized the one pollutant category per layer to allow a pyramid of stacking. The symbology colors at the bottom of the pollutant category were given a symbol size of 40 and decrease moving upwards.
Results
Once all the information was combined, I was able to analyze the information and determine which Phase II MS4s would require monitoring based on pollutant categories and which Phase II Small MS4s would not according to the draft permit requirements. The data shows that one third of the Phase II’s would not have to monitor for pollutants according to the draft permit, while two thirds of the Phase II’s would have to take on the task of monitoring. Monitoring would require time, money and effort which many Phase II Small MS4s don’t have.
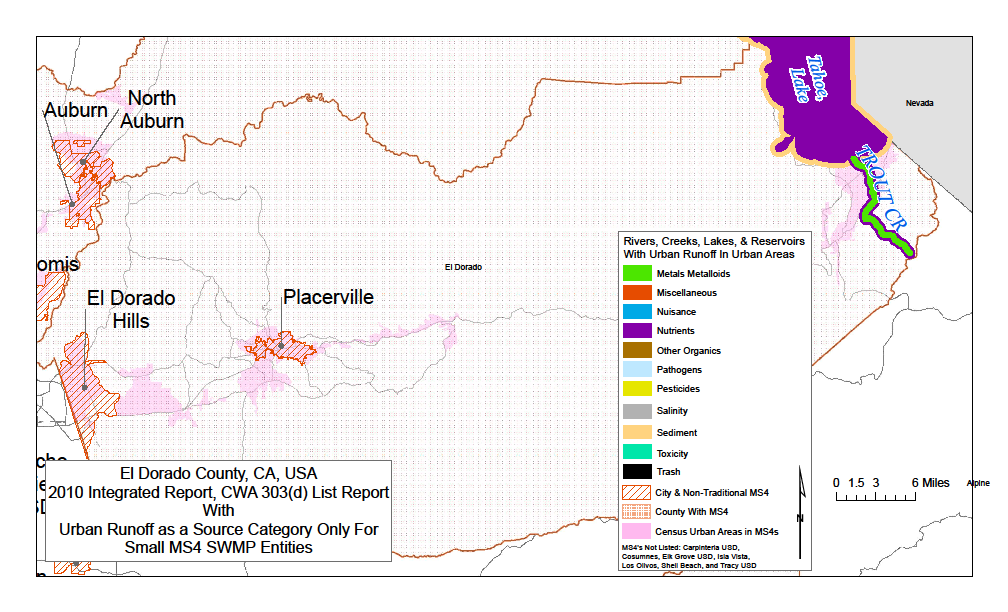
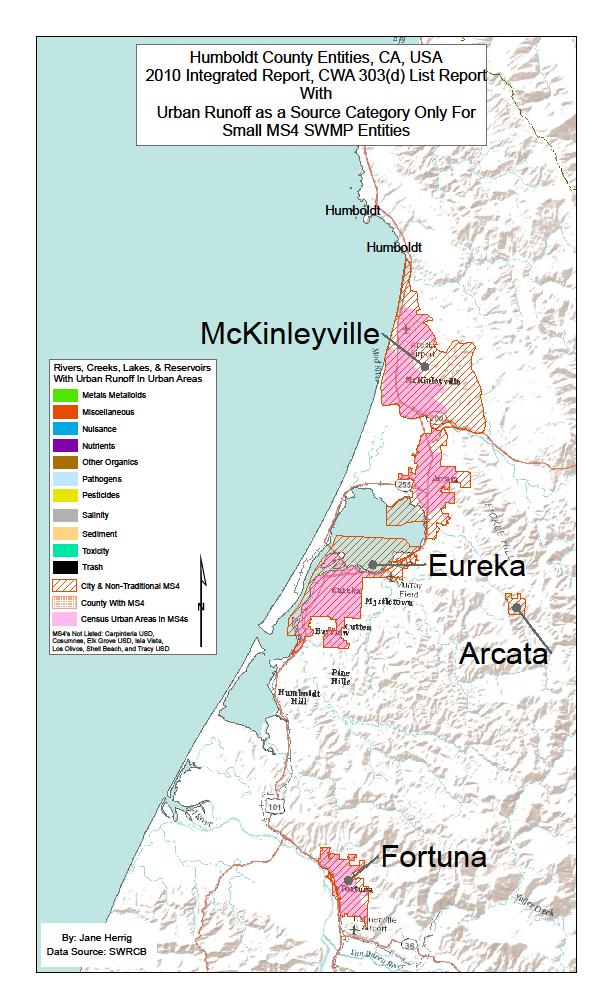
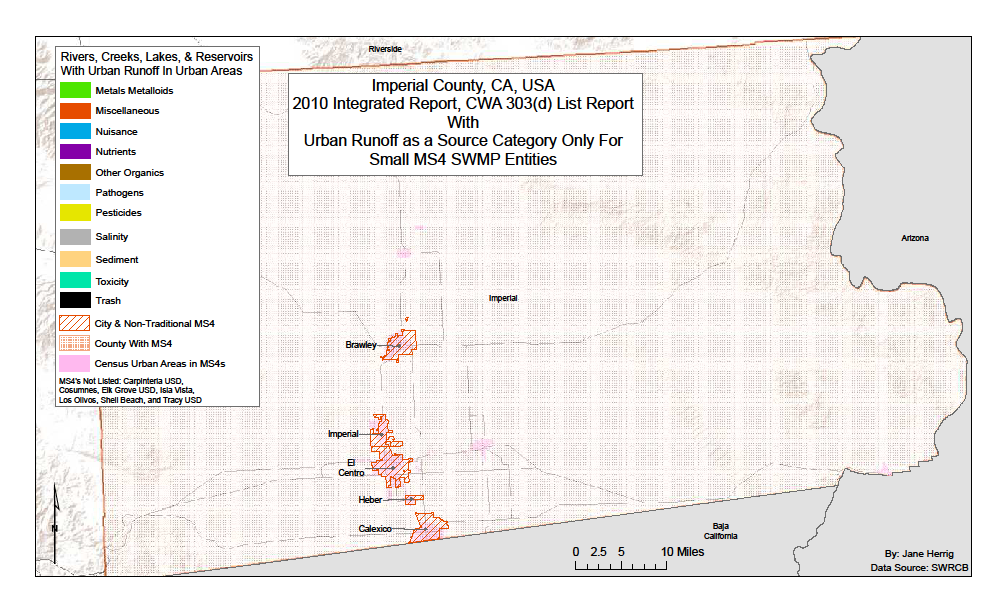
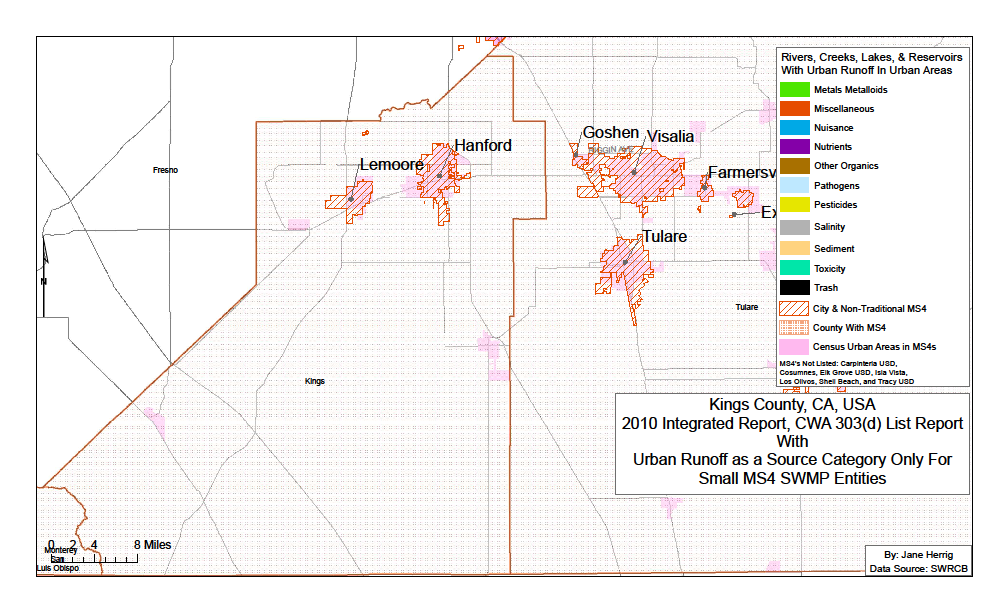
Figures and Maps
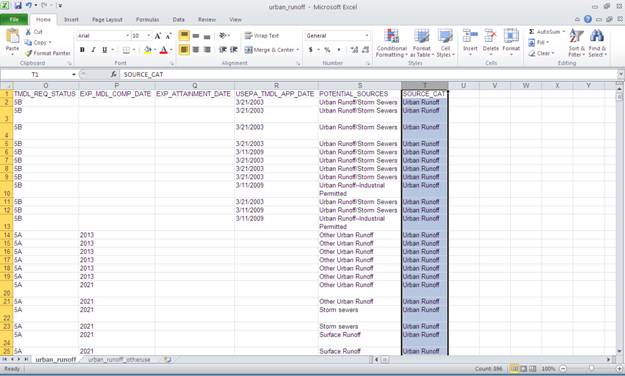
The image below is a screen shot of the excel spread sheet provided by Water Boards for all 303 (d) listed water bodies and segments in 2010. I had to find all the water bodies and segments those source category was urban runoff.
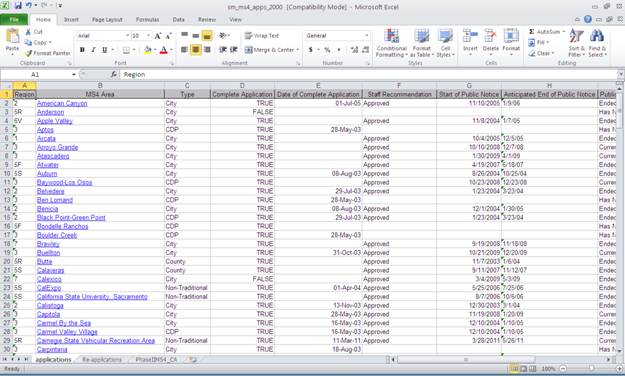
The image below is a screen shot of the excel spread sheet from the Water Boards displaying all the California small MS4’s who applied for NPDES permits. This excel spread sheet was used as qualitative analysis to select and join California city names to the city limits shapefile. There was a good amount of cleaning done to the excel before adding it to ArcMap10 for a join.
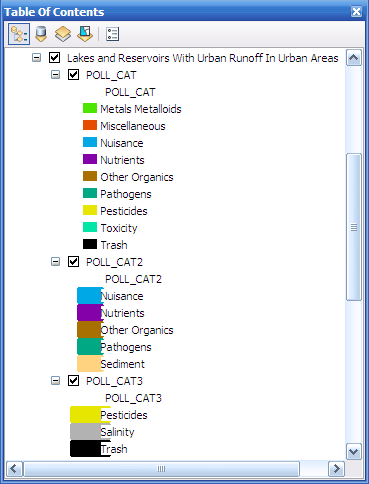
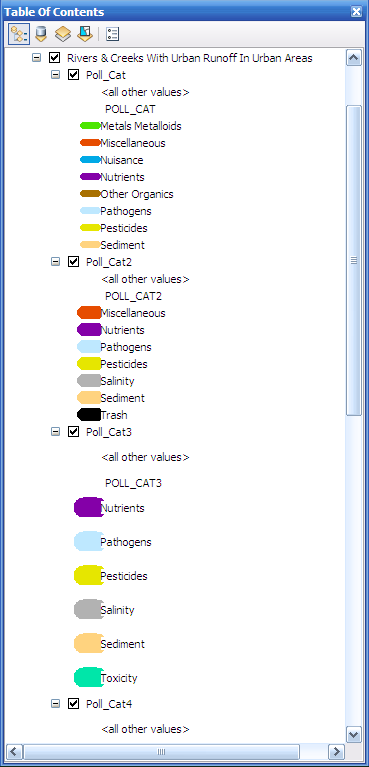
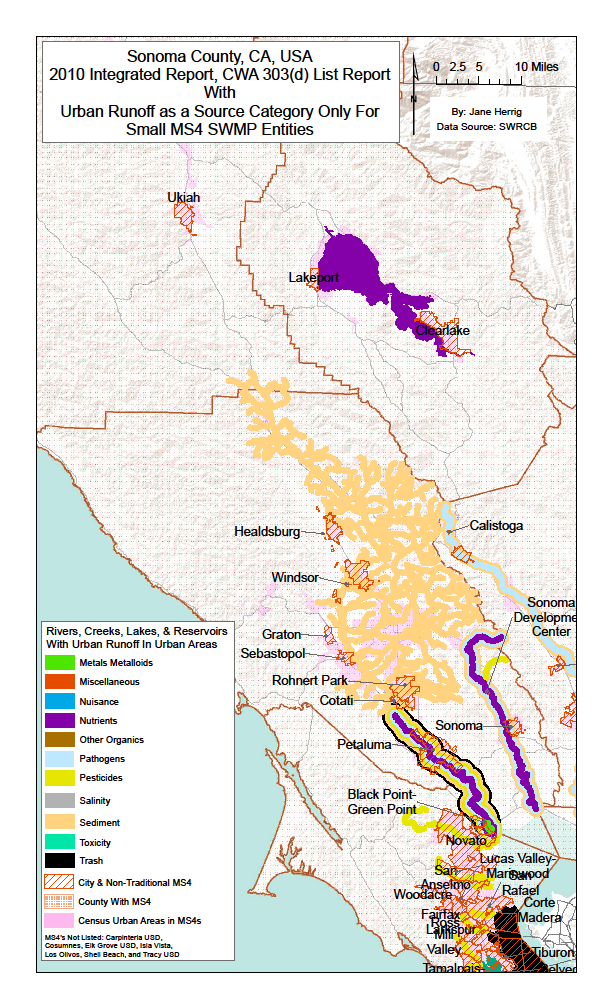
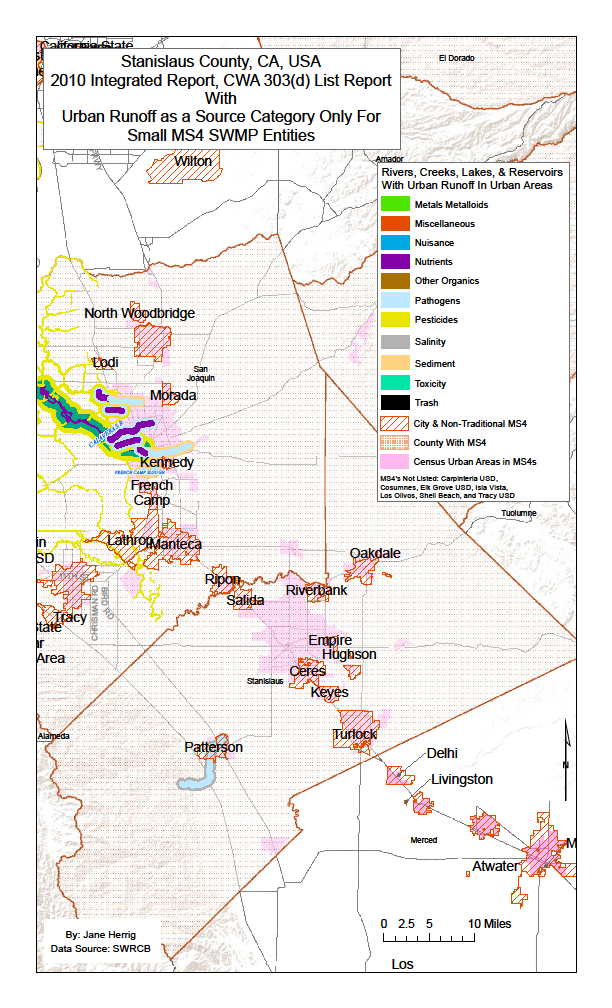
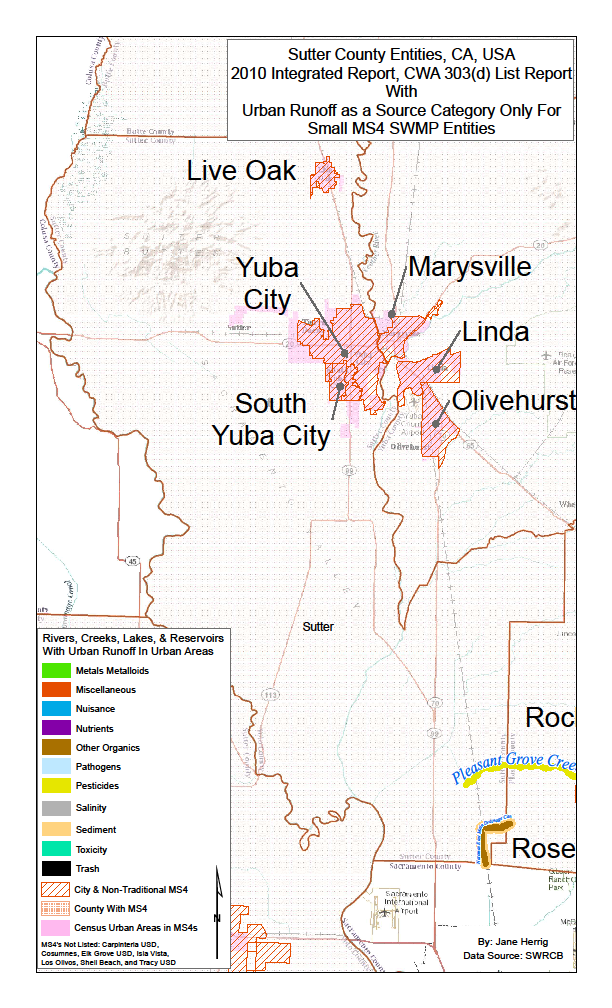
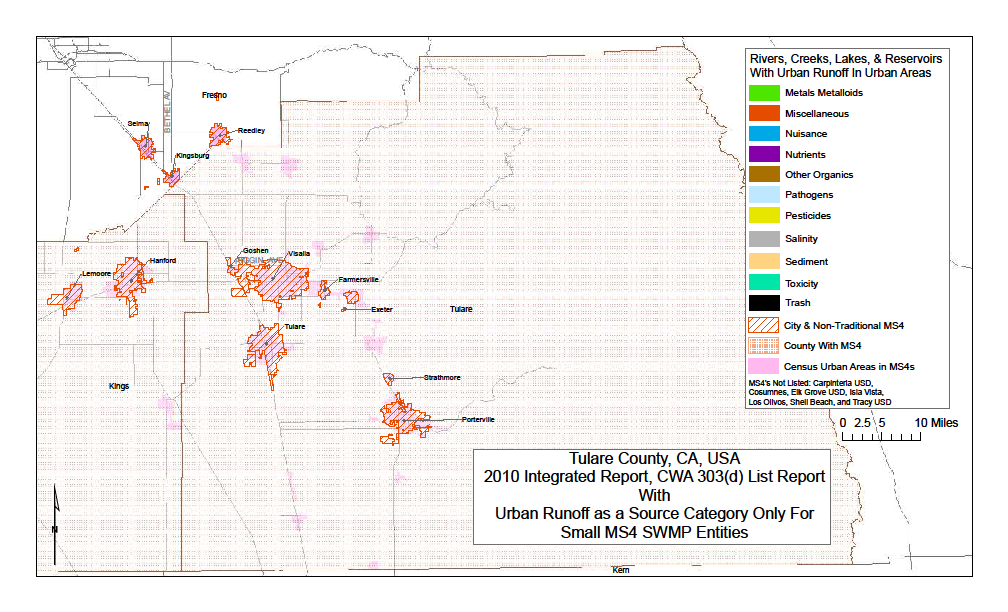
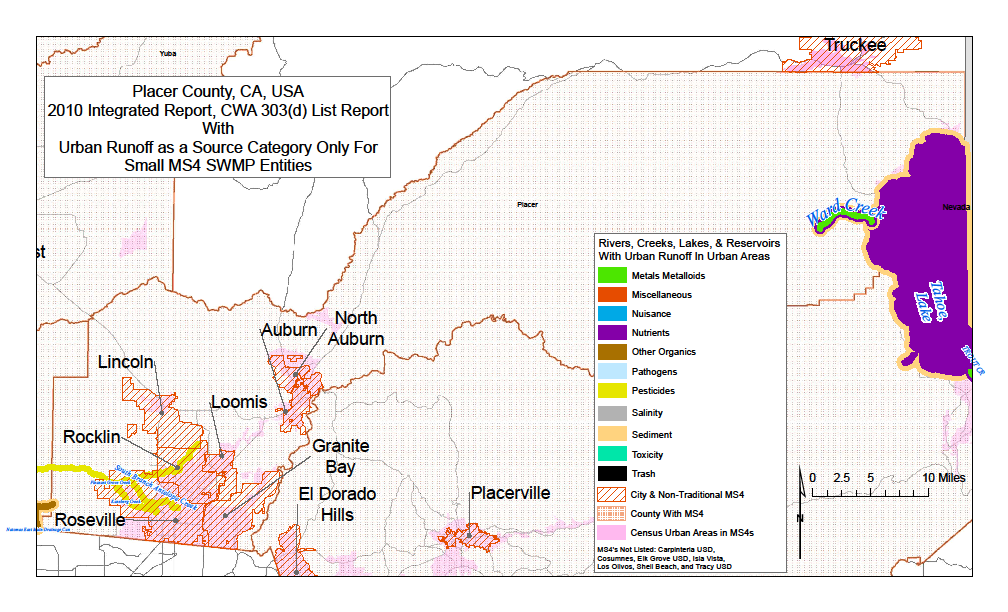
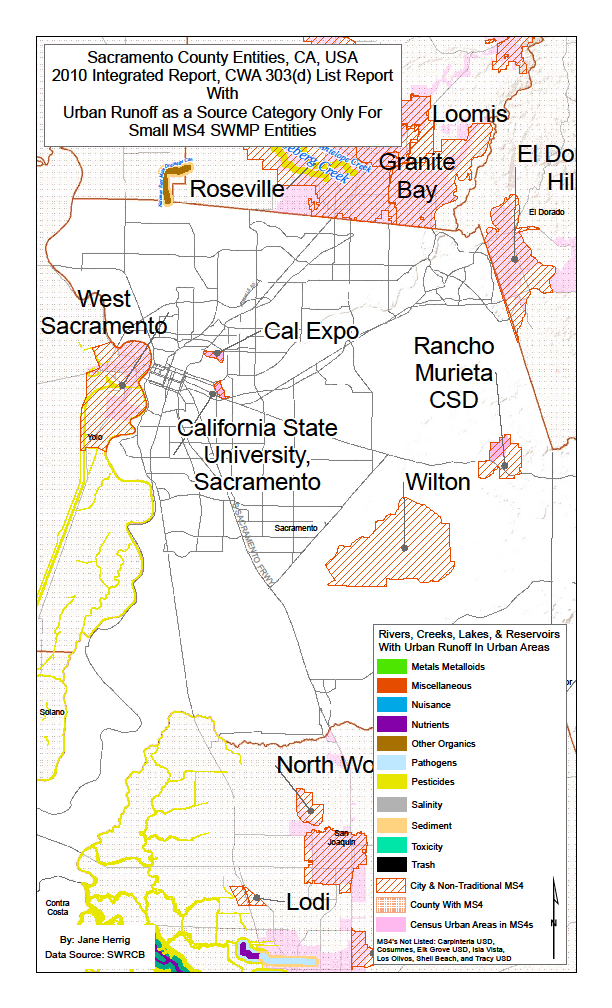
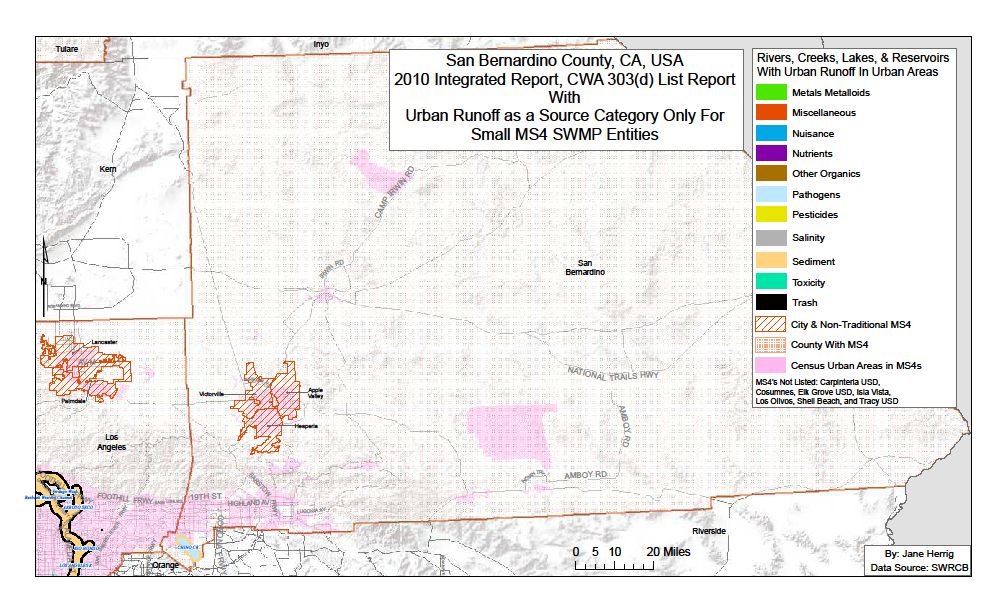
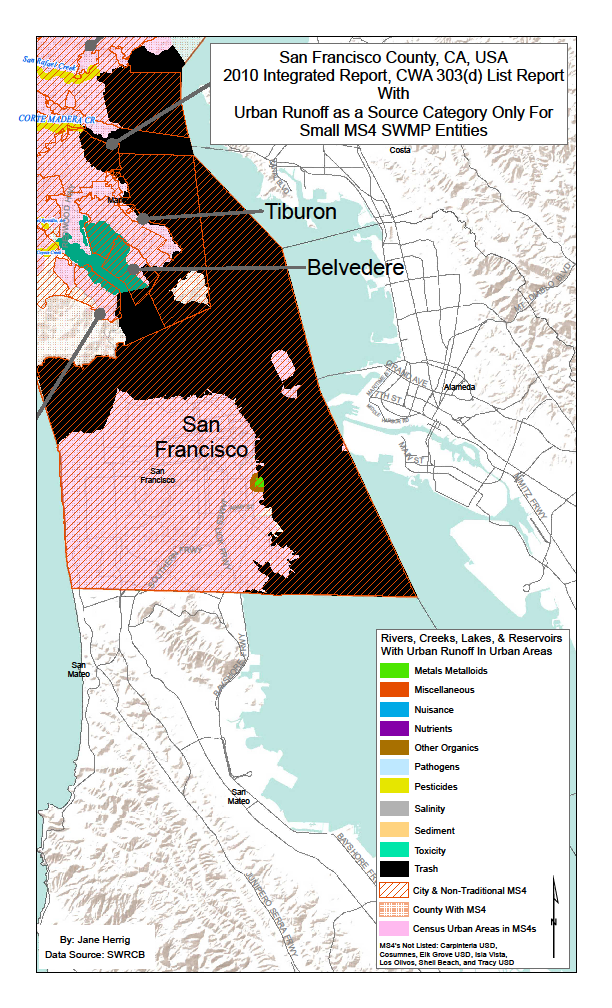
The symbology levels used were highly complex and took up most of my time to show the results of this report. The water segments polyline layer has up to eight different types of pollutant categories which means some water segments in California have up to eight different kinds of pollutants. The water bodies polygon layer has up to three different types of pollutants. Some water bodies were polluted with up to three different types of pollutants. This type of symbology assured that no one water body or segment had repeatable pollutant categories.
Analysis
Working with and understanding the data was successful and the hardest part about the analysis was using a computer those software requirements were minimal and created slow processing, crashes, and pure frustration for me, the GIS analyst. I believe displaying the large amounts of data for the entire state of California with 8 + layers of symbology was causing most of the slowdown and system crashes. My computer got 2 gb of RAM increase because the current RAM only met the minimum requirements for ArcMap 10. Unfortunately the increase in RAM only came about after I was finished with the project. Also due to the increase size of the symbology level of the water segments and water bodies the labeling for these features also increase the chances of the software crashing. I was using Maplex and often times none of the creeks names would appear. I spent hours trying to figure out how to find the perfect setting to allow Maplex to work to my advantage. I never got Maplex to work to my advantage.
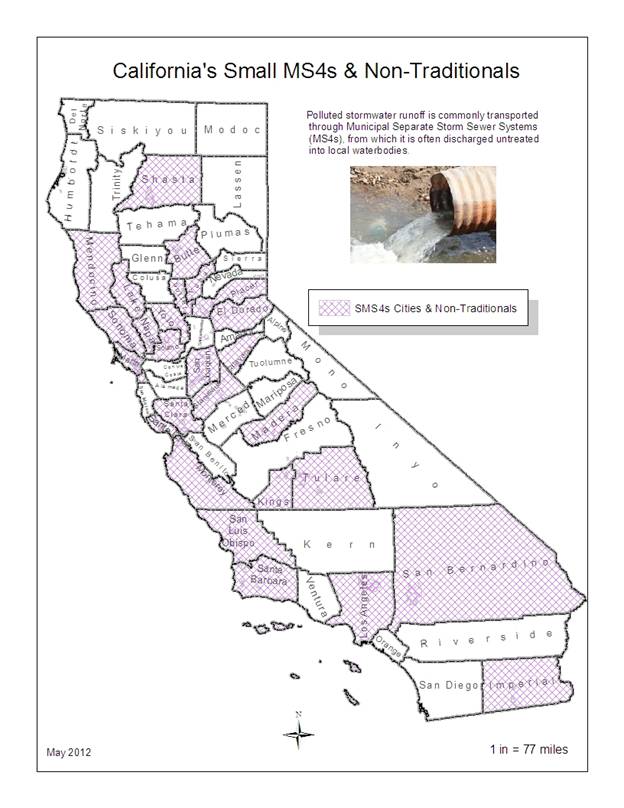
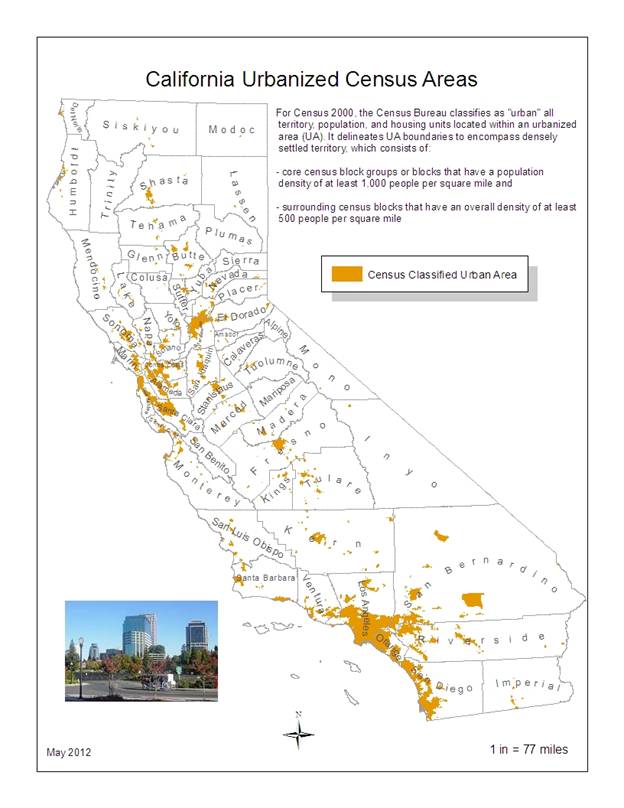
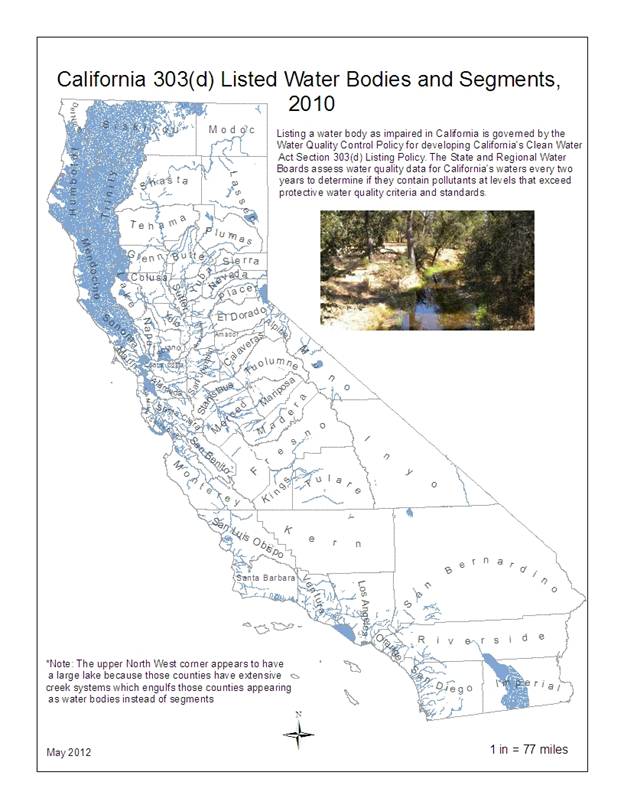
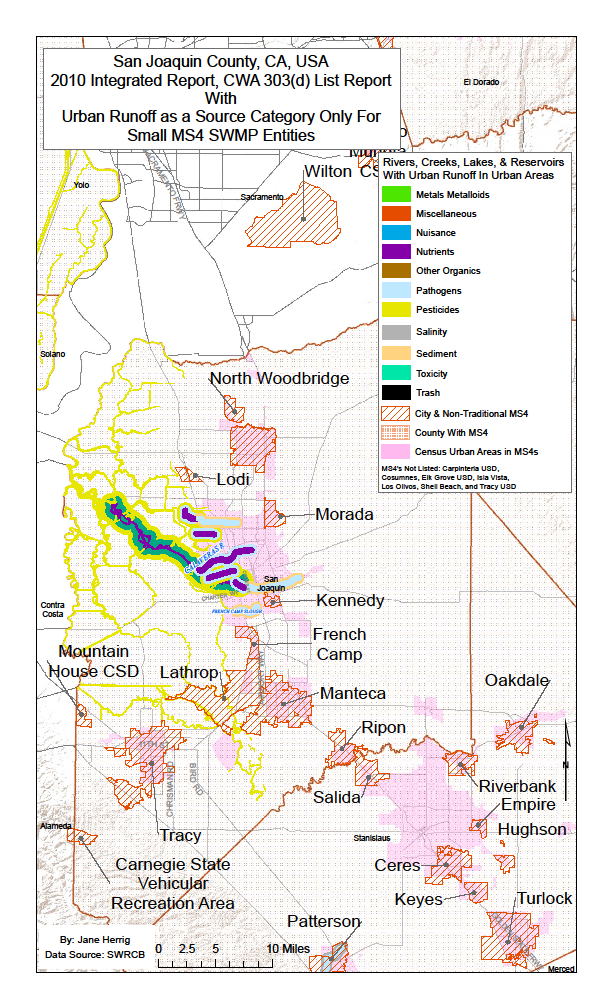
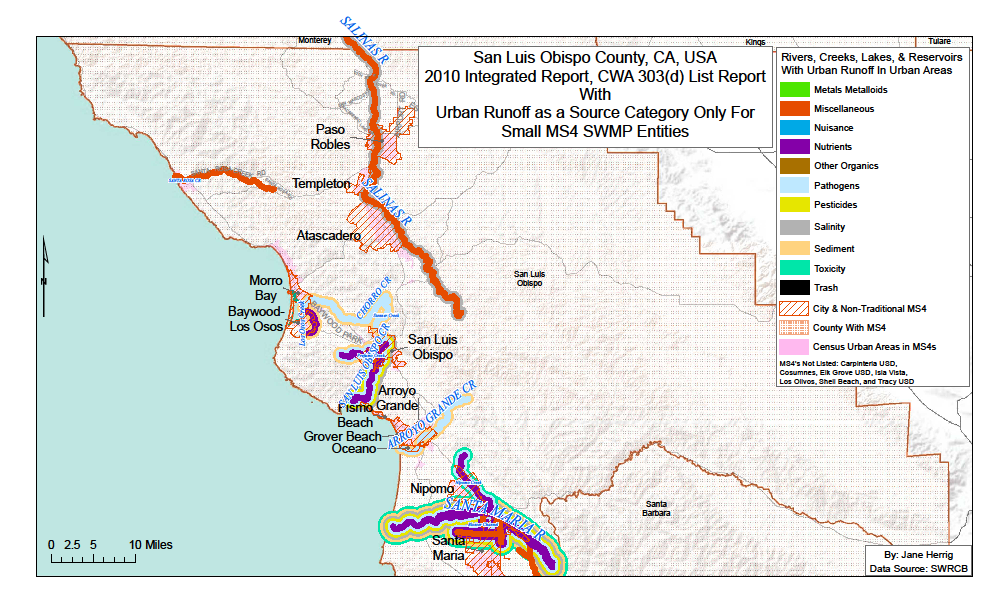
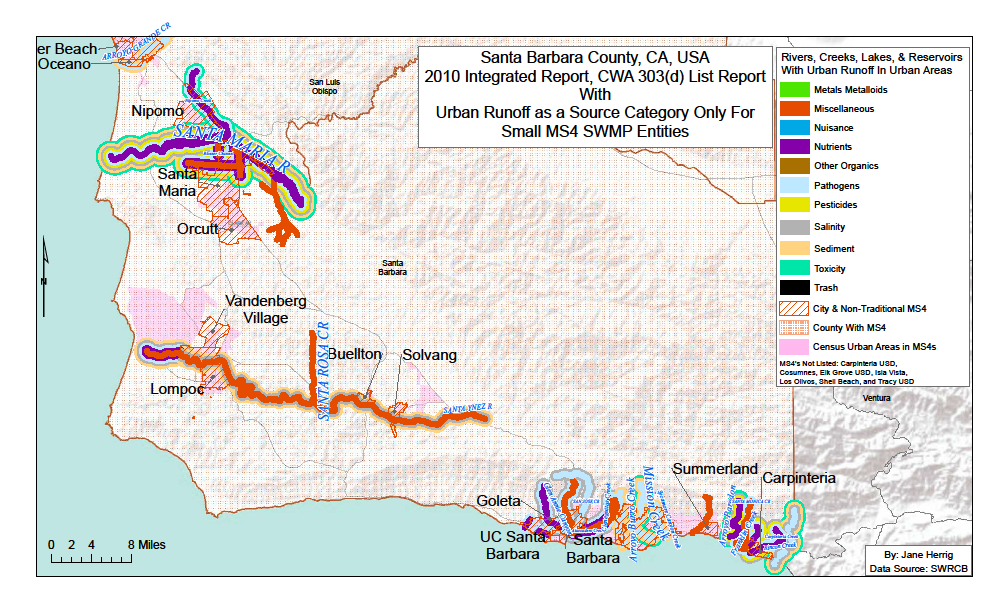
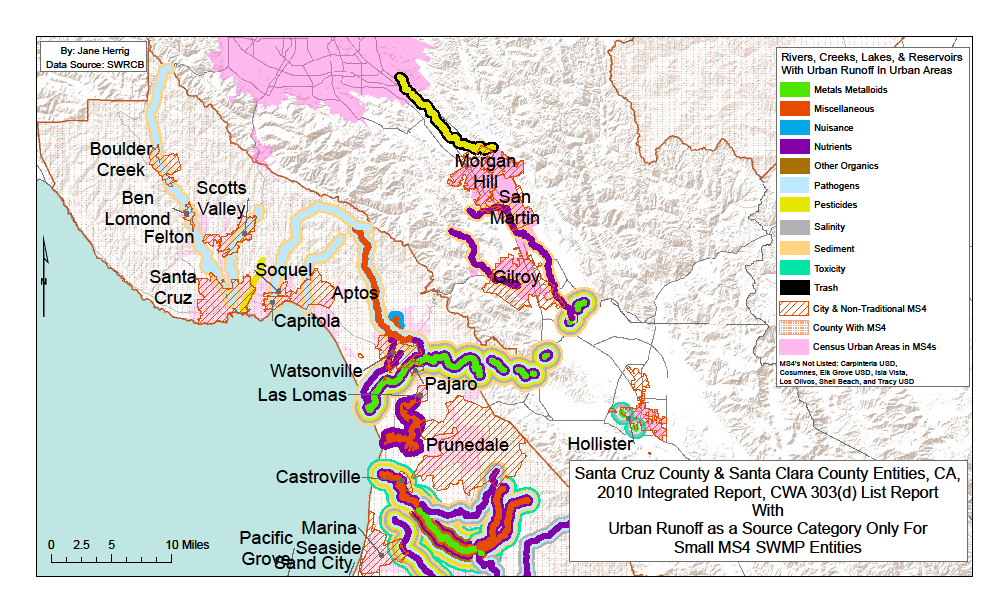
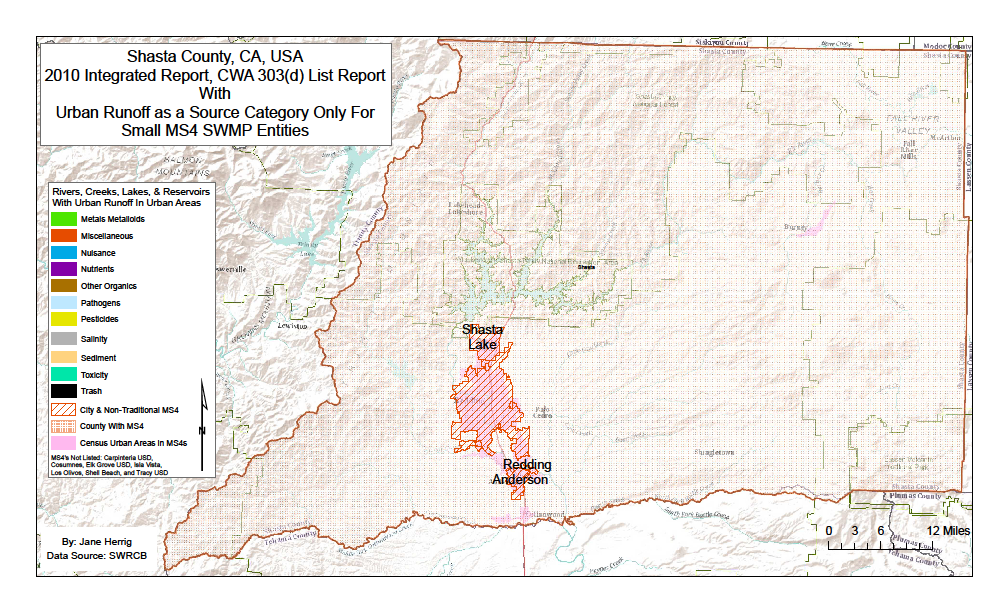
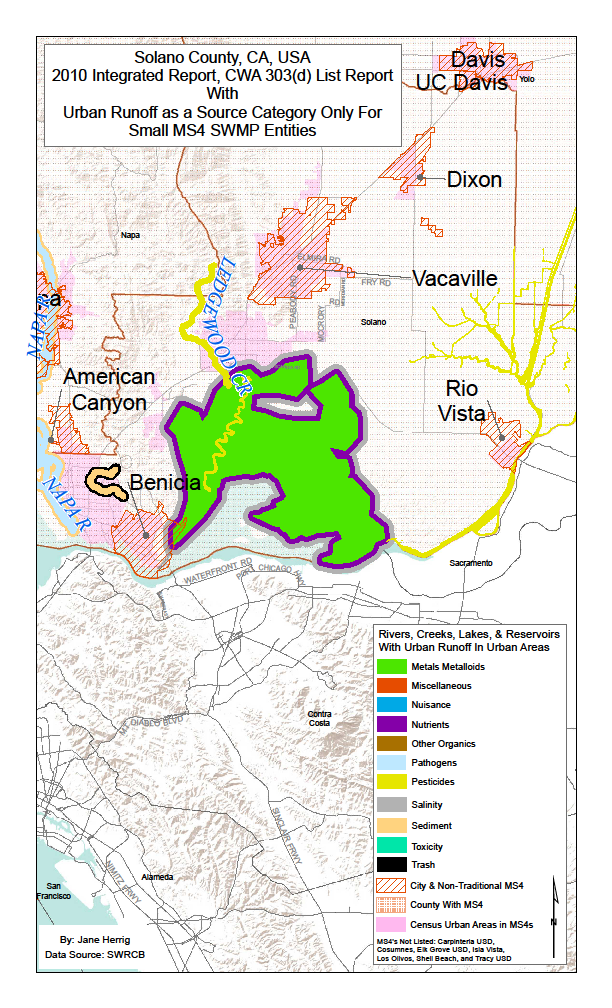
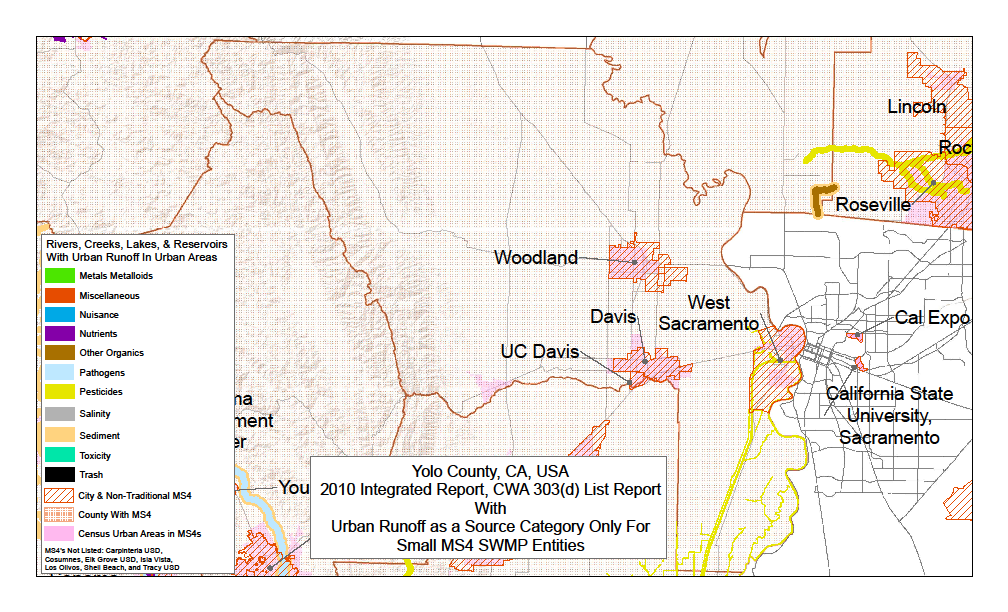
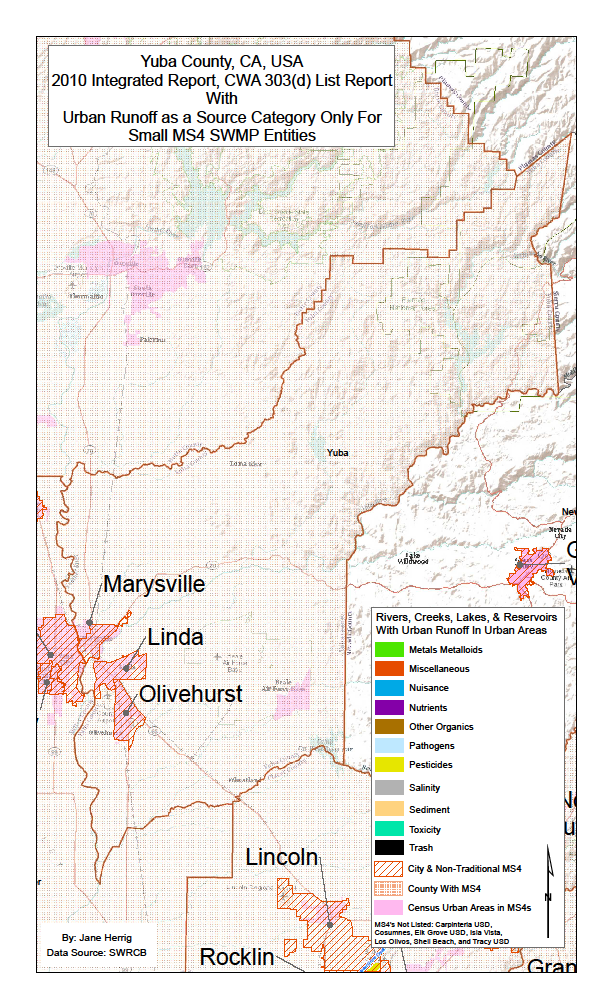
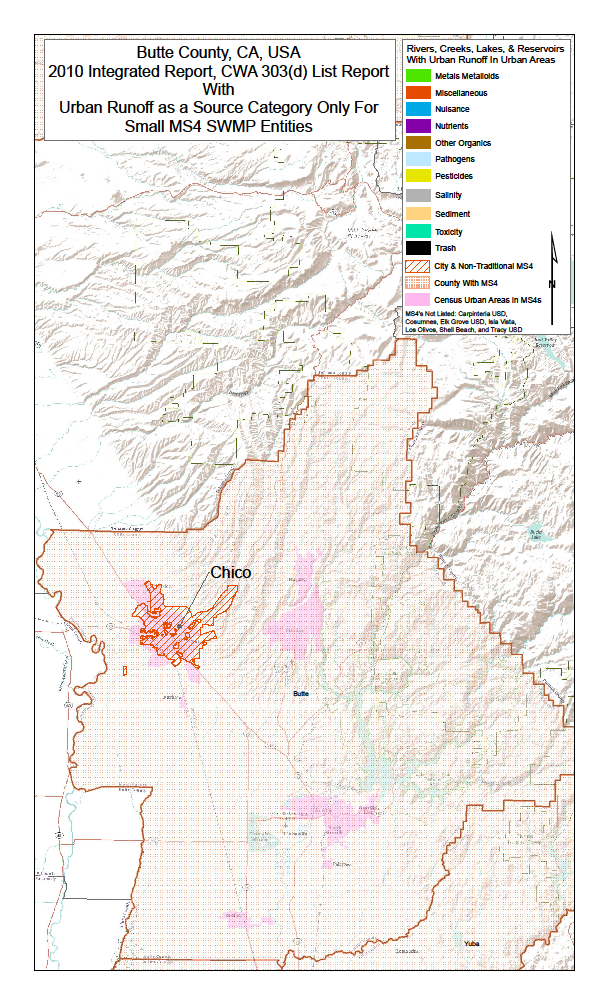
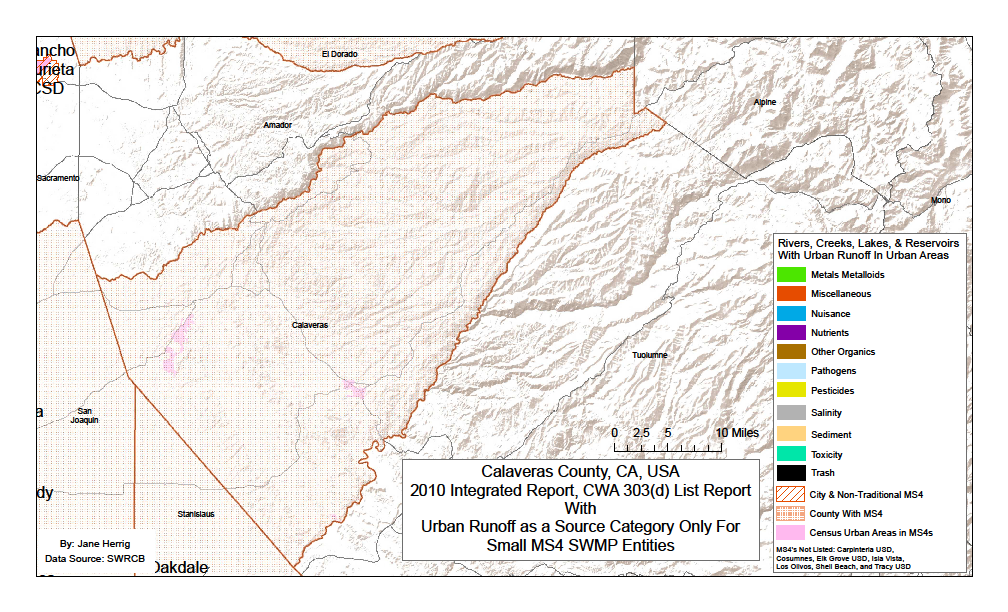
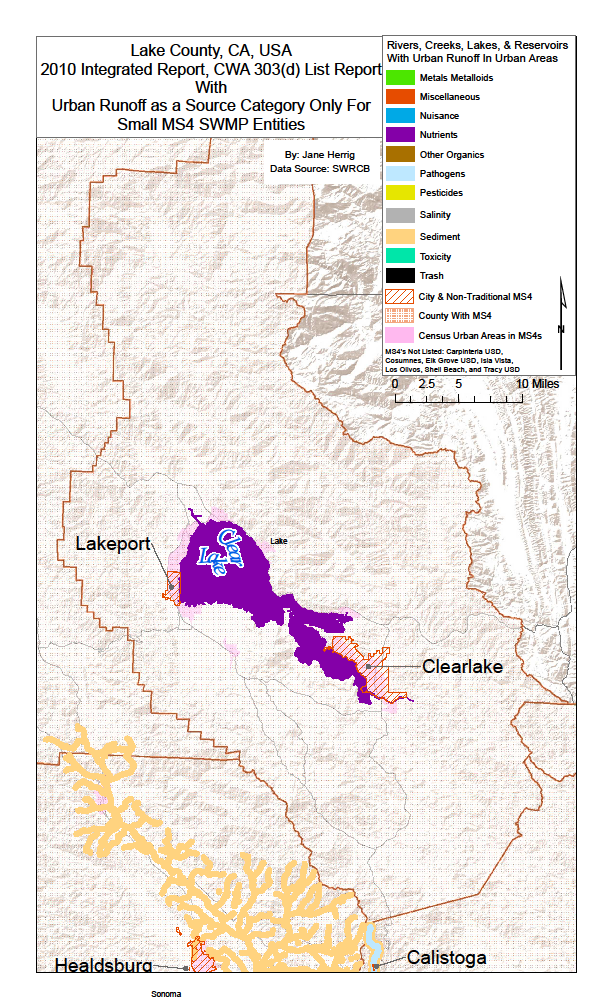
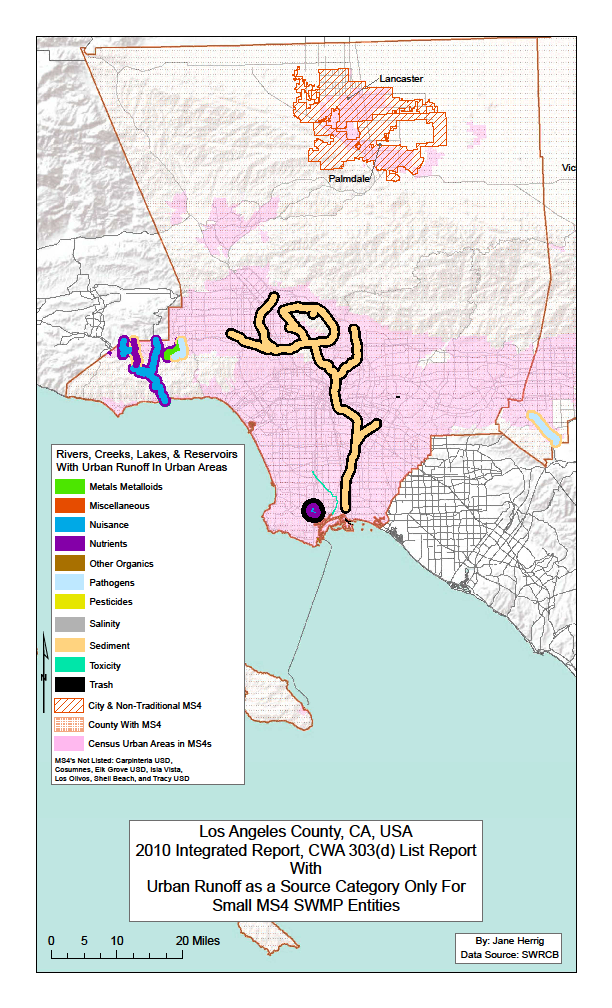
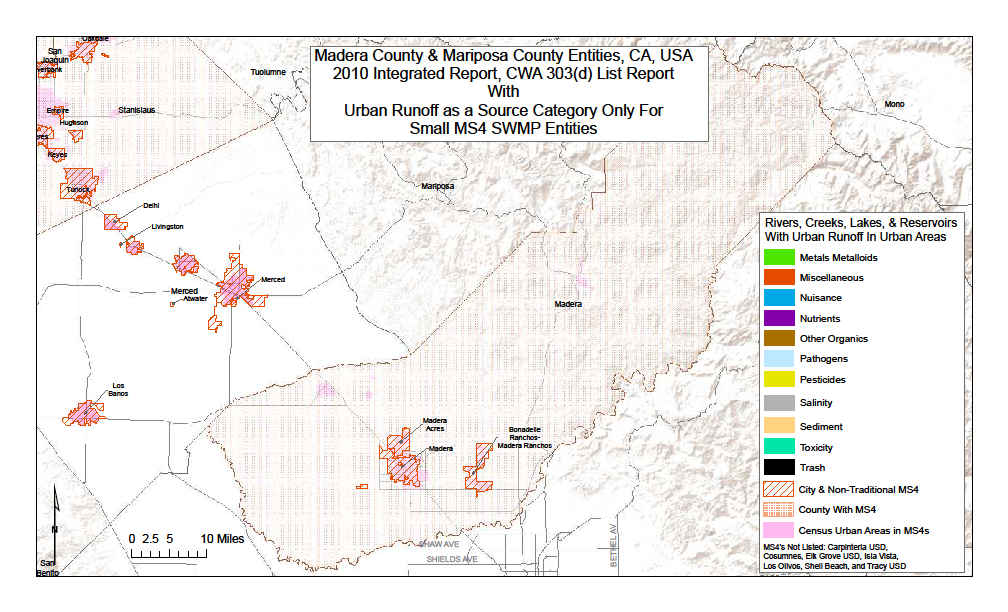
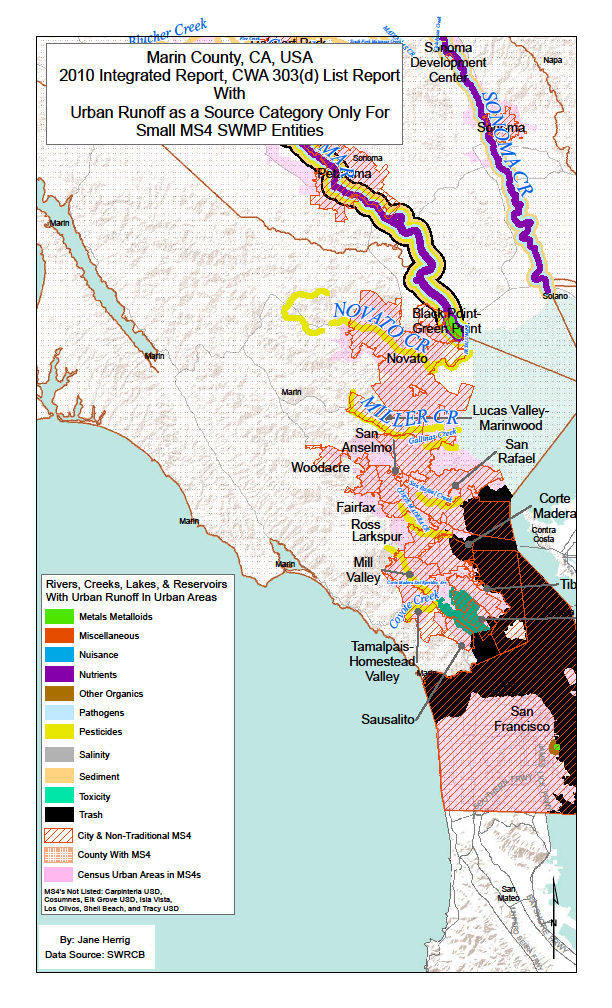
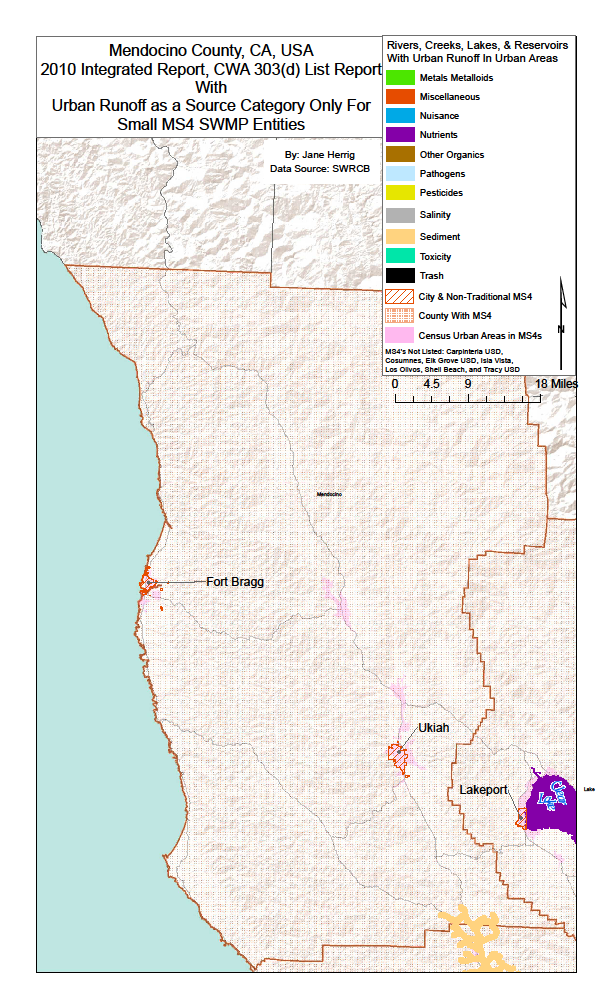
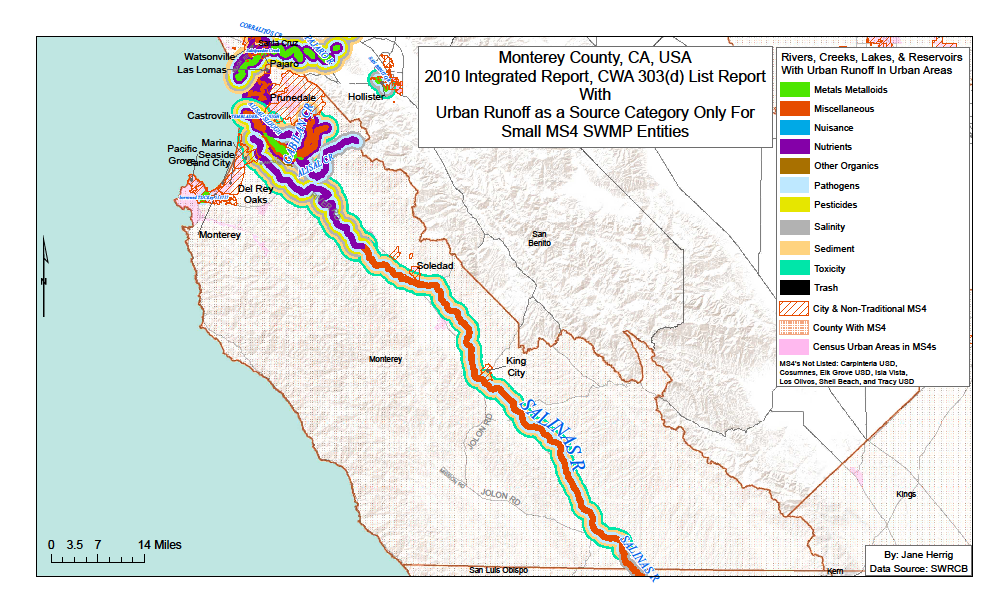
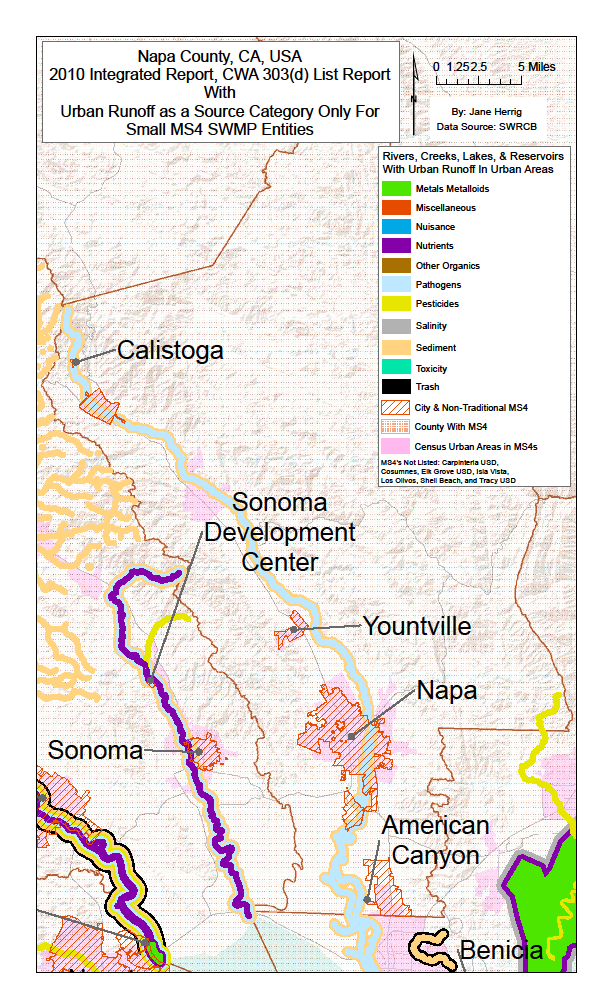
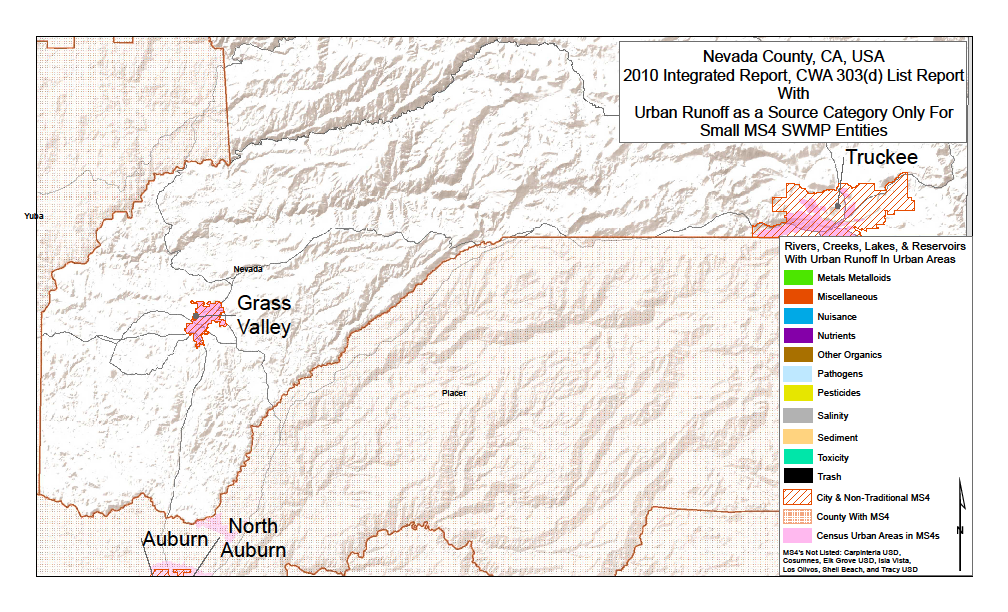
As shown below are individual maps of the analysis. Not all the California counties and cities are listed because those areas met the minimum requirement to have a small MS4 permit.
 Conclusions
The results were very successful and I thought the amount of impaired water bodies and water segments would have been throughout each Phase II Small MS4. However, 2010 integrated report only shows data for water bodies and water segments that have submitted data and while one third of the Phase IIs would not have to monitor it do not mean their water bodies and water segments are not impaired. Just merely the fact they have not been tested or the data for the water segments and bodies did not comply with standards. This analysis might actual serve as an analysis to point out which Small MS4’s will have to monitor and submit water quality data on their water bodies and segments. For example Grass Valley and Truckee have NPDES permits for MS4s but do not have any impaired water bodies from urban runoff. This is either because they have no water bodies or segments in their city limits, the assessed water bodies and segments are not impaired from urban runoff, and/or the assessment on these water bodies and segments were not analyzed for urban pollution runoff but for other pollution categories. This analysis also points out which Small MS4’s will be heavily burden from the results of the new permit should the Water Boards decide to move this direction.
References
"Impaired Water Bodies." State Water Resources Control Board. Water Boards, 11 Jan. 2011. Web. 02 May 2012. <http://www.waterboards.ca.gov/water_issues/programs/tmdl/integrated2010.shtml>.
"Monitoring, Assessment and TMDLs." EPA. Environmental Protection Agency, 11 Oct. 2011. Web. 02 May 2012. <http://www.epa.gov/region09/water/tmdl/california.html>.
"Contact EPA Pacific Southwest." EPA. Environmental Protection Agency, 21 Mar. 2012. Web. 02 May 2012. <http://www.epa.gov/region9/mediacenter/impaired-waters/>.
"Summary of California’s 303(d) Listing Pollutant Trends." EPA. Environmental Protection Agency, 11 Oct. 2011. Web. 02 May 2012. <http://www.epa.gov/region9/mediacenter/impaired-waters/trends.html>.
"OEHHA Fish Health Advisory And Safe Eating Guidelines For Fish From Folsom Lake And Lake Natoma (Sacramento, El Dorado And Placer Counties)." OEHHA. OEHHA, 23 June 2011. Web. 02 May 2012. <http://www.oehha.ca.gov/fish/so_cal/folnat101108.html>.