Title
Earthshaking Vibrations
Author Information
Luisa Studen
American River College, Geography 350: Data Acquisition in GIS; Spring 2012
Contact Information (email: luisafmaria@yahoo.com)
Abstract
The goal of this project was to spatially locate historical California earthquake epicenters of magnitude greater than 6.5. This criteria was
chosen based on research on the destructive effects of historic earthquakes with such magnitude. The first step in the development of this
project was to obtain a table with a list of California historical earthquakes that included some type of spatial reference, x,y location of each
epicenter, either in geographic or projected coordinates. This step proved to be the most challenging, since most of the data reviewed would either
provide the names of the cities or towns where the epicenter occurred or only the date and name of the earthquake. The California Geological Survey
was the only source, to my knowldege, that has ever published such a compilation of California historical data in tabular format accessible to the
public. The second step of the project was to convert the data in tabular format into spatial Geographic Information Systems data. This process
was accomplished by adding the geographic coordinates from the tabular format as x, y data to an ArcGIS Desktop 10 ArcMap document. The resulting
layer created by this process was an event layer that needed to be exported as a point shapefile. The newly created point shapefile was given the
WGS84 geographic coordinate system. Then, with the use of the "Project" tool in ArcToolbox, the newly created shapefile was projected to a UTM NAD83
Zone 10 coordinate system. The features represented in this point shapefile are the historical earthquake epicenters of earthquakes with magnitude
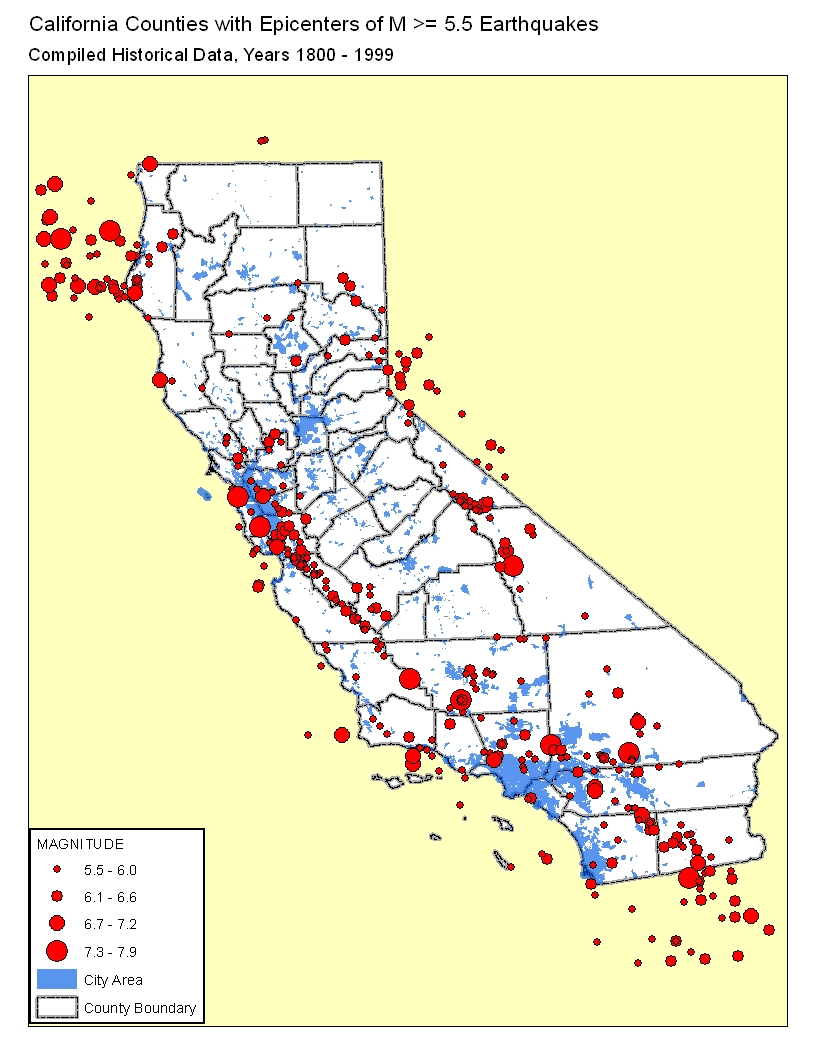
greater than 5.5. A map document that visually displays the spatial location of these features is shown below in Figure 6. Since the goal of this
project was to spatially locate historical California earthquake epicenters of magnitude greater than 6.5, the next step was to perform a query
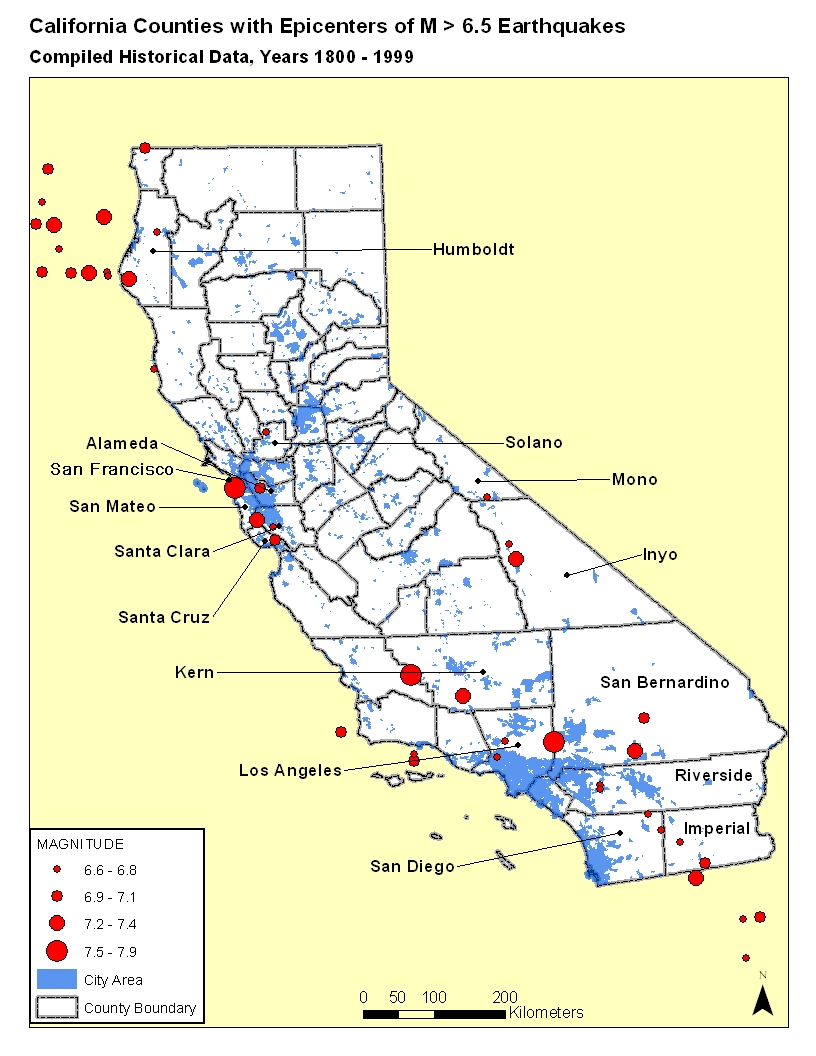
statement that would only display the records meeting this criteria. The subsequent map, shown below in Figure 7, visually displays the desired
records, namely, all the historical California earthquake epicenters of magnitude greater than 6.5 since 1800. Figure 7 also illustrates the
California counties that have historically been impacted by this type of destructive natural hazard.
Introduction
"California, on the average, has experienced one magnitude 6 or greater earthquake each year since 1850", according to the California Geological Survey.
The California Geological Survey has compiled 200 years-worth of historical earthquake data into a list of earthquakes of magnitude 5.5 and greater.
The list includes latitude and longitude locations for each of the earthquake epicenters, as well as the magnitude of each earthquake.
The earthquakes represent potentially damaging earthquakes that have occurred throughout California since 1800.
The purpose of this project is to determine the geographic location of California historical earthquake epicenters with a magnitude greater than 6.5, and
visually display this information on a map. The California historical list of earthquake epicenters was essential to the development of this projects since
it provided the date and location for each historical epicenter. The location of each epicenter was given in geographic coordinates, latitude and longitude,
which along with the date, were unique to each epicenter location.
Background
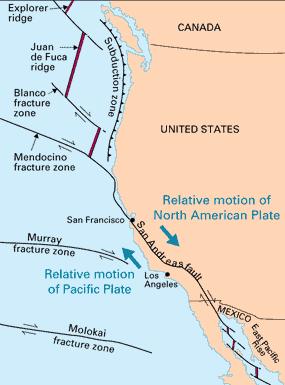
California lies on top of two tectonic plates, the North American Plate and the Pacific Plate. The two plates are separated by a transform fault, known as
the San Andreas fault. A fault or fault plane is the place where two tectonic plates slip.
The Pacific plate is moving north relative to the North American Plate, as shown in Figure 1.
Figure 1
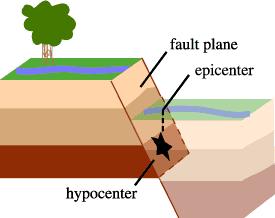
Because the fault is not smooth the plates sometimes can get locked in place in certain areas. This will cause pressure to build up as the plates
continue to attempt their opposite but continuous motion. When the pressure becomes to large, the rockmass where the plates were locked, ruptures and
a large amount of energy is released as seismic waves causing earthquakes. The location below the earth's surface where the earthquake starts is called the
hypocenter, and the location directly above it on the surface of the earth is called the epicenter. Figure 2 below, shows a diagram depicting a fault plane,
the hypocenter, and the epicenter of an earthquake.
Figure 2
Because California is located in a highly tectonic area of the earth, and the tectonic plates will keep moving past each other, California will continue
to experience shockwaves, some of them potentially as destructive as the ones that caused the 1906 San Francisco earthquake and others as devastating as
the ones that shook the Santa Cruz mountains during the Loma Prieta earthquake of 1989. Both of these earthquakes resulted from seismic waves with
magnitudes greater than 6.5. The lifethreatening and detrimental real estate consequences of such dreaded natural hazard were the motivation that led me
to choose this topic as a final project for this class.
Historical Event: Loma Prieta Earthquake, 1989
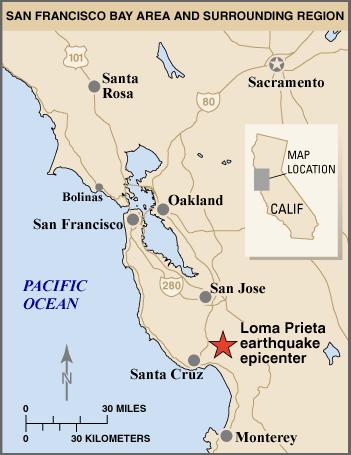
"Minutes before the scheduled start of the third game of the 1989 World Series in San Franciso, a magnitude 6.9 earthquake rocked the California coast
from Monterey to San Francisco", U.S. Geological Survey Fact Sheet, 151-99. Figure 3 below shows the San Francisco Bay Area and Surrounding Region
affected by the Loma Prieta earthquake.
Figure 3
The Loma Prieta earthquake is the most recent example of a magnitude greater than 6.5 California earthquake. It killed 63 people and caused an estimated
$6 billion to $10 billion in property loss, as reported by the U.S. Geological Survey.
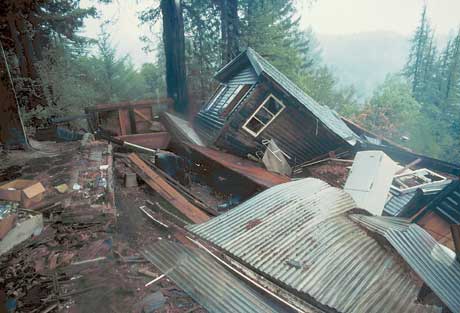
The image below, Figure 4, shows a house located in the mountains of Santa Cruz destroyed by the Loma Prieta earthquake.
Figure 4
"The year after the 1989 Loma Prieta shock, a panel of scientist have reassessed the earthquake threat to the San Francisco Bay region.
Their conclusions were published in the USGS report "Probability of Large Earthquakes in the San Francisco Bay Region, California."
They projected 2-in-3 odds for one or more destructive earthquakes (magnitude 7 or larger) to strike the Bay region in the period
1999 to 2020", U.S. Geological Survey Fact Sheet, 151-99.
Methods
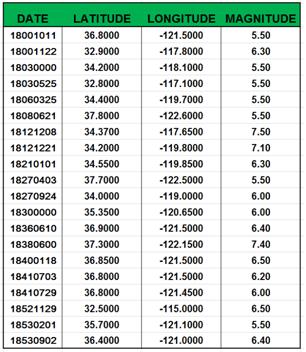
A variety of data sources were visited during the research stage of this project, however, the most valuable source of information was the
California Geological Survey. As discussed in the Introduction section of this document, the California Geological Survey has compiled 200 years-worth of
historical earthquake data into a list of earthquakes of magnitude 5.5 and greater.
A small section of the entire California historical list of earthquake epicenters is shown below in Figure 5.
The link to the complete list of historical earthquakes can be found in the References section at the end of this document.
Figure 5
The published list was copied and pasted into a Microsoft Excel document and then further processed into a user-friendly and workable spreadsheet. The
geographic coordinates were added to an ArcGIS Desktop 10 Arcmap document as an event layer and then exported as a point shapefile with the geographic
coordinates system of WGS84. With the use of the Project tool, the point shapefile was projected to a UTM NAD83 Zone 10 coordinate system. Once the point
shapefile was projected, it was added to a new map document along with two other layers, a California county layer, and a City areas layer. The features
represented in the point shapefile are earthquake epicenters of all historical earthquakes since 1800 with magnitude 5.5 and greater. Since my interest
in this project was to determine the geographic location of earthquake epicenters of all historical earthquakes since 1800 with magnitude greater than 6.5,
it was necessary to perform a query statement that would visually display the desired epicenters.
Results
Figure 6 shows an image of an ArcMap document displaying earthquake epicenters of all historical earthquakes of magnitude 5.5 and greater.
Figure 6
Figure 7 shows an image of an ArcMap document displaying earthquake epicenters of historical earthquakes of magnitude greater than 6.5.
Figure 7
Analysis
Figure 7 shows an image of an ArcMap document displaying earthquake epicenters of historical earthquakes of magnitude greater than 6.5.
There are 14 California counties that have historically been affected by earthquakes of magnitude greater than 6.5. These counties are Alameda,
Humbolt, Imperial, Kern, Los Angeles, Mono, Riverside, San Bernardino, Santa Clara, Santa Cruz, San Francisco, San Mateo, San Diego, and
Solano. The most time consuming portion of the project was finding the source of data that would provide me with a list of historical earthquake epicenters
with their corresponding geographic coordinates which would allow me to convert the tabular data into spatial GIS data.
Conclusion
Earthquakes with a magnitude greater than 6.5 are likely to strike California again in the near future. Figure 7 shows the geographic location
of historic epicenters of California earthquakes of magnitude greater than 6.5. The map also shows the California counties impacted by the earthquakes
and the proximity of city areas to the earthquake epicenters. With all the intense on-going scientific research, the historical data of tectonic
activity in California, and the awareness of the life threatening consequences of an earthquake of greater than 6.5 magnitude, why is it that
so many Californians still live in the most earthquake prone areas of California?
References
1. "California County Boundaries". CAL-ATLAS Geospatial Clearinghouse.
http://atlas.ca.gov/download.html#/casil/boundaries
2. "California Geological Survey - Regional Geologic Mapping Program". State of California Department of Conservation.
http://www.conservation.ca.gov/cgs/rghm/quakes/Pages/MS49.aspx
3. "California Places". U.S. Census Bureau.
http://www.census.gov/cgi-bin/geo/shapefiles2010/main
4. "Progress Toward a Safer Future Since the 1989 Loma Prieta Earthquake". U.S. Geological Survey.
http://pubs.usgs.gov/fs/1999/fs151-99/
5. "Significant California Earthquakes". California Geological Survey.
http://www.conservation.ca.gov/cgs/rghm/quakes/Pages/eq_chron.aspx