|
Title Food & Entertainment
http://www.carlajgardiner.com/build-business-sacramento-horse-buggy-social-media/10 |
|||||||||||||||||||||||||||||
|
Author
5146 Arnold Ave, McClellan Center, CA 95652, frawled@imail.losrios.edu |
|||||||||||||||||||||||||||||
|
Abstract ArcGIS is a very powerful mapping tool alone, but when paired with free online applications such as Google Earth, map a list, and Zonum Solutions, it makes cartography exponentially more fun. The purpose of this project is to display and document the acquisition of GIS data that can be incorporated with web applications and ESRI ArcGIS software. The power to persuade others is paramount, and when you’re traveling quick decisions are necessary. Continue reading along down the page and you can learn how to become a cartographer or just appreciate the simplicity and power of maps. I will display how and why I fabricated a map emphasizing the “Hot Spots” for food and entertainment in Old Town Sacramento. By using a quick online geocoder, I can create a project specific map which can further be analyzed by bringing in to GIS printing out a map, and/or sharing online. |
|||||||||||||||||||||||||||||
|
Introduction
The free internet tools I chose are to pair with the very powerful yet expensive ESRI product,. |
|||||||||||||||||||||||||||||
|
Background
|
|||||||||||||||||||||||||||||
|
|
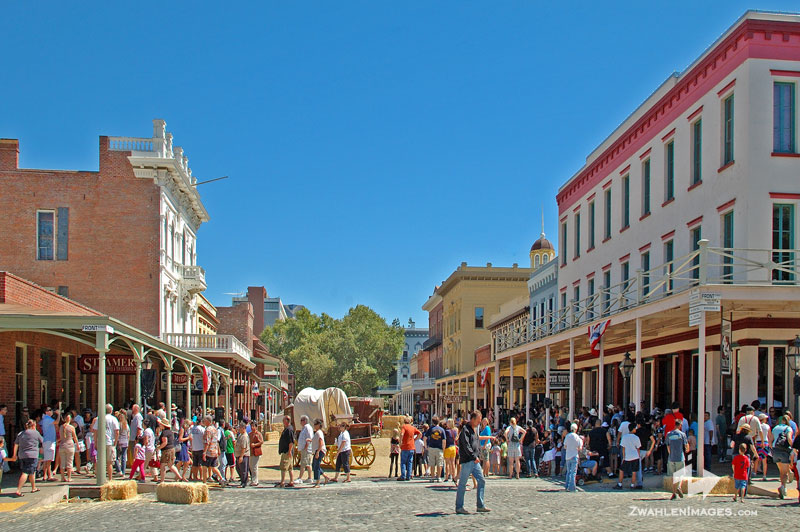
Pictured Left: 37th Annual Music Festival Main stage 2010
Pictured Left: 2010 Gold Rush Days facing East on Front St. & K St.
|
||||||||||||||||||||||||||||
|
Methods
|
|||||||||||||||||||||||||||||
|
|
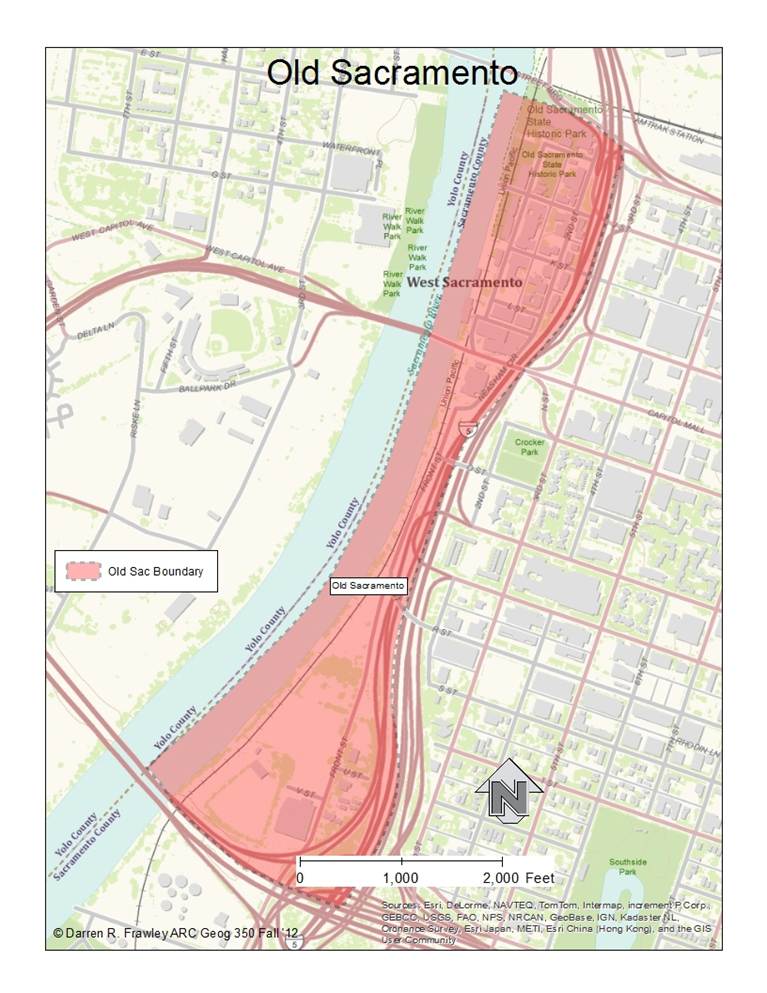
I scoured the internet looking for useful. Information and began with downloading data from the City and County of Sacramento government GIS websites. With a neighborhood shape file acquired from the City, I extracted the Old Sacramento neighborhood by performing the Clip Geoprocessing tool.
With a ArcGIS online I added a streets base map for stylizing effects (Pictured Left).
Then I compiled data to format into a Google Docs Spreadsheet that synchs with map a list to visualize my address so I could get wild with the data.
|
||||||||||||||||||||||||||||
|
Results This section contains the presentation of actual data, explanation of format used and why a particular format was selected. |
|||||||||||||||||||||||||||||
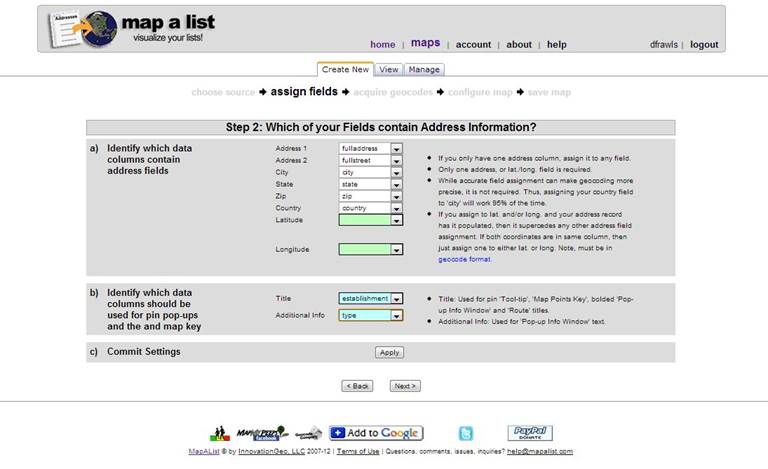
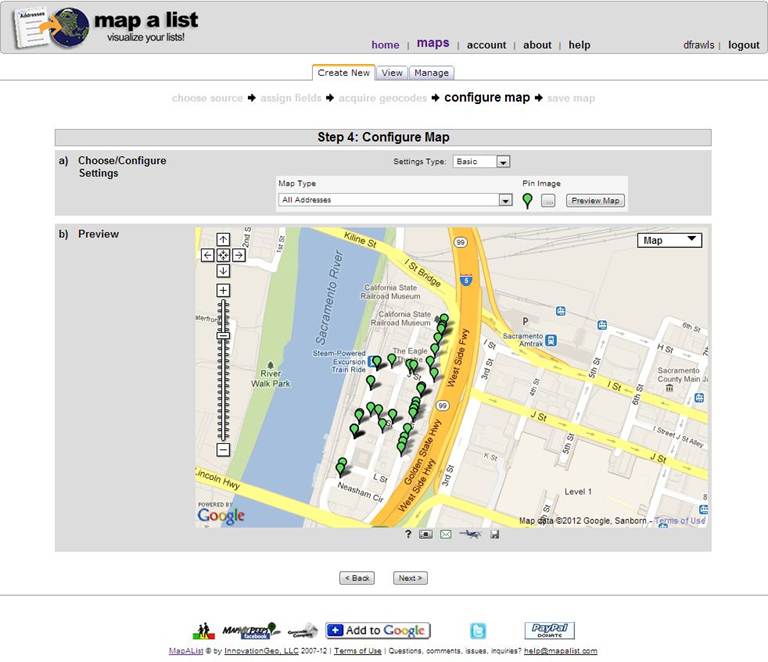
With the table information above map a list can import the information in 3 simple steps to create points on a map.
When the addresses are acquired, a map is produced like the one below.
|
Pictured Left: A Sample table of information used to: 1st geocode addresses using map a list. 2nd Save points as .KMZ file 3rd convert .kmz file to .shp file so that geoprocessing and spatial analysis is possible 4th import .shp file to ArcMap and perform spatial analysis.
|
||||||||||||||||||||||||||||
|
Figures and Maps |
|||||||||||||||||||||||||||||
|
|
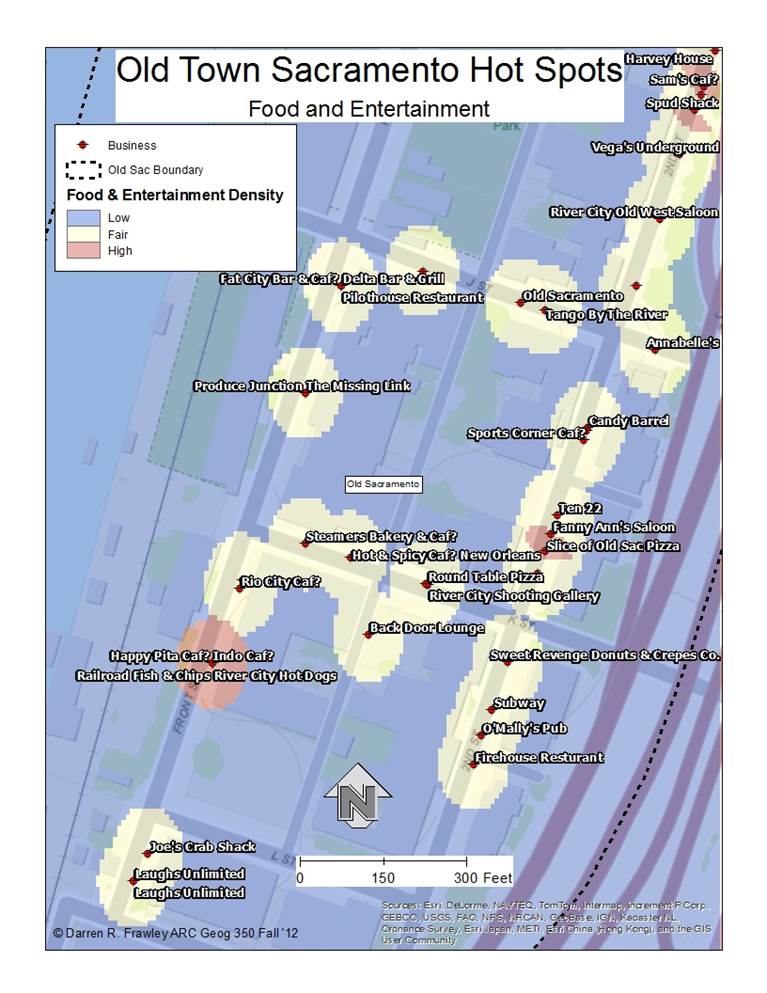
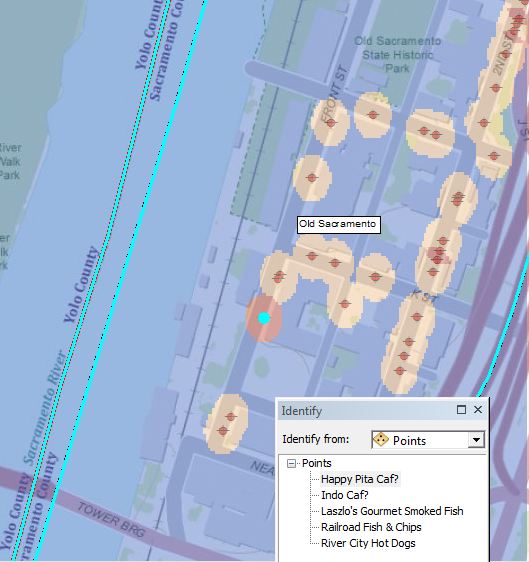
Left: After importing the shape file created using Zonum Solutions, I used the Spatial Analyst Point Density Tool to produce this Hot Spots map in ArcMap.
By Identifying a point the user map attain information on any particular spot on the map. As seen to the left. |
||||||||||||||||||||||||||||
|
Analysis According to my map without looking through a long list of address’ I one can easily pic out where the most probable spot to take a group to eat and entertain themselves because of the density of options to select from at a central location. With the information recorded in the tables, ArcMap can run query’s to select specific types of establishments. With the addition of more input data the possibilities of making a more useful map to address specific questions is endless. However, for the purpose of this project, I achieved the primary goal I was looking for.
One problem I encountered was choosing how to record the field data because map a list can only geocode the address with the specific context as depicted in the Results section table above. Before inputting my data, I should have researched further into the map a list website to save data entry time by doing it right the first time around. In addition, I noticed that the attributes of my mapalist .kml file did not transfer over completely so some data scrubbing/editing was necessary to ensure proper attribute information exists for analysis purposes. Perhaps this is a problem that I can solve in the future for this was my first using such an application. |
|||||||||||||||||||||||||||||
|
Conclusions When I initially began this project I thought of using an ArcGIS Address Geocoder and street centerlines data but I did not get a 100% match of what I was looking for. Thus, I worked around this hurdle by discovering map a list which coincidently pairs with Google Earth well, allows one to further explore spatial data. Despite minor complications with the free mapping applications, this experience has been 100% satisfying.
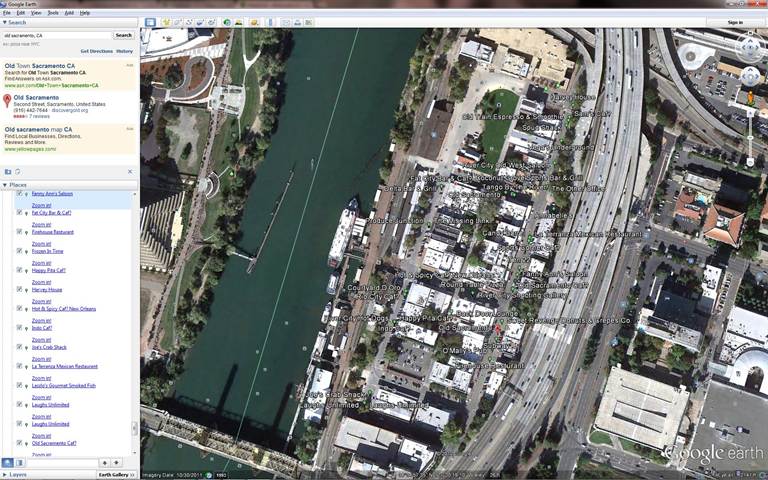
The points generated in map a list can easily be imported into Google Earth which enables the user to see Map/Satellite imagery, traffic, transit, and bicycling data; along with Wikipedia links and user submitted photos of locations.
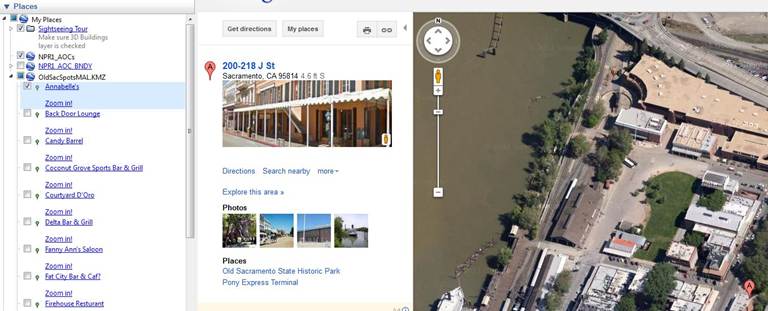
I was even astonished with my diversity of different levels of detail that I could acquire from my data because with such a powerful tool as Google Earth, the points I created can be zoomed into view address location at the street level view as shown below.
|
|||||||||||||||||||||||||||||
|
References History Sacramento http://www.sacramentogoldrushdays.com/sacramento-history/ |
|||||||||||||||||||||||||||||
|
Appendices Some of the data created in this project will be on display for the remainder of the year 2012 and until January 21, 2013 on Google Earth here. |
|||||||||||||||||||||||||||||
|
Links || index page || |
|||||||||||||||||||||||||||||