Comparison of Unsupervised & Supervised Image Classification on the Poleta Folds Region in Eastern California
Author Information
Amna Javed
American River College, Geography 350: Data Acquisition in GIS; Fall 2012
Abstract
During the Summer of 2011, I mapped the Poleta Folds that are located in the White-Inyo Mountains in Eastern California. The Poleta folds lies at the western edge of the Basin and Range Province and are composed of small parasitic folds of a larger scaleanticlinorium structure. These folds have been deformed by multiple generations of faulting. The primary rocks that compose these folds are carbonate rocks, quartize, and shales. Therefore for this project, I wanted to use remote sensing techniques for the classification of the different rock types. Due to limited resources, the method most appropriate for this study was to compare the unsupervised image classification to the supervised and see what image classification yields the best results. It was found that the supervised classification was a better fit to identify the multiple rocks layers.
Introduction
The purpose of this study is to use a field area that I have mapped in the past as a subject to indentify the different rock layers it is composed of by conducting an unsupervised and supervised image classification.
Background
The Poleta Folds are small parasitic folds of the general large scaleanticlinorium structure of the White-Inyo Mountains that have been deformed by multiple generation of faulting. The stratigraphic interpretation shows that the field area was a passive marine environment in the Lower to Middle Cambrian that allowed for deposition of the sedimentary rocks composing it. Faulting and Folding occurred from Middle Paleozoic to Late Cenozoic.A Geologic Map of the Poleta Folds region along with a geologic cross-section, air photo interpretation, and stereonet data of folds is used to determine the structural geologic history of the region. For the purpose of this study a Landsat-7 image of the area was acquired to run an unsupervised and supervised classification.
Methods
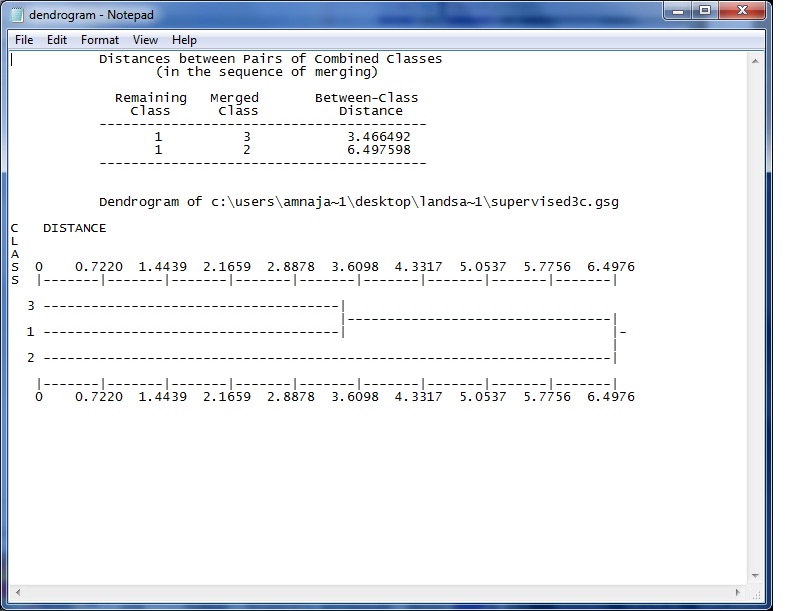
The first in step completing this project was to obtain a satellite image of the field area. I downloaded a Landsat-7 image from calatlas.org. After getting the image, I cropped it to a tiny study area that was mapped and used an image composite of bands 7, 4, 2 because this combination of bands illustrates bare soil most vividly. After preparing the study area, I first ran an unsupervised classification of ten and one hundred classes. The results yielded an image of only one signature file. This was not helpful to my study therefore I discarded the unsupervised image and focused my study on conducting a supervised classification. Because the resolution of image was not so great, I could only differentiate three different rock layers from my bare eyes. So I made a point feature class collecting ten sample sites from each rock layer class. I used the point feature class to run an ISO cluster and Maximum Likelihood Classification to yield a supervised image. After getting a supervised image, I wanted to analyze my results for accuracy so a dendrogram was created. It was found that layers one and three were more similar than layer two. Below are screenshots of some of the methods applied:
Image 1: Clipped Area of the Poleta Folds for Analysis

Image 2: Creating a Signature File from an ISO Cluster Tool in ArcMap
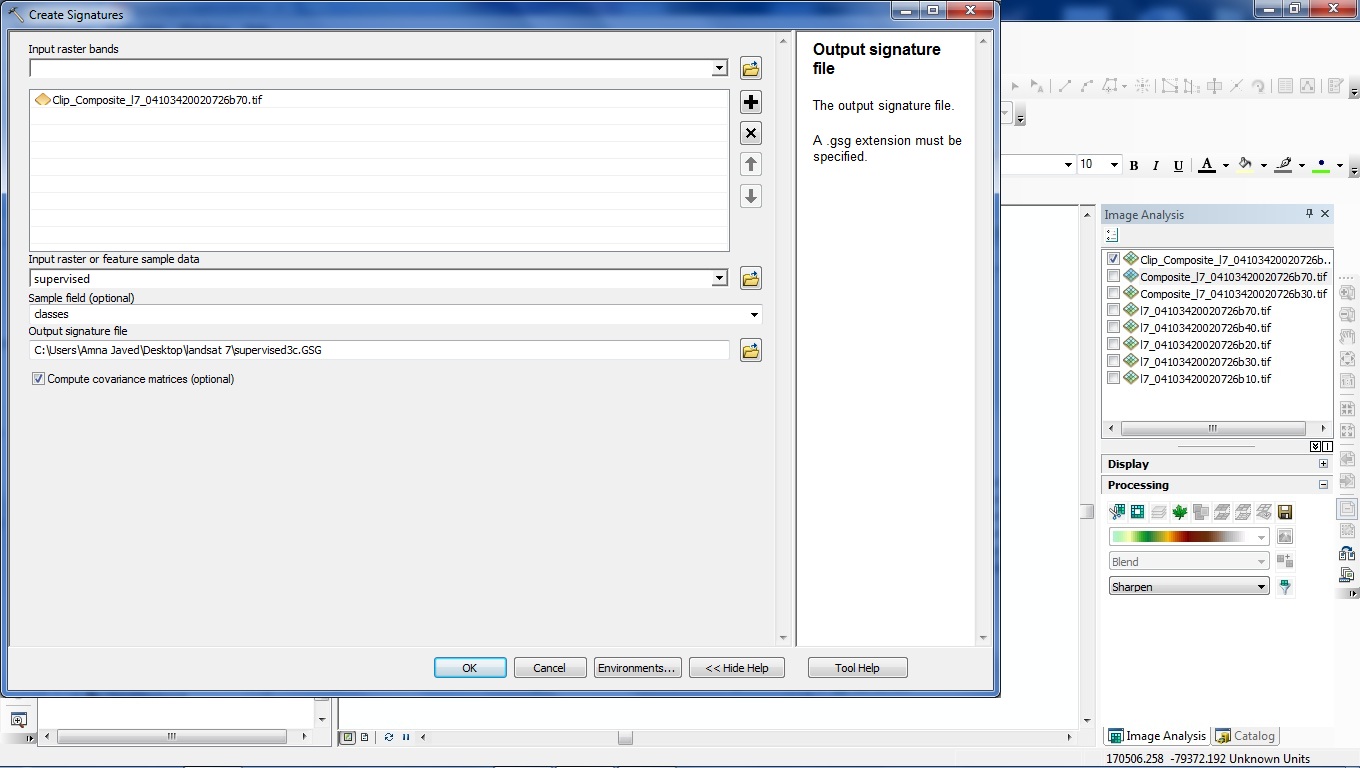
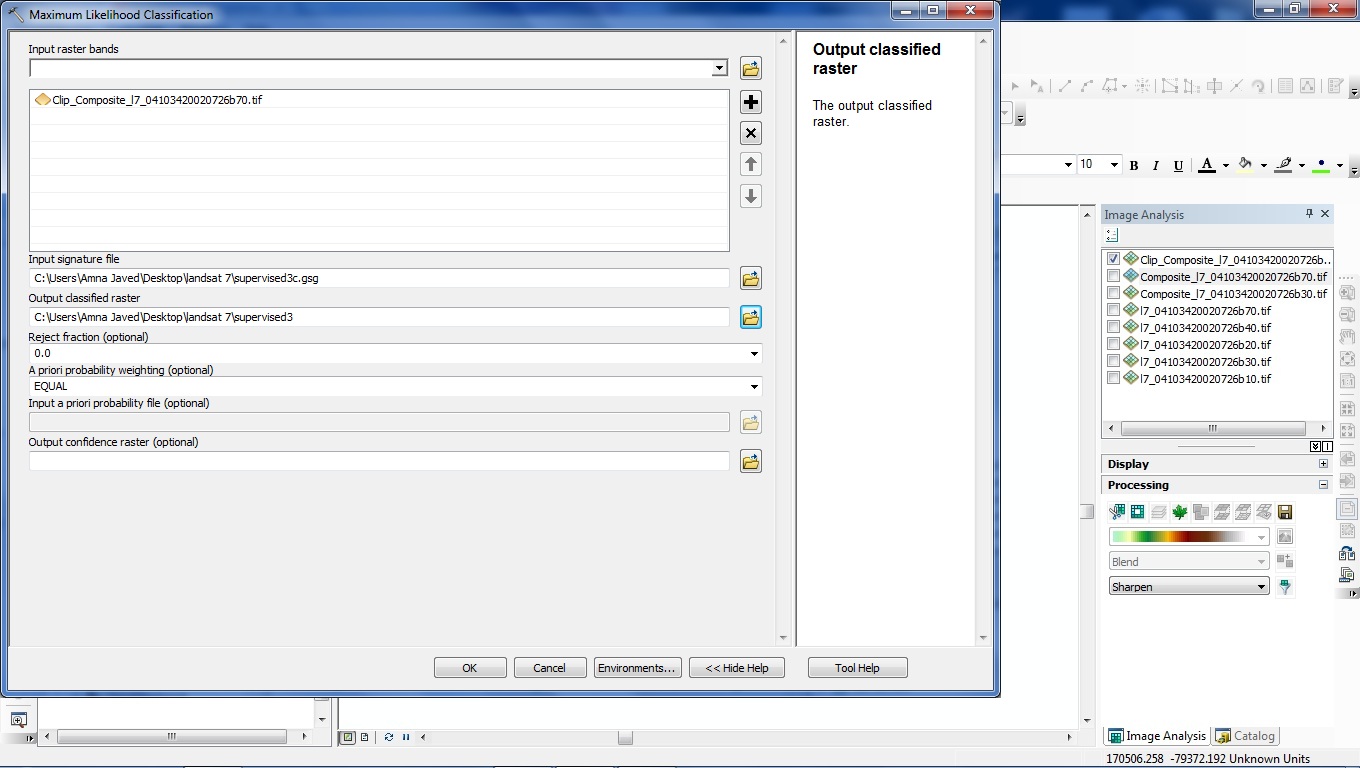
Image 3: Running a Maximum Likelihood Classification in ArcMap
Results
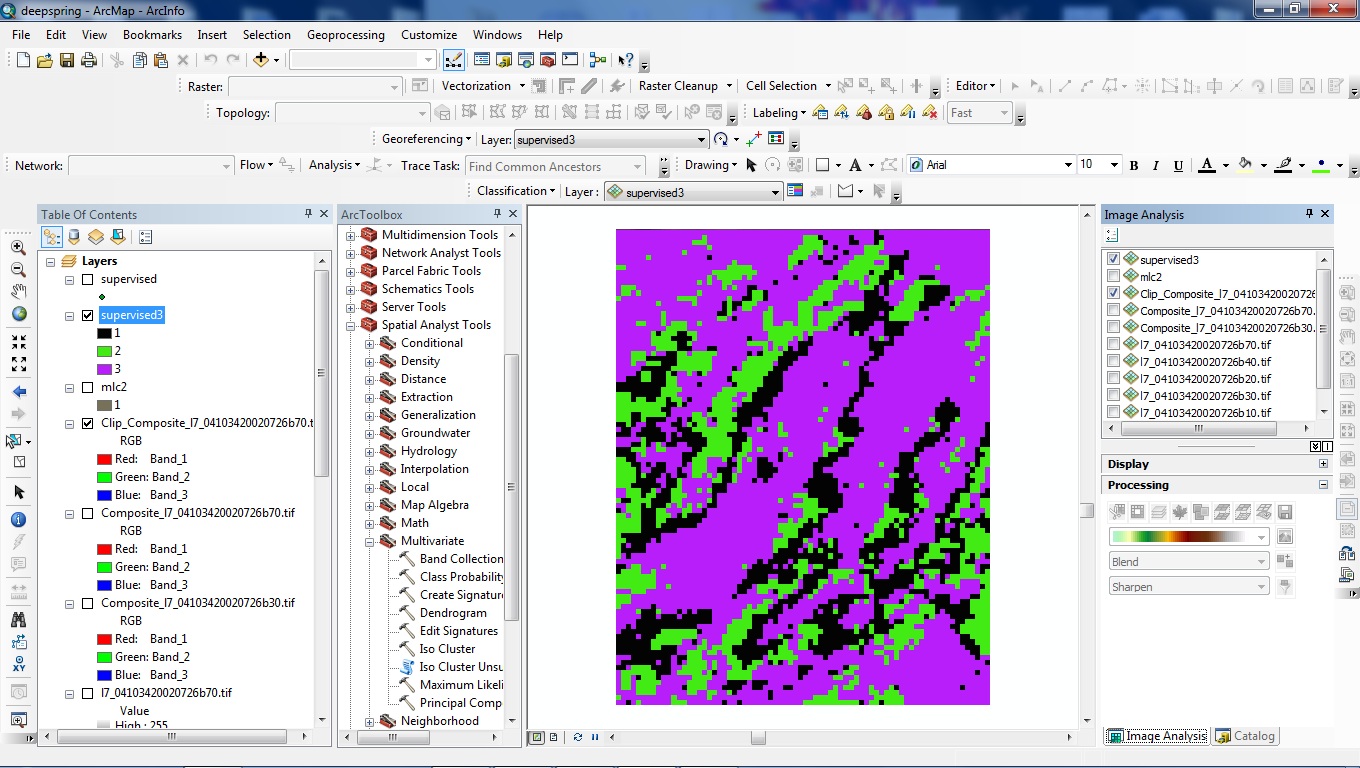
Below is an Image of the Supervised Image yielding three classes and a Dendrogram used for Analysis
Discussion of Difficulties
The biggest obstacle in this project that I had to overcome was the resolution of the primary landsat image. Because it was not crisp, it was very hard for me and the software to differentiate between the multiple different rock layers. Using more advanced remote sensing techniques such as applying a hyperspectral analysis can yield more detailed results.
Conclusion
Having prior knowledge of the geologic history of the Poleta Folds Region, I know that there are at least six different rock types but this project was only able to analyze three. A reason all six rock types could not be illustrated is for the poor resolution of the primary Landsat-7 image. The result that was obtained indicates three distinct rock types and by studying the dendrogram it is induced that rock layers three and one having similar signature characteristics than layers two. When observing from a geologic point of view it can be argued that layers two and one should be more similar since they share a contact and have been deposited right on top of each other. This point can be analyzed further and there could be numerous reasons as to why rock type three and one are similar. Having access to more advanced data can greatly aid further analysis of this area.
References
Roeske, Sarah, Geology 110B, An Introduction to the Geology of the White-Inyo Range and
Poleta Fold Belt of Eastern California.
http://zulu.ssc.nasa.gov/mrsid/tutorial/Landsat%20Tutorial-V1.html