Using GIS to Combat White-Nose Syndrome | |
Author InformationJasmyne ReadyeAmerican River College Geography 350: Data Acquisition in GIS Fall 2012 jhreadye@ucdavis.edu | |
AbstractWhite-Nose Syndrome (WNS) has become a widespread disease, originally found in New York, affecting rapidly increasing numbers of hibernating bat colonies. Since the discovery of WNS in 2006, nine hibernating bat species have been identified as having populations affected by the disease. Bat species are able to fill many environmental niches, which makes their continued persistence particularly invaluable, especially in agriculture. GIS analysis indicated that WNS is rapidly spreading south and southwest, as well as north and northwest. WNS occurrences are also becoming more densely clustered. Visual interpretation provided through the use of GIS maps enables conservation groups to more effectively convey the intensity of the issue when making proposals for grant funding or conservation support. | |
Introduction
White-Nose Syndrome (WNS) has become a widespread disease, originally found in New York, affecting rapidly increasing numbers of hibernating bat colonies. As its name suggests, this fungal disease is found on the noses and wings of bats and causes thinning of wing membranes, loss of fat reserves and starvation. The rate of spread and mortality has been alarming, spanning nine states in just six years, becoming a national concern. The effort to combat WNS requires knowledge of currently infected areas and the probable flight routes of the various infected bat species in order to predict future sites of infection via predicted routes of transmission. To accomplish this, Bat Conservation International (BCI) combined georeferencing band recapture and radio telemetry studies with Esri’s ArcGIS program to map out the current data along with the future predictions. Having a visual interpretation of the crises enables BCI to more effectively convey the intensity of the issue when making proposals for grant funding or conservation support (Wilson; Baylesss, 2009). | |
Background
Bats are the only mammals capable of true flight. More than 1,000 bat species exists today, which classifies this group as accounting for approximately one-fifth of all mammalian species. Most bat species are insectivorous but diets also range from nectivorous to carnivorous. A varying range of habitats also exists, including caves, mines, trees and the dwellings of anthropogenic structures and buildings. Bat species are able to fill many environmental niches, which makes their continued persistence particularly invaluable. Economically, bats are especially important in agriculture. One analysis, conducted by Boyles et.al, suggests that the economic value of services that bats provide in agriculture could be quantified at 3.7 billion dollars per year (Boyles et. Al, 2011). Insectivorous bats play a vital role in managing pests in agricultural crops; the loss of these services would have substantial economic consequences. WNS was first discovered in a cave in Albany, New York, in February 2006. This fungal disease has been attacking and decimating entire bat populations on the east coast. The disease has been identified in cave- and mine-dwelling hibernating bat species. The species affected thus far include big brown bat (Eptesicus fuscus), eastern small-footed myotis (Myotis leibii), little brown myotis (Myotis lucifugus), northern myotis (Myotis septentrionalis), Indiana myotis (Myotis sodalis), tri-colored bat (Perimyotis subflavus), gray myotis (Myotis grisescens), cave myotis (Myotis velifer) and southeastern myotis (Myotis austroriparius) (BCI, 2012). The U.S. Geological Survey (USGS) notes that 25 of the 45 North American bat species hibernate in caves or mines, which means more than half of all North American bat species could be affected by WNS (USGS, 2012). | |
Methods
Due to federal regulations that protect federally-listed species (Threatened, Endangered or Species of Special Concern), data sets containing hibernating bats species or WNS occurrence data is not made available to the general public. Regulations are imposed to prevent the general public from either directly or indirectly causing harm to federally-listed species by restricting location information to only permitted individuals and organizations. In the case in which access to this data might be available to an individual, basic GIS methods can be applied to analyze and interpret trends in WNS. To begin GIS analysis of WNS, one would obtain data sets (from U.S. Fish and Wildlife Service or other federal agencies/affiliations) consisting of 1) hibernating bat species occurrence data for North America; 2) known locations of potential cave and mine hibernating sites; and 3) a topographic basemap to be used as the reference layer(s). Once the data has been loaded into the map composition, a selected set by location can be performed to highlight cave and mine hibernating sites associated with WNS, as well as WNS-free caves in near proximity to other locations of WNS occurrences. Another selected set by location for hibernating bat species can be performed to identify occurrences of bats within a certain proximity to existing WNS-associated caves or bat populations. This process can be repeated over consecutive years, following winter hibernation and new data is collected, to track the trend and spread of WNS. BCI also combined this data with georeferencing band recapture and radio telemetry studies aid in more precise predictions of how and where the disease might spread so that preventative measures can be more effectively developed and implemented (BCI, 2012). BCI and Whitenosesyndrome.org are organizations that have been involved in WNS GIS tracking and analysis and also provide maps (small-scale) to the public, which illustrate WNS evolution. | |
Results
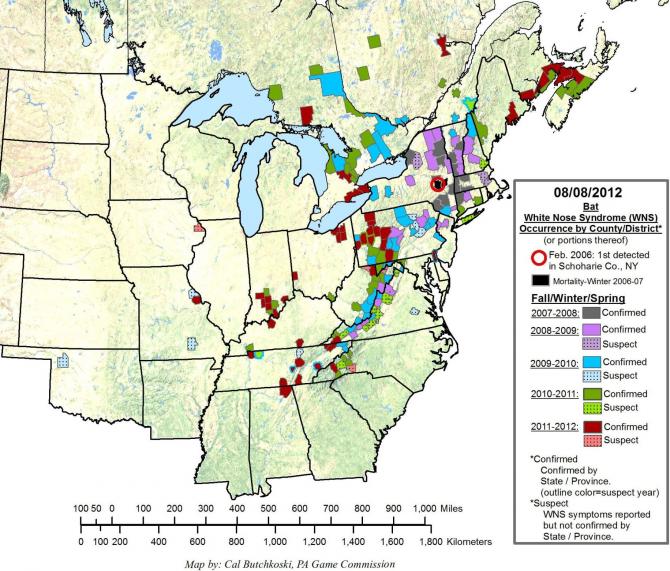
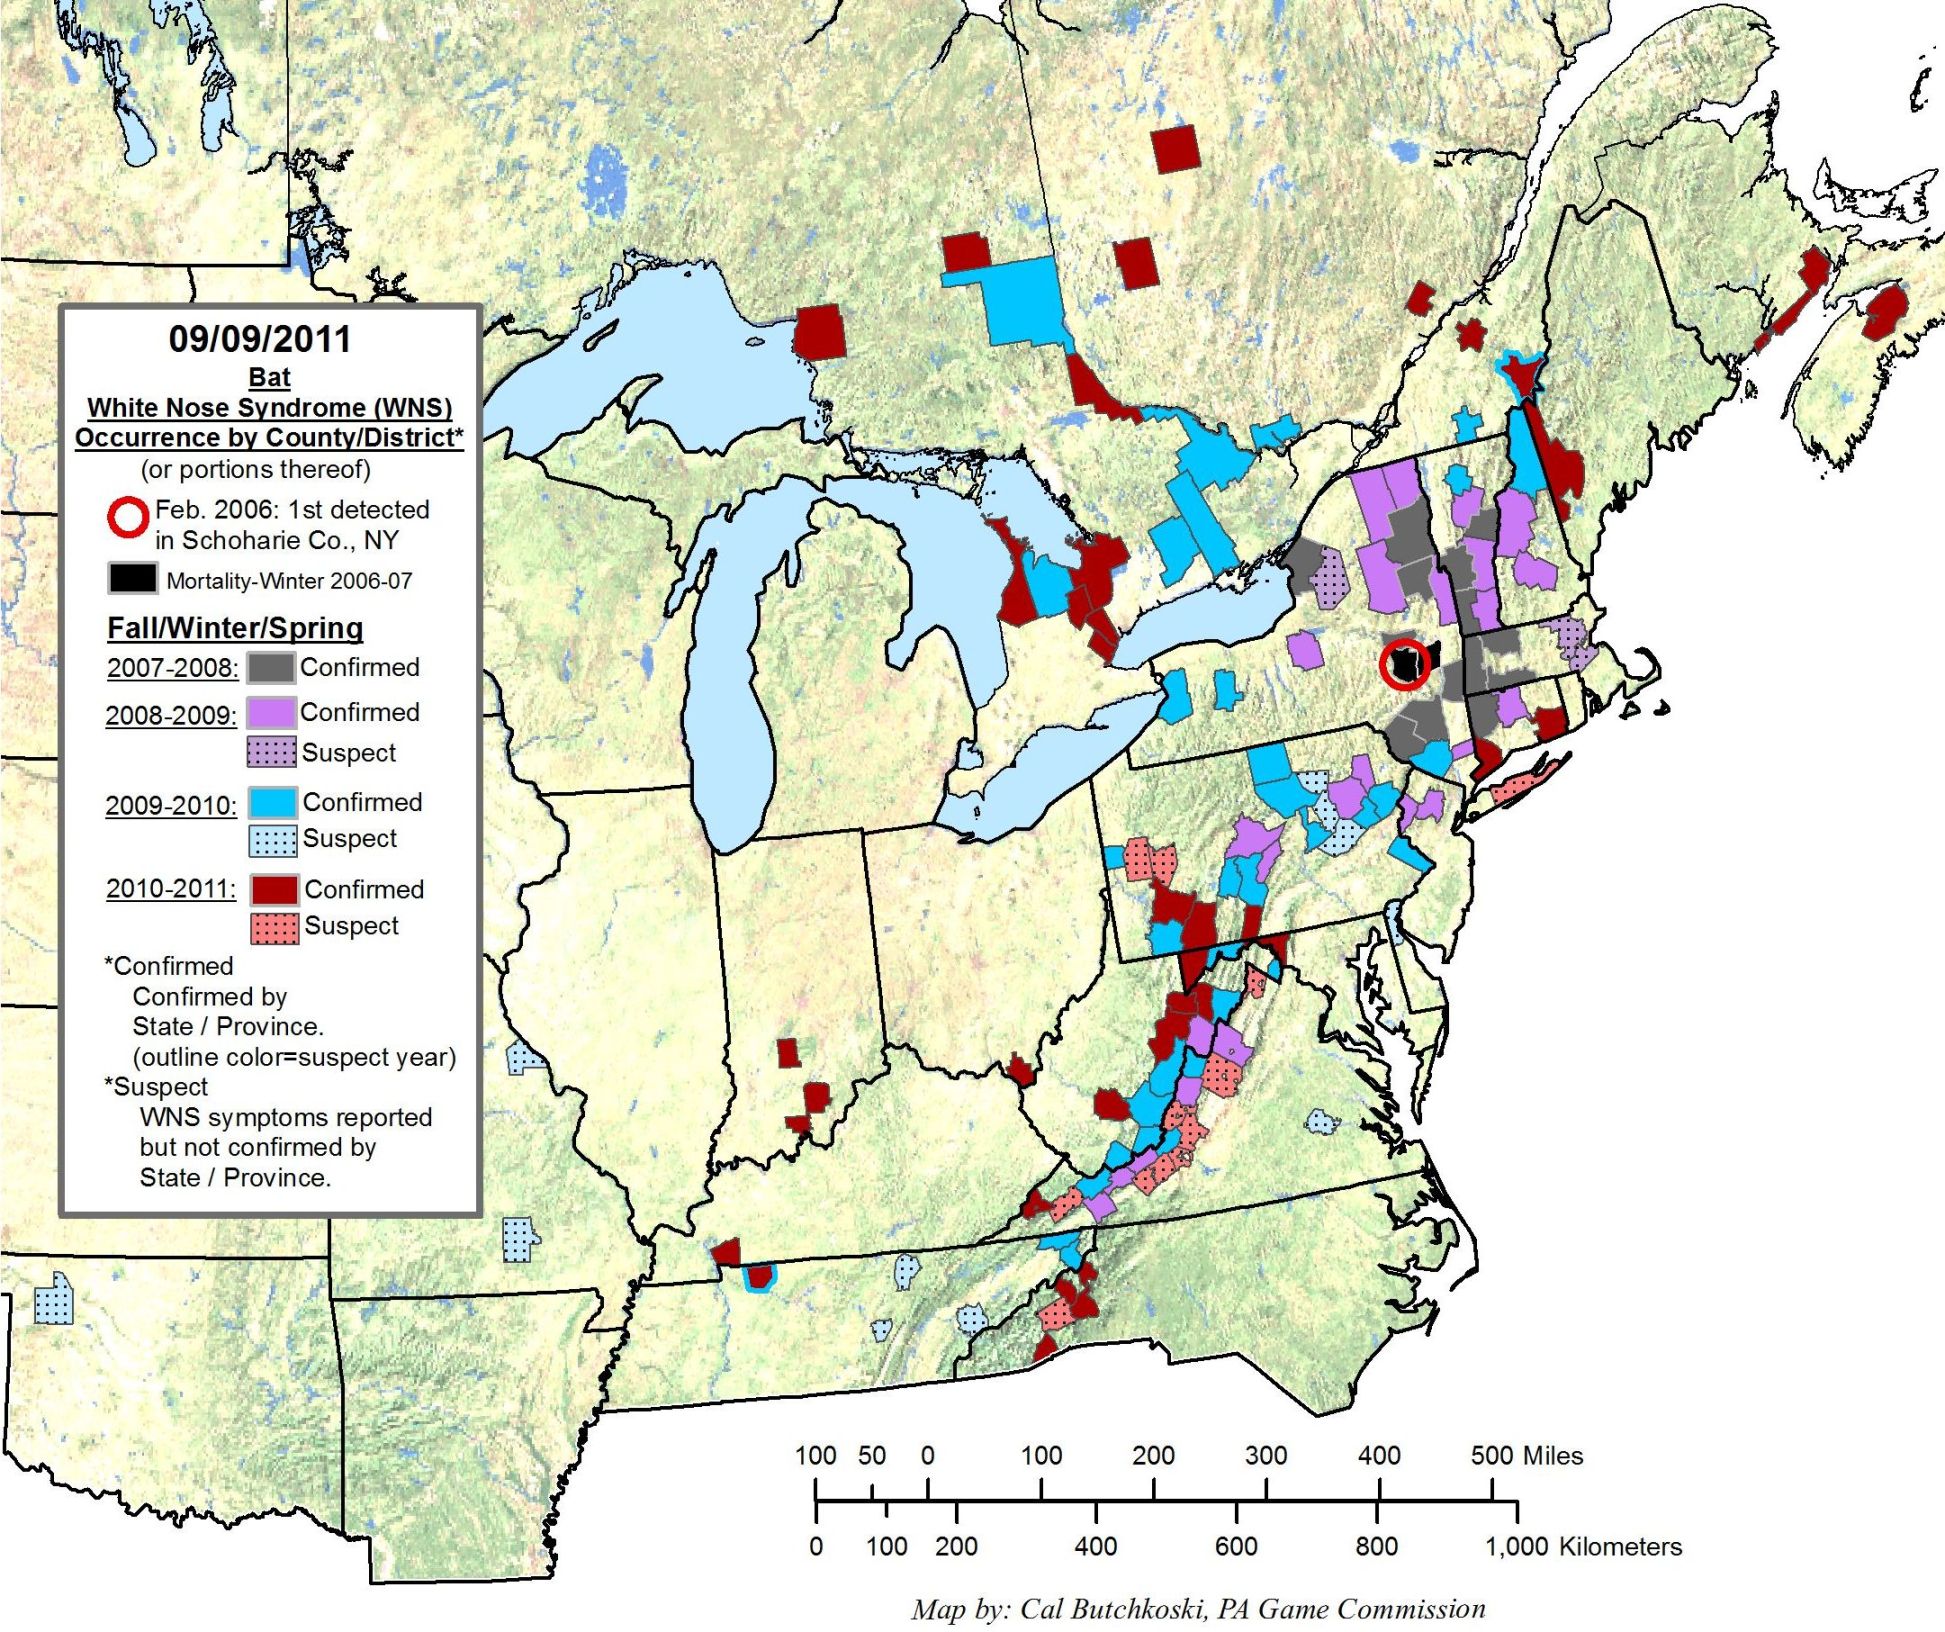
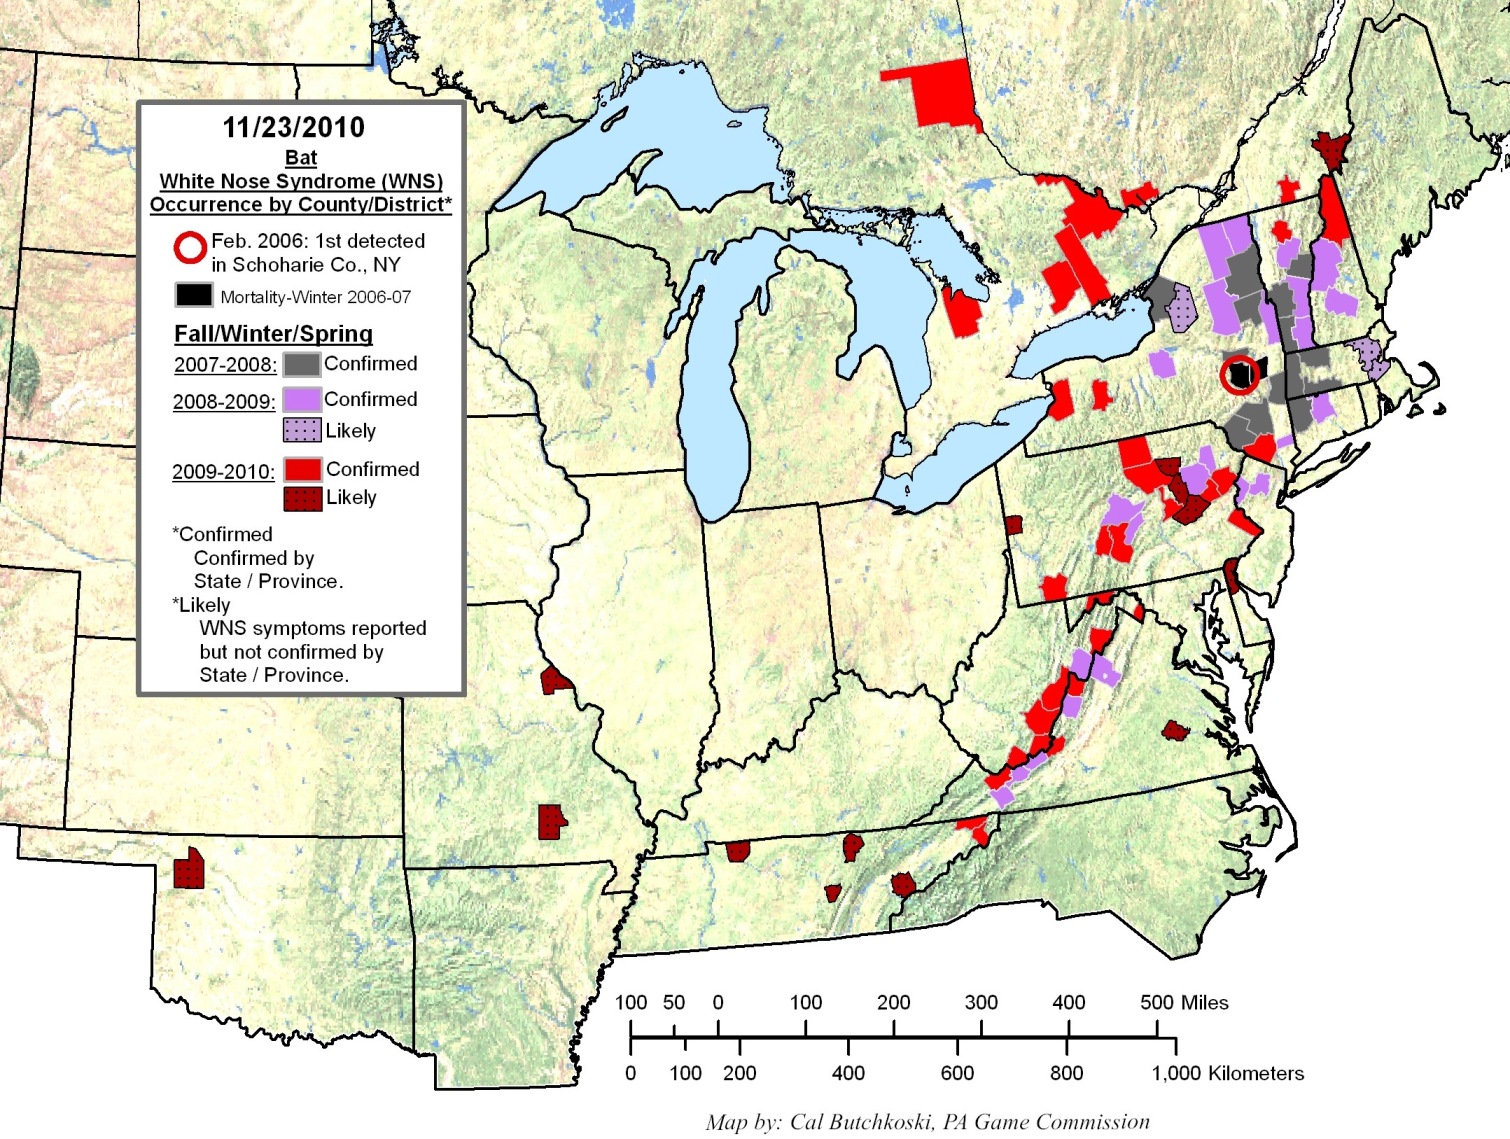
The following figures illustrate the progression of WNS since being discovered in February 2006, up to the August 2012 (Whitenosesyndrome.org). The maps are classified qualitatively with different but equal color and fill symbology. Data for a given year-long period are associated with a unique color, with a solid fill for confirmed WNS occurrences and a solid fill combined with a dotted pattern for reported but not confirmed WNS occurrences. The polygons shown represent counties. The scale of the map is small and provides less-detailed topographic detail. | |
 | |
 | |
 | |
Analysis
Analysis of the results provided indicates that WNS after its discovery in 2006, the disease quickly spread in the areas surrounding its origin and also southward. Data from 2009 onward indicates that WNS occurrences are becoming more densely clustered in the general areas of previously documented cases but the data also indicates that the disease rapidly continues to spread further south and southwest, as well as north and northwest. The given maps successfully show the trending rate and direction of the disease’s spread. However, although these maps were all produced by the same individual, the maps produced each year do not hold the same color symbolization to represent corresponding data across each map. This makes it confusing when comparing the sequential maps because the difference in symbology does not allow for easy interpretation of new data trends versus pre-existing data. Had the symbology been carried over from previous years, new data, and thus trends, would be much easier identified. | |
Conclusion
WNS has led to more than an estimated one million bat deaths since its discovery in 2006 (Wilson; Bayless, 2009). GIS has been a central tool in analyzing WNS’s current and predicted distribution patterns, as well as in gaining bat conservation funding and support. In fact, Esri has contributed a grant for ArcGIS software to be used in mapping the data of this national conservation effort. By interpreting spatial data on a GIS map, efforts can then be focused on addressing areas of concern, either by consideration of greatest total number of individuals infected, greatest number of unique populations affected, special-status species, etc. Being able to have a visual interpretation of the crises enables conservation groups to more effectively convey the intensity of the issue when making proposals for grant funding or conservation support. GIS maps help conservationists, like Bat Conservation International, better communicate the intensity of the concern and, hopefully, gain a network of financial and professional supporters. | |
References
Bat Conservation International (BCI), 2012. Updated on September 26, 2012. Accessed on October 16, 2012. Available online at: http://www.batcon.org/index.php/what-we-do/white-nose-syndrome/subcategory/466.html. Boyles, Justin G.; Cryan, Paul M.; Kunz, Thomas H.; and Gary F. McCracken, April 1, 2011. Economic Importance of Bats in Agriculture. Sciencemag.org., vol. 332. Whitnosesyndrome.org, 2012. WNS Info. Accessed on December 12, 2012. Available online at: http://whitenosesyndrome.org/resources/map. Wilson, Zachary and Mylea Bayless, September 2009. Mapping the Spread of White-Nose Syndrome with GIS. ArcWatch Magazine. U.S. Geological Survey (USGS), 2012. Fort Collins Science Center. White-Nose Syndrome Threatens the Survival of Hibernating Bats in North America. Updated on June 8, 2012. Accessed on December 12, 2012. Available online at: http://www.fort.usgs.gov/wns/. | |