| Title GIS in Law Enforcement | |
|
Author Jennifer Stark American River College, Geography 350: Data Acquisition in GIS; Fall 2012 PO Box 326, Nevada City, CA 95959 (530) 263-2682 JenStark5302632682@gmail.com | |
|
Abstract Officers and dispatchers have lost a few geography skills and become dependent on the GPS and computer mapping. The speed at which an officer in distress can be located has become seconds rather than minutes or not at all. The ability to find victims calling from a cell phone who are unable to provide their location has saved numerous lives that may have been lost without GIS. Citizen’s ability to see crime statistics in their neighborhoods has helped to make many people more aware of their surroundings and crimes occurring near them. Up to the minute crime status provided to Crime Analysis Units. Over all, although there are a few drawbacks they are far surpassed by the benefits of GIS to make it anything other than a huge help to law enforcement and all of public safety. | |
|
Introduction As GIS has evolved so has its use in law enforcement. GIS offers law enforcement agencies the ability to identify crime “hot spots” so that staffing and patrol plans can be adjusted to deter crime; and to provide crime statistics in real time to the citizens. Many look at it as one of the best tools to come along. Others argue that officers and dispatchers have become dependent on it and have lost valuable skills and knowledge. This paper will explore both sides of the argument and the many uses of GIS in law enforcement, Sacramento Police Department specifically, to see which is it, help or hindrance? | |
|
Background The data in this paper came from personal experience. I have worked for the Sacramento Police for 16 years. When I started with the police department there was no computer GIS. I have been through several implementations and improvments of the Canadian CAD/GIS system over the years and I have experienced both the positive and negative effects. | |
| Prior to 2004 Sacramento Police did
not use computer GIS. Officers were issued Thomas Guide map books and were
required to know their beats. They paid attention to where they were and
knew many of the streets on sight without street signs to guide them. If
they didn’t know where an address was they used the Thomas Guide to locate
it and navigate to the location they needed. They knew what streets were
dead ends. Officers knew that if they didn’t know where they were no one
else but the bad guy they were dealing with did either. Dispatchers had
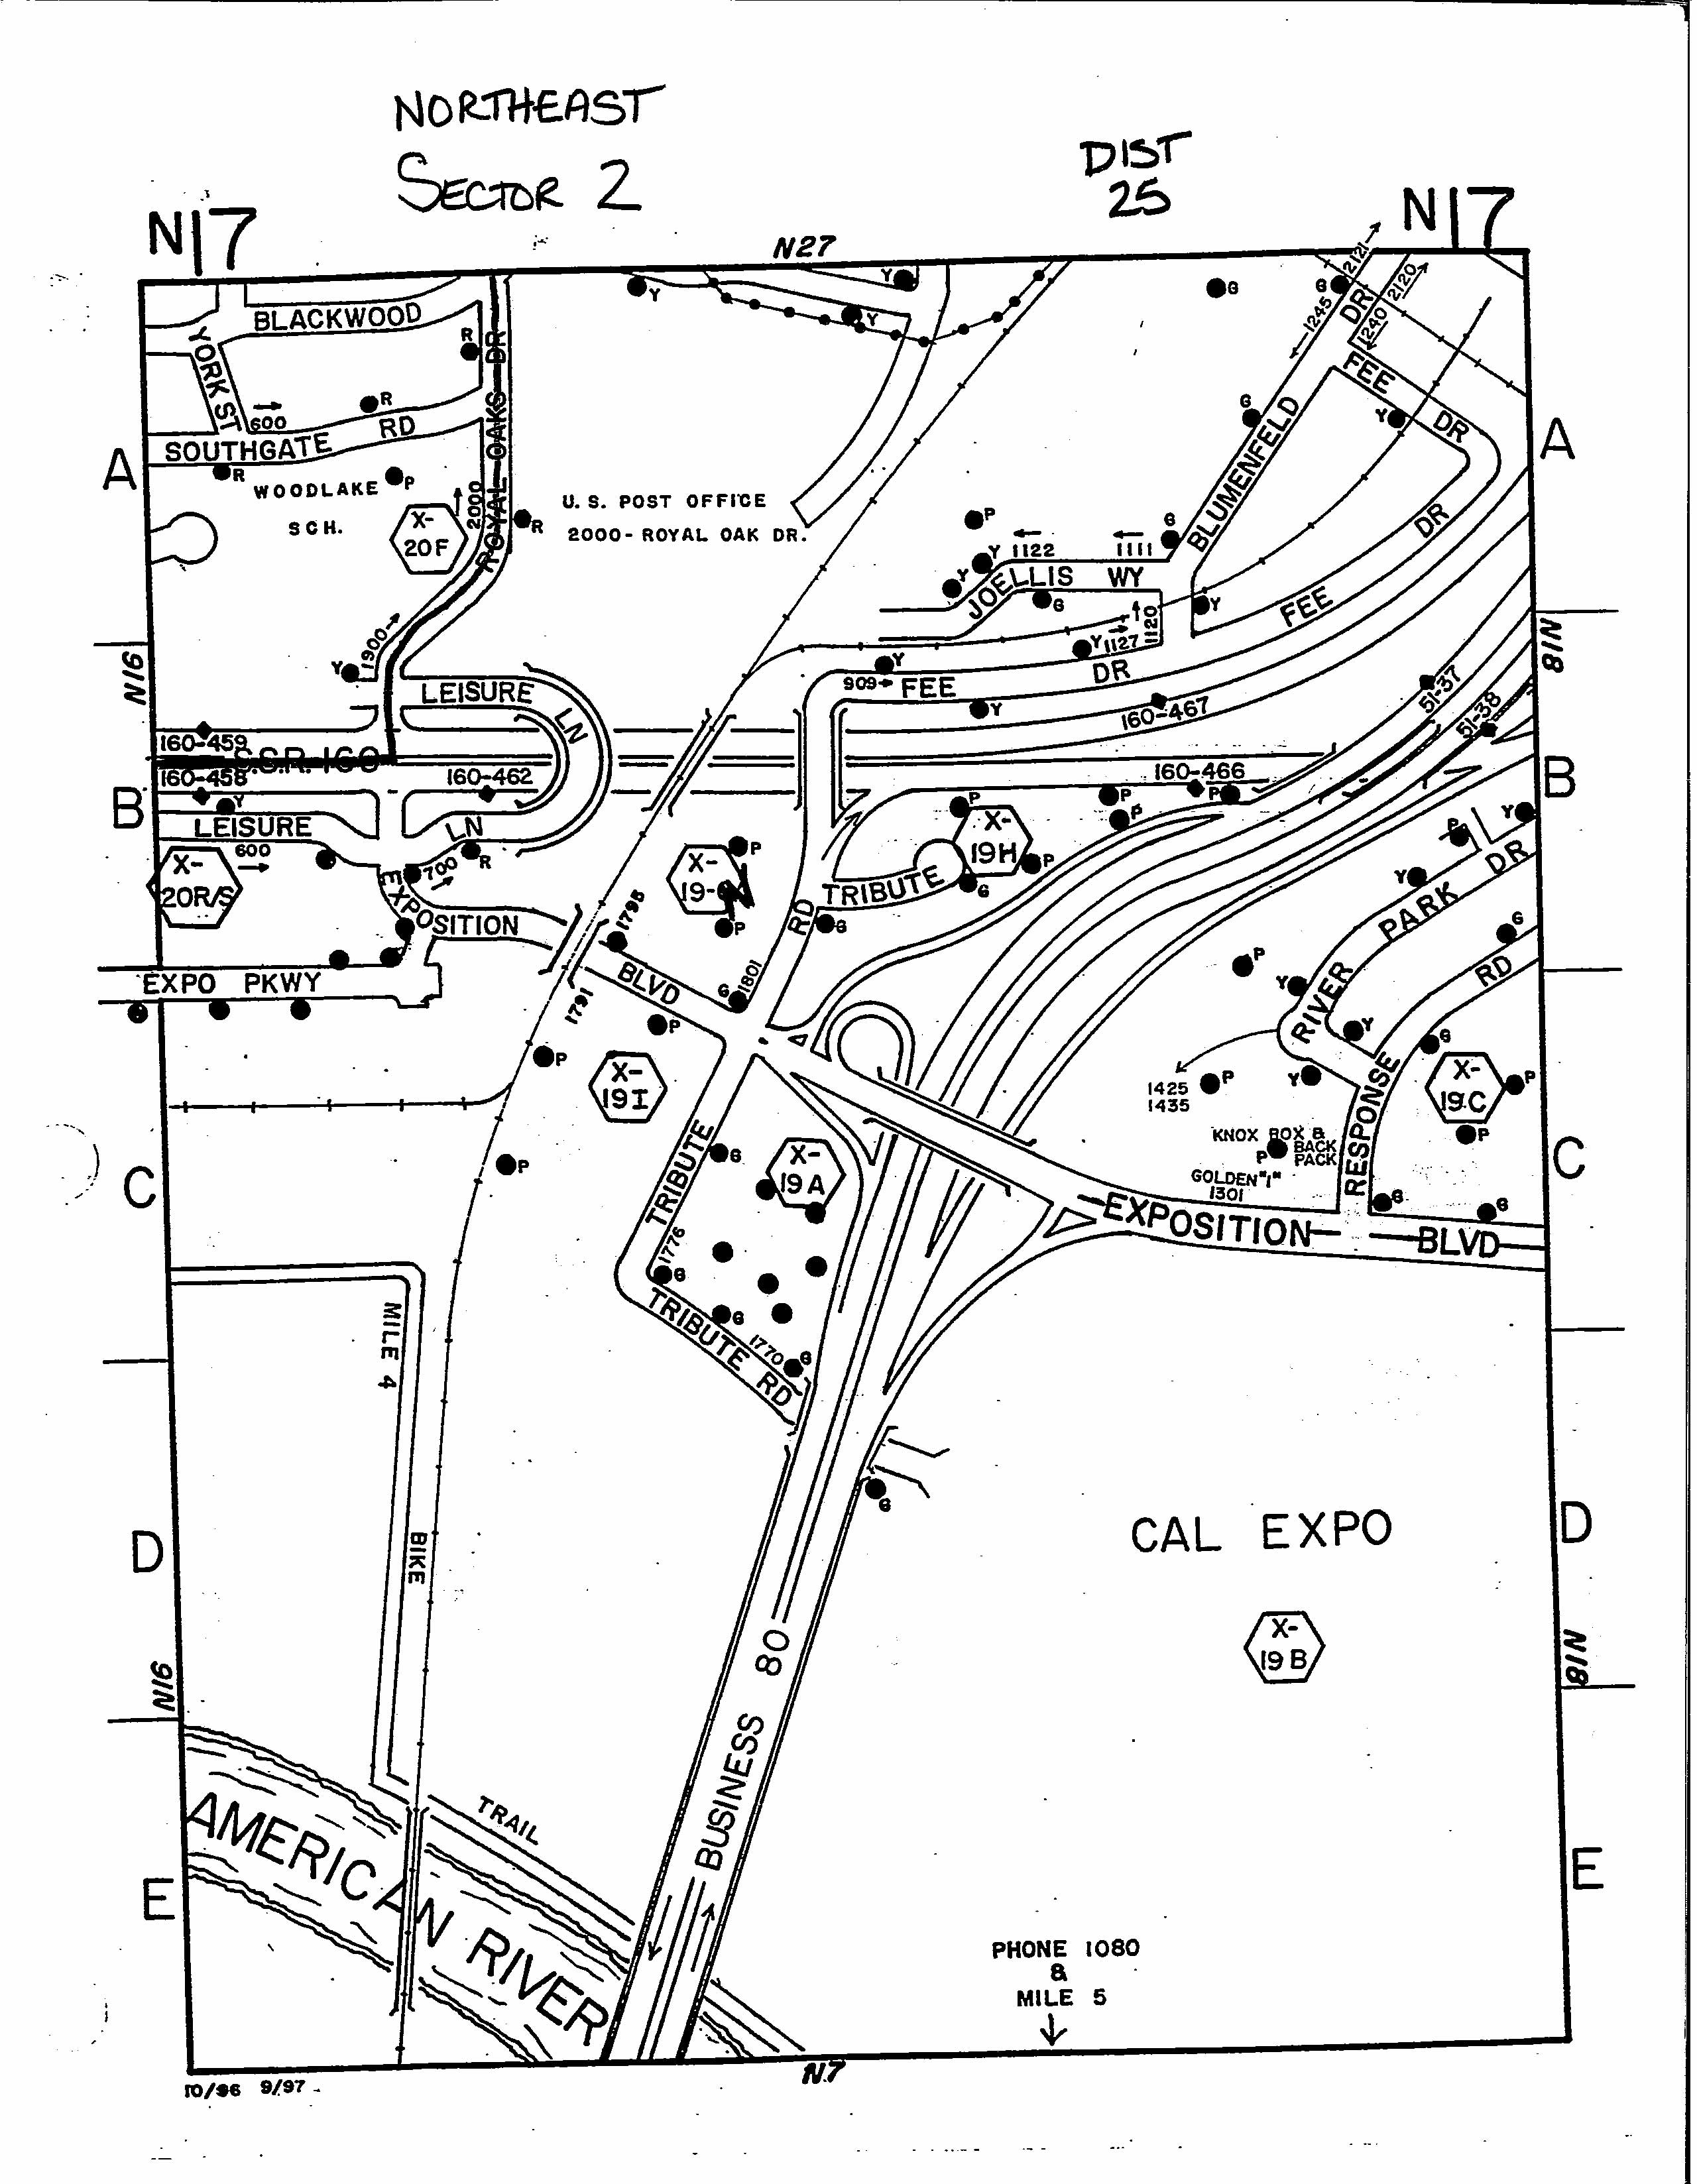
Thomas Guides and large binders of 8 ½ x 11 map pages called Fire Map Books.
If an officer went in foot pursuit or a perimeter needed to be set up the
dispatcher would grab the map pages turn to the correct page and using a
grease pencil write the units identifiers on the map at the locations they
gave. The closest the system came to a GIS was that the map pages were
referenced on the computer based on the location of the incident.. |
|
|
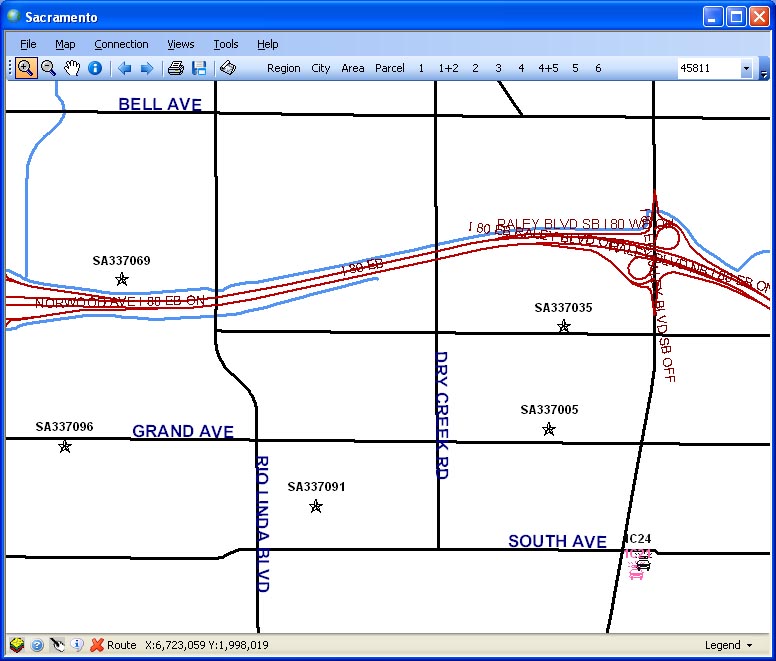
In 2004 Sacramento Police upgraded to a Canadian designed Computer Aided Dispatch (CAD) system that had integrated mapping and integrated GPS for every car with a Mobile Data Computer (MDC) in it. Gone were the Thomas Guides, Fire Maps and grease pencils. Officer safety was greatly increased with the addition of the GPS to the cars, as long as the car was in Sacramento County. When Sacramento Police first implemented the computer maps they felt it was too expensive and unnecessary to purchase anything other than Sacramento County’s map layers. Several years later they realized what a huge safety issue it was not having West Sacramento’s map layers also when an officer was involved in a pursuit that went into West Sacramento and was involved in a shooting. Other officers were severely hindered trying to find him when they had no Thomas Guides, no knowledge of the area and no map layers integrated into their computers to navigate by. Within weeks West Sacramento’s map layers were added. After the change from paper maps and grease pencils to a fully integrated Computer GIS many things changed. The binders containing all the map pages were stored away. Dispatchers no longer relied on memory to know where officers where. Officers started relying on the GPS more and knowledge of their beat and surroundings less. Several times a night units will put out stops and when asked for a location will simply say “map me” because they truly don’t know where they are and are completely dependent on the dispatcher and other officers being able to see them on their computer map. There have been very few instances where the officer didn’t know his location and the GPS was not transmitting delaying both incident entry and any assistance from locating the officer. Far more often the GPS has saved an officer who was not able to transmit his location. With just a few keystrokes the source of an unidentified transmission can be identified and mapped so that assistance can be sent. This is possible because not only are the cars equipped with GPS they each have a radio with an Electronic Serial number that is integrated into the computer system. | |
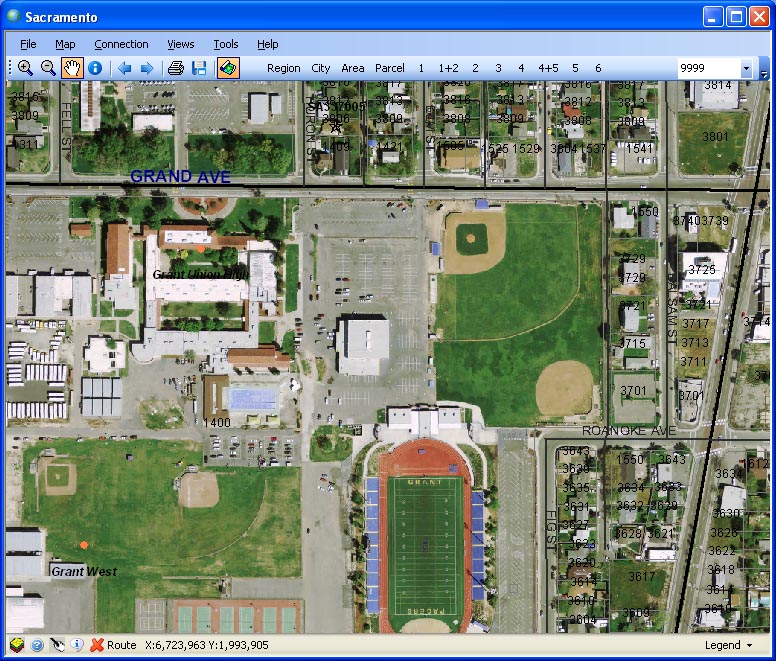
| Sacramento County GIS has multiple layers that are turned on or off depending on how far in or out the map is zoomed. Unfortunately West Sacramento GIS files only consist of one layer, no aerials and no color variation for highways, streets, or rivers. In addition to highways, streets, parks, schools, aerials and light rail layers Sacramento Police has a person in their GIS department who adds city specific information layers such as river mile markers for the marine unit, bike trail call boxes, fire stations and bike trails. All these layers may seem like overkill to some but when a person’s life depends on the police or medics being able to locate them quickly based on landmarks or a call box number they become an incredibly important tool. |
|
 |
|
|
Several years after the implementation of
the new CAD and GIS cell phones advanced to Wireless Phase II which transmits
GPS coordinates to the CAD system when 911 is called. If someone dials 911 from
a wireless phone and is unable to provide a location the phone itself can be
mapped with the click of a button, a call entered and help sent to the person.
Before phase II phones came along only the closest tower location was provided
when a cell call came in on 911. If the caller was not able to give a location
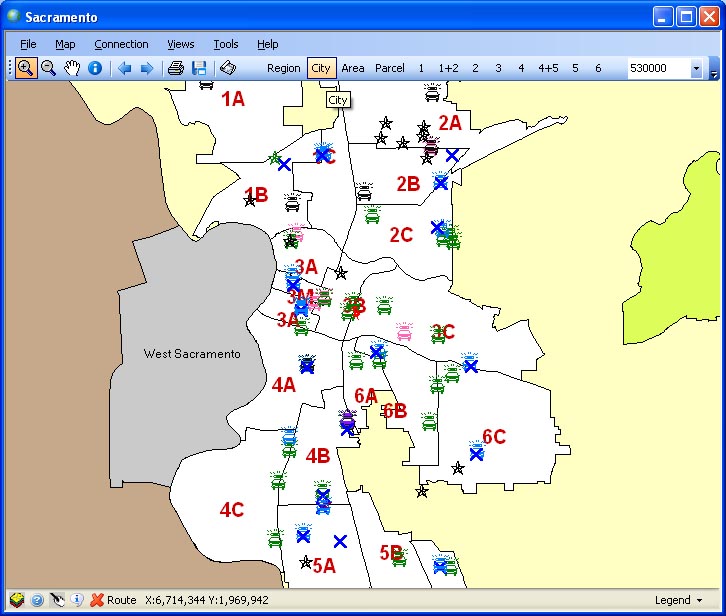
it was nearly impossible to locate them and send help. In addition to showing
where a 911 cell phone caller is located the GIS Map displays all the calls
that are active in the city, it displays the location of every GPS equipped
squad car, and based on symbols and color coding anyone looking at the map
can tell what the status of a call or unit is. As the use of GIS in patrol and call taking has increased so has the public’s access to the information and statistics generated using GIS. Crime statistic maps can be accessed through the city’s web site. They have pin maps Pin Map Serious Crime January 1 - December 31, 2011, and density maps for serious crimes Density Map Serious Crime Januar 1 - December 31, 200. Citizens can see what the helicopter is doing if they see or hear it flying Helicopter Activity. They have access to neighborhood-specific crime statistics and maps Neighborhood Crimes. Citizens can see the types of crimes occurring around their homes or offices. If people know that there is an increase of robberies near them they become more observant and are less likely to become victims thus helping decrease crime. Crime statistics are presented in nearly real time this was not the case prior to GIS when crime maps could take days or weeks to produce. Without GIS, crime stats would not be as readily accessible to citizens or the Crime Analysis Unit. With the ability to analyze crime statistics as they are happening the Crime Analysis Unit has been able to identify crime “hot spots” and increase patrol in those locations. By increasing patrol and making officers more visible in specific areas identified by the stats provided by the GIS system they have been able to reduce crime in previously high crime areas. In addition to identifying hot spots stats can be used to track gang activity, violent crimes, catalytic converter thefts and any number of other crimes and activity. | |
|
Analysis Getting any stats from CAU prior to 2004 was not an option.
I contacted them and was told that the only data they had access to was after the upgrade in 2004.
There was no way to see if GIS has actually improved response times as hoped. GIS has been a big asset
to law enforcement and public safety. | |