Display of the Effects of Two Historic Droughts on the Groundwater Levels in Davis, California | |
|
Author Kate Whitney American River College, Geography 350: Data Acquisition in GIS; Fall 2012 | |
|
Abstract The history of California includes multiple droughts. Two of these notable droughts occured from 1976 through 1977 and the other occurred from 1987 through 1992. Davis, California uses groundwater to meet residential and agricultural demand. There were notable changes in the Davis groundwater supply during these two drought events. Using the Department of Water Resources (DWR) Water Data Library, data was collected on the wells in and around davis to create a visual representation of the groundwater level changes. The display of this groundwater data revealed that, though short, the 1970's drought was more severe than the 6-year drought later in the century. | |
|
Introduction The city of Davis is located in the Sacramento Valley Groundwater Basin. Davis has a population of 65,622. It houses the University of California, Davis and is surrounded by agricultural lands. These factors produce a demand for groundwater for a wide variety of uses including residential water supply and crop irrigation. Groundwater availability and necessity can be dependent on the season and on unique weather events. As of 2004, California had experienced two significant droughts (DWR, 1993 and Keyantash and Dracup, 2004). The first drought occurred during 1976 and 1977 and produced 45 percent of expected annual precipitation. The second occurred from 1987 through 1992 and was characterized by its longevity. This project is intended to design a visual representation of the changes in groundwater levels in Davis between 1973 and 1995. | |
|
Background | |
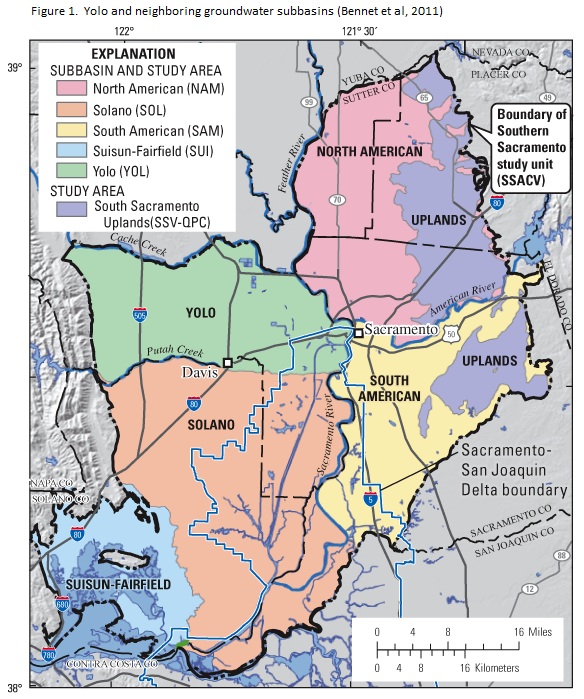
| Davis is located in the Yolo Subbasin in the Sacramento Valley Groundwater Basin of the Sacramento River Hydrologic Region (Figure 1)
(DWR, 2004).
Increased groundwater pumping and decreased precipitation have affected water levels in the Subbasin.
"California’s 1987-92 Drought: A summary of six years of drought" describes the drought events; however, it does not detail their effects on Davis and the Yolo Subbasin (DWR, 1993).
The 2004 reports also address the droughts but they do not provide visual representations of the effects to depth to groundwater. |
|
|
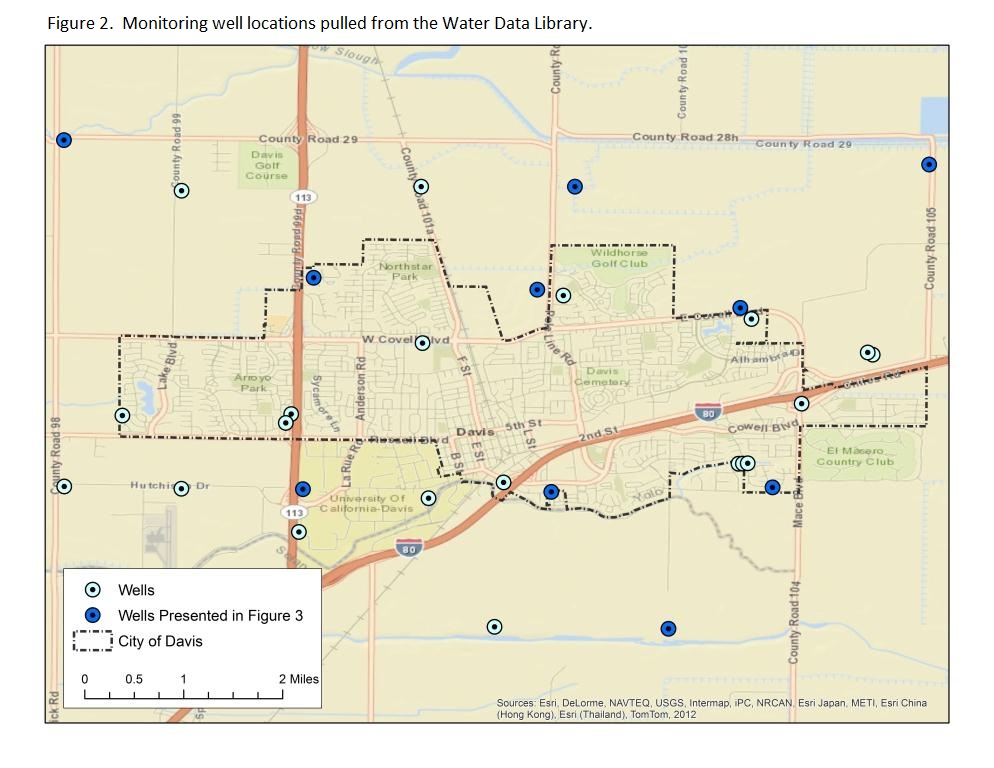
Methods The data were acquired using the DWR Water Data Library (2012) . The Water Data Library is a compilation of groundwater level and quality data taken from the DWR monitoring well network and is available to the public. The groundwater level data were downloaded for each well located in area of interest using township, range, and section. The data were collected by multiple entities including research institutions, private consultants and federal, state, and county agencies. The datasets for 30 available wells were downloaded and assembled into one Microsoft Excel spreadsheet. Of the 30 wells, those with data for the years between 1973 and 1995 and included data during both drought periods were selected. All wells are depicted in Figure 2. The average yearly depth to water was calculated for each of the ten selected wells. These average yearly depths to water were used to construct a line graph to depict the data. | |
| |
|
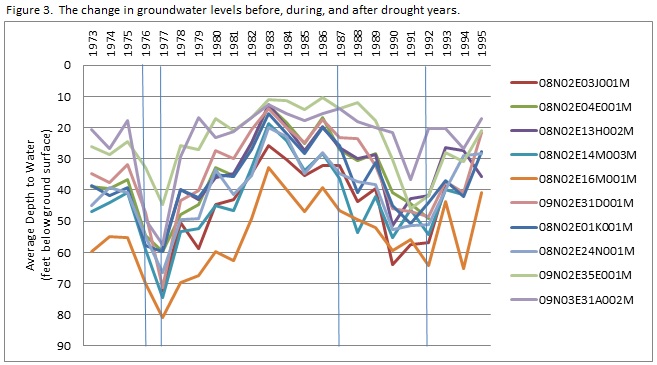
Results The drought years are apparent as shown in Figure 3. Troughs of receding groundwater can be seen around the times of the droughts in question. Originally, a series of quantitative discrete or continuous maps were going to be created to depict the changes in each well. However, due to time constraints and the amount of variation between wells and between years, it was decided that a simple line graph would prove adequate in showing change over time. | |
| |
|
Analysis As expected, the depth to water increased during the drought years (Figure 3). A steep drop in groundwater level is visible after 1975 and the levels rebound after 1977. A more gradual drop is apparent after 1986. There is more variation in the depth to groundwater in each well prior to 1992 but after 1992 levels rise steadily. Despite the shorter time span, the severe lack of precipitation resulting in the 1976-1977 drought had a more dramatic effect on water levels. However, the 1987 drought did cause a noticeable decline in water levels. It should be noted that no statistical analysis was performed on this data. Furthermore, data quality was assessed by visually scanning for outliers. The only value that stood out as an outlier was 08N02E16M001M during 1994. This value could have have resulted from an increased pumping rate. Due to time constraints, only a small number of wells in a small area were selected for display rather than multiple wells across the subbasin. Fortunately, the small sample size still depicts the anticipated changes in depth to groundwater. | |
|
Conclusions These results could prove valuable in simply displaying groundwater events to groups or individuals interested in Davis’s groundwater history. For those who are truly interested, a more comprehensive graph depicting the 20th century in its entirety might be more appropriate. Additionally, this report did not delve into the many factors that result in drought. Further comparisons between temperature, snow pack, precipitation rates, water use, etc. can be made to form more complete pictures of these droughts. | |
|
References Bennett, G.L., V, Fram, M.S., and Belitz, Kenneth. 2011. Groundwater quality in the Southern Sacramento Valley, California: U.S. Geological Survey Fact Sheet 2011-3006. 4 p. Department of Water Resources (DWR). 1993. California’s 1987-92 Drought: A summary of six years of drought. California Department of Water Resources, Sacramento. 46p. Department of Water Resources (DWR). 2004. California’s Groundwater: California Department of Water Resources Bulletin 118 – Sacramento Valley Groundwater Basin, Yolo Subbasin. California Department of Water Resources, Sacramento. 7 p. Keyantash, J.A. and J.A. Dracup. 2004. An aggregate drought index: Assessing drought severity based on fluctuations in the hydrologic cycle and surface water storage. Water Resources Research. 40:1-13. Water Data Library [Internet] Sacramento (CA): Department of Water Resources: c2012. [cited November 30, 2012]. Available from http://www.water.ca.gov/waterdatalibrary/. | |