TITLE
Fast Food Restaurant Density and Obesity Rates in California
Counties: A Geographical Perspective
AUTHOR INFORMATION
David Yager
Contact Information: yagerd@imail.losrios.edu
ABSTRACT
This project attempts to establish a correlation between the
number of fast food restaurants normalized by population with child and adult
obesity rates. The study area is
INTRODUCTION
Obesity is at epidemic proportions in this country. The economic effect of obesity affect each and everyone of us in terms of healthcare costs, not to mention the human cost of suffering caused by obesity-related disease. A possible contributing factor to this epidemic is the prevalence of fast food in the Western diet.
The focus of my project is to examine the possible
correlation between the number of fast food restaurants and obesity rates of
children & adults, in
BACKGROUND
It is well documented that obesity
& obesity-related diseases have increased rapidly in the
A study involving groups of school age children and expectant mothers was conducted with the goal of establishing such a connection between fast food consumption based on proximity to fast food restaurants & obesity (Currey, Janet, Stefano Della Vigno, Enrico Moretti, Vikram Pathania, 2009). The results of the study concluded that in fact, credible evidence does exist linking the two.
In yet another study, a potential causal relationship between the availability of fast food and its effect on the obesity rate is investigated, concluding that indeed an increase in the number of fast food restaurants results had a significant positive influence on the Body Mass Index (BMI) of both males and females in the study group (Dunn, Richard A., 2008).
While any single study on its’ own has yet to unequivocally establish a definitive link between fast food and obesity rates which could lead to regulatory action, the evidence is mounting.
METHODS
In order to do a meaningful analysis, the data needed to be extracted and prepared from the sources named in the Reference section of my paper. To complete this task, I chose to use ArcGIS 10. The next several sections illustrate the steps taken for data preparation, along with the appropriate screen shots.
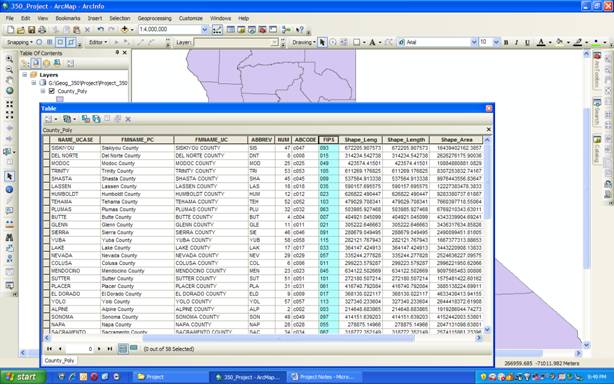
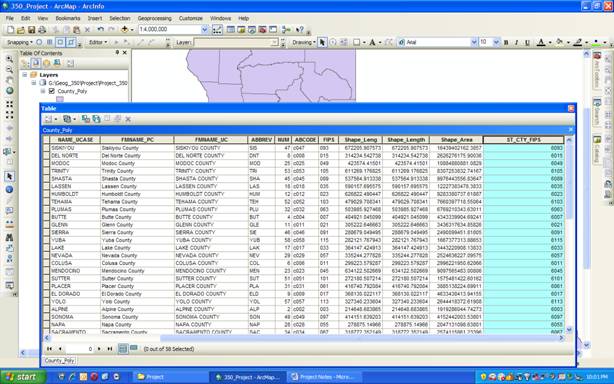
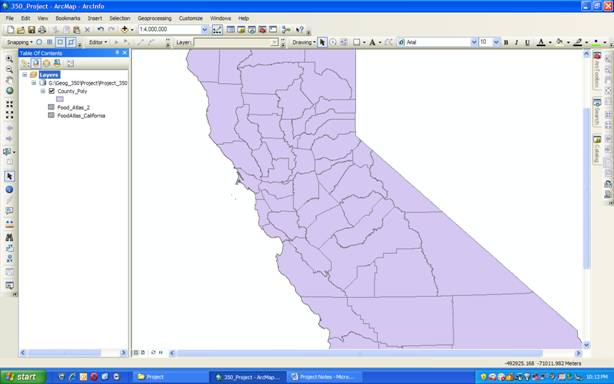
I first added a new field to the County_Poly layer called ST_CTY_FIPS. This new field would establish a key field, which would be the basis for a join with a data table called Food_Atlas_2. The resulting table would be named FoodAtlas_California.
I then used the Field Calculator to add a “6” to the front of FIPS code in County_Poly layer to populate the new field. Here are the two screen shots:
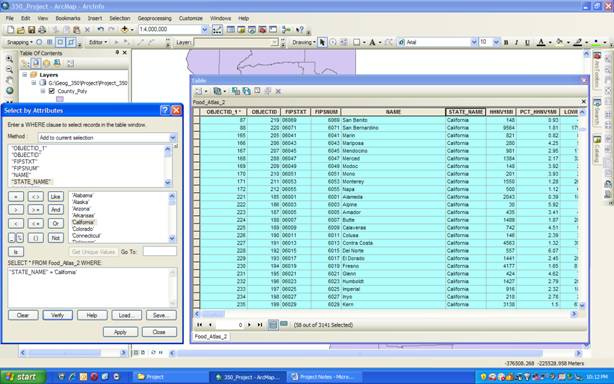
Then, starting with Food_Atlas_2 table, I performed a Select By Attribute to select records for California Counties only. The new table is called FoodAtlas_California:
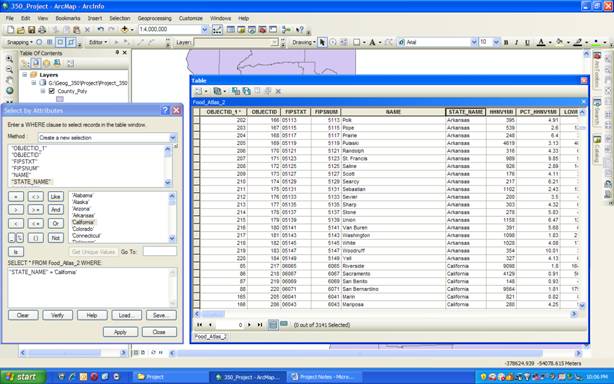
The resulting Table now filtered by
I then joined FoodAtlas_California table to the County_Poly layer based on the ST_CTY_FIPS field created earlier, and FIPSNUM in the FoodAtlas_California table:
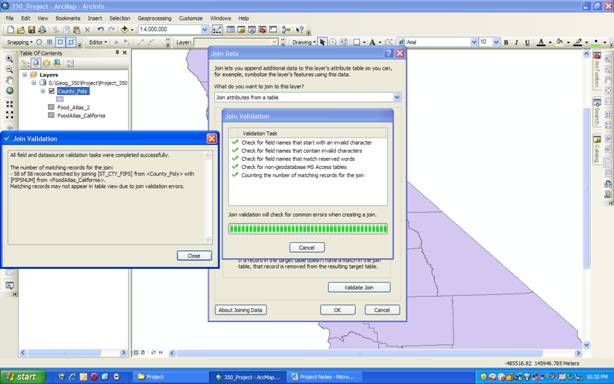
The resulting join provided all the data required to begin my analysis and create a map.
RESULTS
Since the goal was to look for a possible correlation
between obesity and the number of fast food restaurants from a geographical
perspective, I wanted to create a map, which showed both the number of fast
food restaurants combined with the obesity rate for each
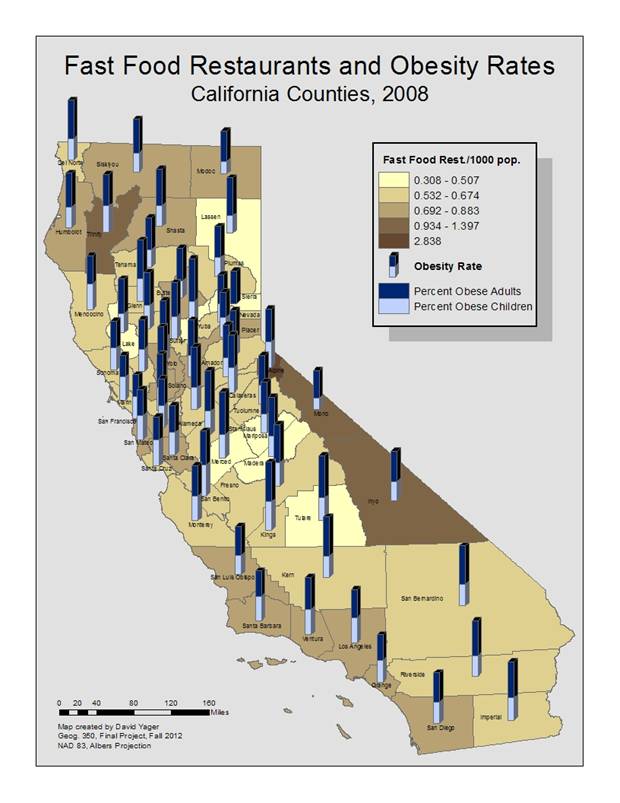
Applying the criteria above, a map was created using ArcGIS 10. For symbology, a graduated color scheme was chosen to symbolize the number of fast food restaurants per thousand population. A lighter color represents the lowest number, progressing to the darkest color representing the highest number. Numbers are rounded to three decimal points.
For obesity rate symbology, a stacked bar was chosen, with Child obesity symbolized by light blue and Adult obesity with dark blue. Due to labeling overlap, I chose not to include percentage values on the map, rather just show relative values. Actual percentage values are summarized in an ArcGIS generated report, saved as a PDF file, which is included in the project folder. Here is the final version of the map:
ANALYSIS
The resulting map shows some interesting relationships between counties based on fast food restaurant density & obesity rates. For example, I was surprised to see such a high density of fast food restaurants in Alpine, Inyo, Mono & Trinity counties. Of course, with a lower overall population in these counties, any addition or building of fast food restaurants could quickly cause an increase in the density metric of fast food restaurants per thousand population. Still, the results were somewhat surprising.
Same with the child & adult obesity rates. Looking at overall combined rates within these same counties, Alpine & Trinity counties have very high rates, much higher than I would have anticipated. Perhaps lower incomes and/or higher poverty rates prevail in these counties, which studies have indicated can attribute to a higher incidence of obesity since fast food can be rather inexpensive, and an easy solution for satisfying hunger.
With this in mind, the affluent
The biggest challenge in this project was finding data related to the number of fast food restaurants. I was fortunate to find it included in the Food Atlas table along with the obesity data. Obesity data seemed to be widely available from a number of sources.
CONCLUSION
Based on my analysis as illustrated by the map, there is no clear evidence supporting a direct correlation between the number of fast food restaurants & the obesity rate in the study area selected, for the year 2008. Perhaps looking at these metrics over a time period of several years might paint a very different picture.
Any additional study might include factors such as the poverty rate, median household income, availability of cooking facilities and/or availability of grocery stores. Any or all of these factors when added to the analysis, may help establish a solid correlation between fast food restaurant density and obesity.
I believe this is a worthwhile topic for further analysis.
REFERENCES
Currey, Janet, Stefano Della Vigno, Enrico Moretti,
Vikram Pathania,
"The Effect of Fast Food Restaurants on Obesity," January 2009,
Dunn,
Richard A., "Obesity and the Availability of Fast-Food: An Instrumental
Variables Approach," March 31, 2008. iHEA
2007 6th World Congress: Explorations in Health Economics Paper.
Economic Research Service (ERS),
Cal-Atlas Geospatial Clearinghouse, CA.Gov, "Boundaries
-