| Title Exploring Possible Spatial Correlations Between Obesity and Various Demographics in the United States | |
|
Author Cameron Yu American River College, Geography 350: Data Acquisition in GIS; Fall 2012 | |
|
Abstract This project will examine obesity in the United States in terms of where it is most concentrated and what are some correlations with demographic data. This is a relatively new phenomenon that started its trend in the 1980s and has been a health concern in recent years. | |
|
Introduction Obesity is defined by the Body Mass Index as greater than 30 kg/m2. The body mass index is a ratio of a person’s weight to height. Normal weight is considered about 18.5 to 20 BMI and anything below is generally underweight and anything over is generally overweight. While there are some acknowledged shortcomings of this ratio, it is the standard used today. I will use Arcmap to show obesity rates across the country. | |
|
Background About a third of the U.S. population is considered obese. There are multiple causes and/or correlations behind this problem. Some examples are sedentary life styles, dietary problems, genetics, and socio-economic status. There are well known associated health problems that go along with obesity as well such as heart disease, high blood pressure, diabetes, breast and colon cancers, high cholesterol, and so on. In 2009 – 2010, 36% of men and 42% of women were obese. Adults over 60 years old were more likely to be obese than younger adults. People of lower income also tend to be obese partly due to lack of access to fresh food among other reasons. | |
|
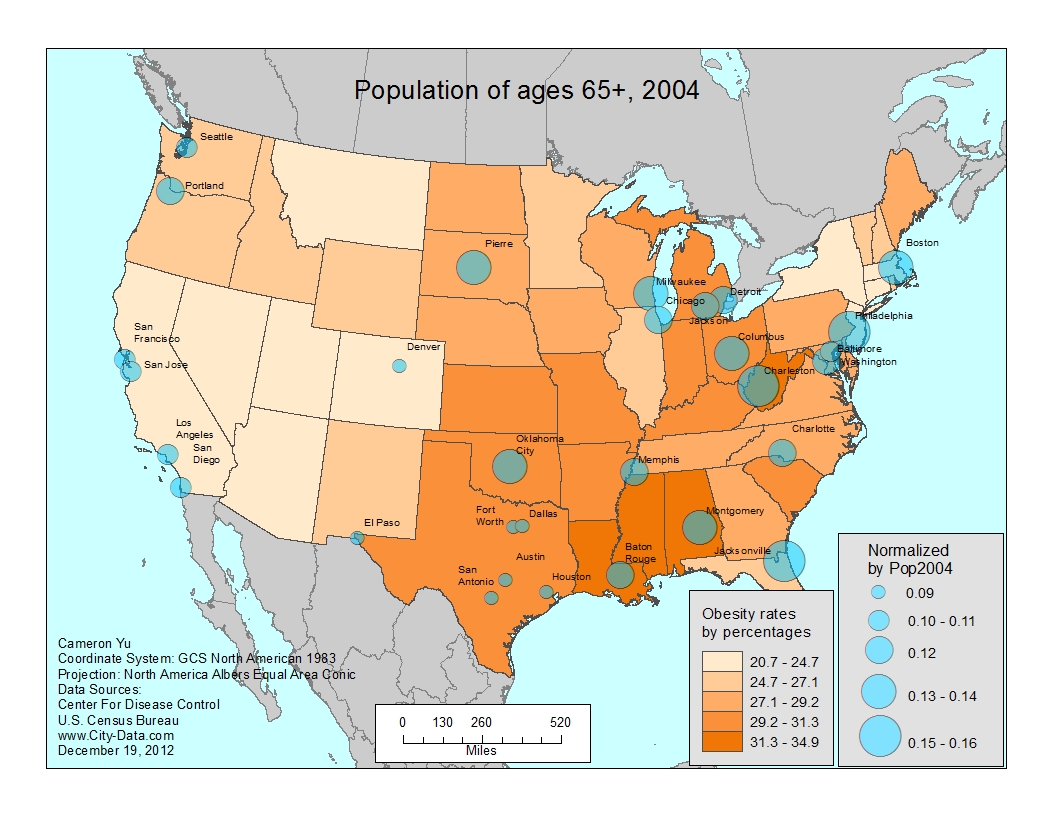
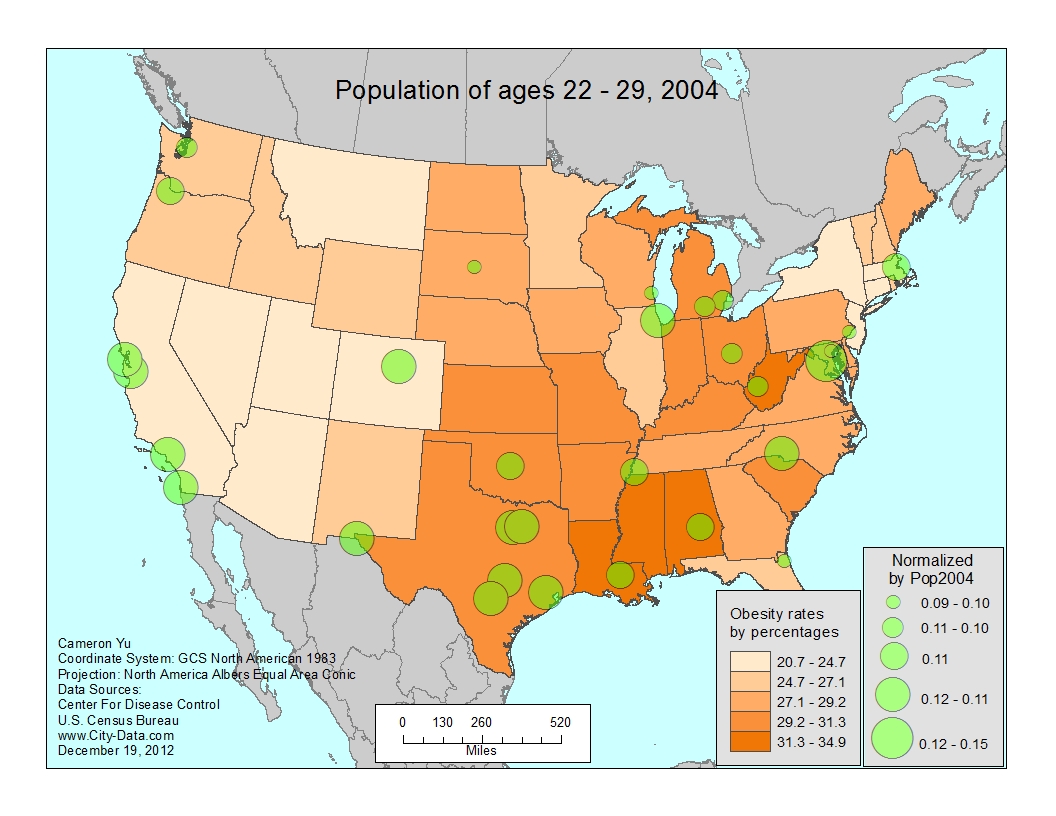
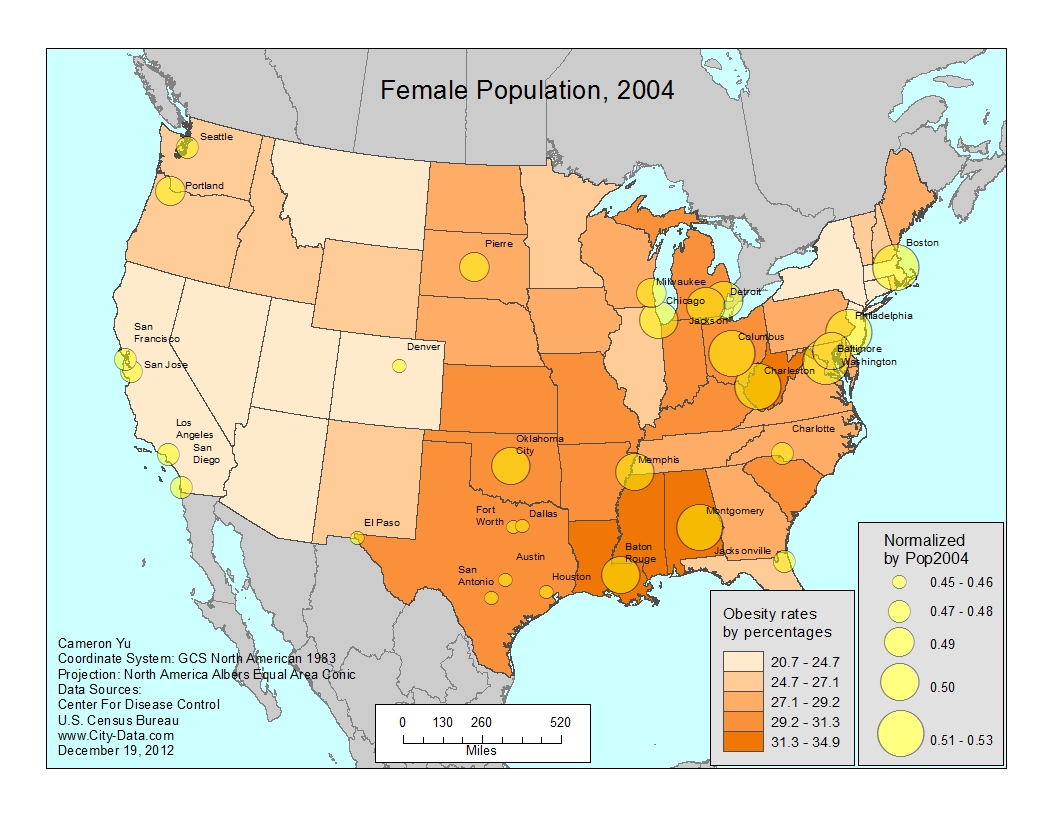
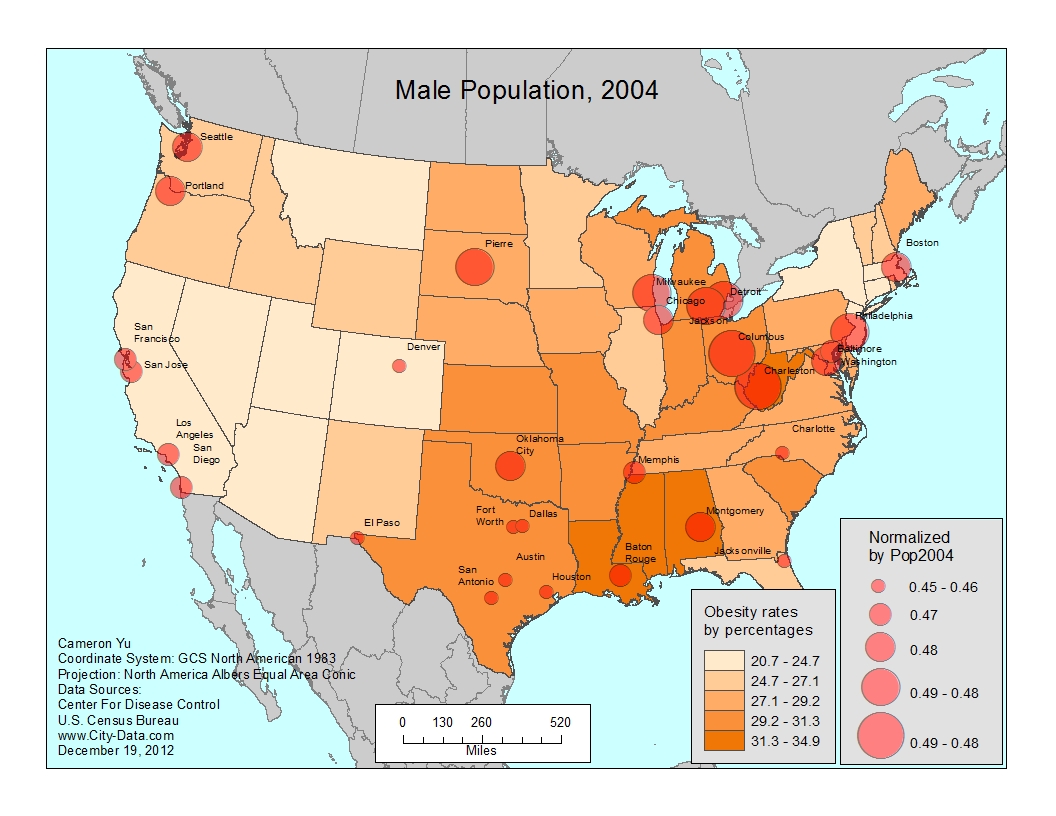
Methods The program that was used for this project was ArcMap 10.0. I obtained obesity data from the Center for Disease Control website. The data was presented as what percent of the population was obese by state. Then I used some census data I already had from the cartographic design class. I made a select by attributes query to select larger cities that were 500,000 people or over to lessen the number of cities I was going to work with. Then I went to www.city-data.com to gather some median income data. With this I created a choropleth map of the obesity rates and created proportional symbols of the cities to display income, gender, and age demographics. Essentially, I created several bivariate maps to compare the different layers. |
|
|
Results The states that had the highest income levels were Louisiana, Mississippi, Alabama, and West Virginia. Overall the east coast, especially the southeast, was more obese than the west coast. Lower levels of income were associated with the south. The south also tended to have more females than males. The older population also tended to be more concentrated in states with higher obesity rates with a couple exceptions. Texas had significantly more young adults than older adults. Louisiana and Mississippi had roughly equal numbers of younger and older adults. Most of the areas that had significantly more older adults than younger adults was Florida and the north east. | |
| |
| |
| |
| |
|
Analysis I would have liked to use a U.S. census data set from 2010, but I was not sure how to acquire one. I wanted to put the gender and age maps on the same page so they could be easier to compare rather than toggling them from slide to slide, but they would have been too small. The maps themselves though looked really well because I could see the symbols quite clearly. | |
|
Conclusions I should have included a regression analysis so we can actually see what correlates between obesity rates with the demographics rather than just estimating correlations on the map. Other eating disorders might be interesting to look at for future analysis. | |
|
References 1. Caprio, Sonia, et. al. Influence of Race, Ethnicity, and Culture on Childhood Obesity: Implications for Prevention and Treatment. American Diabetes Assocation. November, 2008. http://care.diabetesjournals.org/content/31/11/2211.full 2. Caroll, M., M.S.P.H., et. al. Prevalence of Obesity in the United States, 2009 – 2010. Center for Disease Control and Prevention. National Center for Health Statistics. http://www.cdc.gov/nchs/data/databriefs/db82.pdf 3. Lavine, James. Poverty and Obesity in the U.S. The American Diabetes Association. 2011. http://diabetes.diabetesjournals.org/content/60/11/2667.full | |