| Title Can GIS Show Habitat Preferences? | |||||||||||||||||||||||||||||||||||||||||||||||||||||||||||||||||||||||
|
Author Kaitlyn Green American River College, Geography 360: Data Acquisition in GIS; Fall 2013 | |||||||||||||||||||||||||||||||||||||||||||||||||||||||||||||||||||||||
|
Abstract With GIS becoming more integrated into every day life it is also becoming more helpful in the realm of biological conservation. One area in which GIS has aided the conservation effort is in creating accurate maps regarding species distributions and habitat locations. This project tries to determine if these maps can help look more into the why of the distribution instead of just the where. Data on land cover for the state and the distribution of the desert tortoise was obtained and examined for trends in its habitat. While the tortoise was found in most of the desert there were areas that seemed to stand out more than others and areas that were essentially holes in the distribution. Further studies and research will need to be preformed in order to determine how worthwhile using GIS to determine why a species in located in an area but this project showed that GIS being used in this manner has some potential to answer more than just the where. | |||||||||||||||||||||||||||||||||||||||||||||||||||||||||||||||||||||||
|
Introduction For those working in the realm of biological conservation the ability to access maps showing locations and ranges of at risk or endangered animals is of great importance. As GIS is being integrated into more and more aspects of everyday life it has become easier to obtain these distribution maps. Can these distribution maps aid conservationists in determining why or why not a species distribution is where it is? In order to answer this, a species range, in southern California, will be examined and compared to satellite imagery and boundary lines to see if there is a general trend in where a certain species is located. Certain aspects as to why a species is located in a particular location will undoubtedly need greater detail in information than the typical vegetation or land use layer would have, but if it is possible to find trends, it could prove useful as a preliminary way to determine where conservation efforts or study areas should be focused. | |||||||||||||||||||||||||||||||||||||||||||||||||||||||||||||||||||||||
|
Background Habitat destruction is causing harm to many species making it difficult for these species to survive. With the various environmental changes, through human and natural means, many species habitats are being threatened or drastically altered. This is of great concern to those in the realm of biological conservation and many within this realm are striving to do everything they can to mitigate damages done to habitats and the species dependent upon them. One such species is Gopherus agassizii the desert tortoise, which is a vulnerable and threatened species according to the IUCN Red List and is tracked by the Department of Fish and Wildlife. It is a vulnerable species due to many factors that are working against the species survival. The main human impacts on the desert tortoise are habitat fragmentation and direct loss of individuals due to urbanization of the desert and roads running through their habitat. | |||||||||||||||||||||||||||||||||||||||||||||||||||||||||||||||||||||||
| Their natural life cycle is also working against them in that they have a very long slow life cycle, and while they are capable of having several offspring in a single batch of eggs the reproductive events occur only a few times a year, and young have a high mortality rate for the first several years. (Schuman 2013) The typical habitat in which desert tortoises can be found is rocky desert terrain mixed with varying types of desert brush. Extensive modeling on the desert tortoises distribution has been done in an effort to track the species and aid in protecting their habitat. (Nussear et al 2009) This distribution is important in being able to protect the desert toirtoise but the distribution may also show a reason as to why the tortoise is where it is, allowing for better refinement of where to send resources or even open the potential of new locations the tortoise could be transplanted to in order to help stabilize the population. |
| ||||||||||||||||||||||||||||||||||||||||||||||||||||||||||||||||||||||
|
Methods In order to look for trends in desert tortoise locations, data on desert tortoise ranges and land cover or vegetation type needed to be obtained. This data was obtained from the U.S. Geological Survey (USGS). Data on county boundaries and state parks was also obtained for spatial reference from USGS and Calatlas. | |||||||||||||||||||||||||||||||||||||||||||||||||||||||||||||||||||||||
| The land cover data had several different versions of land cover classifications to choose from within the attribute table and the one used for this project was the one that had the greatest number of different land cover definitions in order to maximize the chance of finding specific habitat trends of the desert tortoise. The desert tortoise range data covered both California and Nevada so that information needed to be clipped down to just California, since the land cover data was only for California. The land cover was the clipped to just the areas that consist of the range of the desert tortoise, giving the cell count for each land cover classification. The cell count for the land cover in the desert tortoise range was then compared to the overall cell count for the specific land cover types to see how much of that land cover was being used by the tortoises. |
| ||||||||||||||||||||||||||||||||||||||||||||||||||||||||||||||||||||||
|
Results | |||||||||||||||||||||||||||||||||||||||||||||||||||||||||||||||||||||||
|
|||||||||||||||||||||||||||||||||||||||||||||||||||||||||||||||||||||||
|
Figures and Maps | |||||||||||||||||||||||||||||||||||||||||||||||||||||||||||||||||||||||
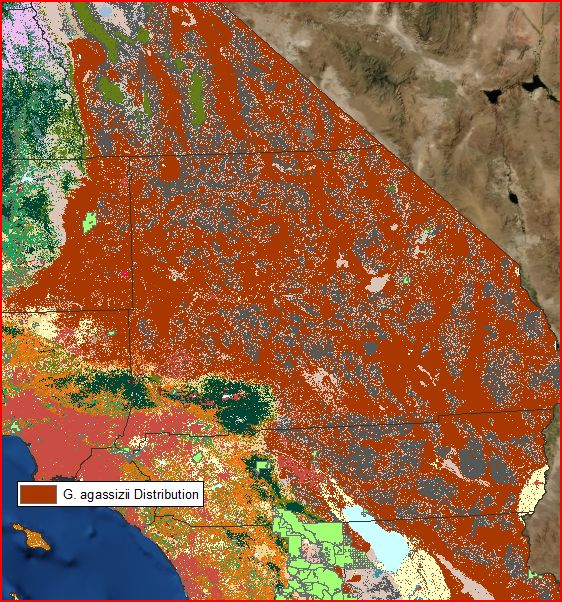 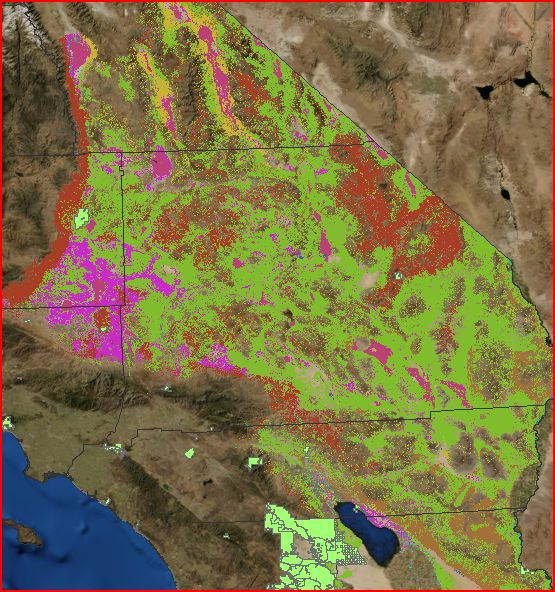 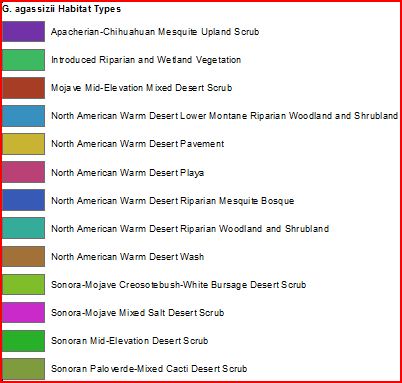 |
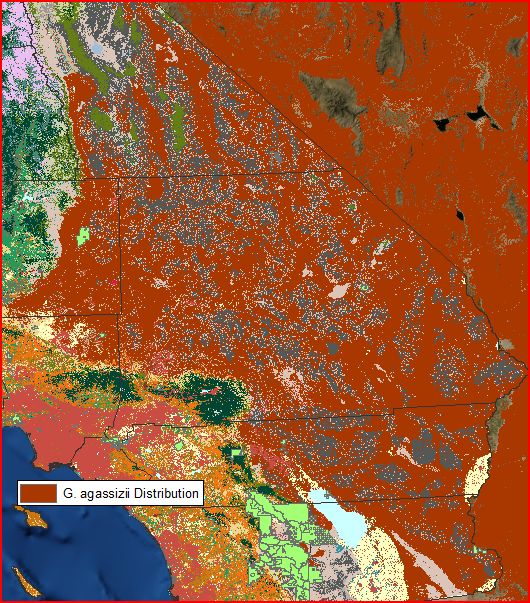
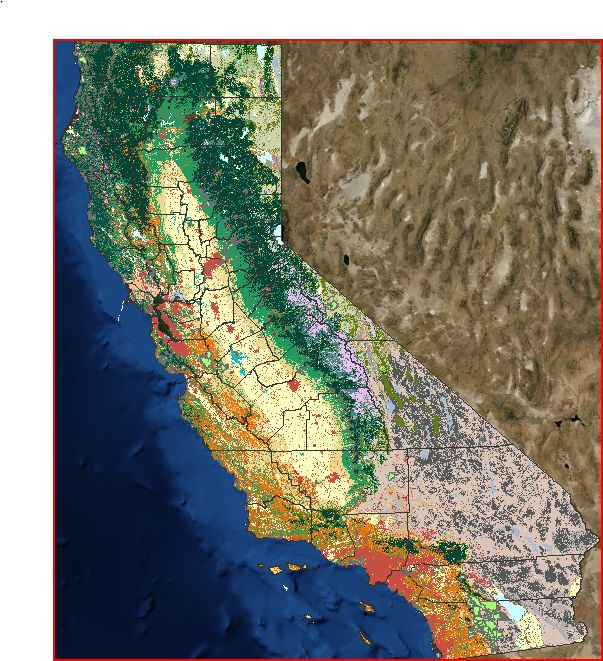
Desert Tortoise distribution in California Habitats within the Tortoise's distribution Habitat Legend | ||||||||||||||||||||||||||||||||||||||||||||||||||||||||||||||||||||||
|
Analysis The predominant land cover in the tortoises range is varying types of desert, most having some form of vegetation or brush, which is consistent with the accepted habitat for the desert tortoise. The most common type of land cover the desert tortoise occupies is the Sonora-Mojave Creosote bush-White Bursage Desert Scrub, which indicates a need to protect desert scrub, like the creosote bush, in order to help protect the desert tortoise. The high percentages of total land cover of that type shows that it is important to protect the tortoise's current distribution because there are not many places that they can be transplanted to improve their survivability. Further studies into additional locations where tortoises could be relocated in neighboring states would be beneficial. It was also interesting to note that there are seemingly holes within the desert tortoise's distribution that mostly consisted of dunes or agricultural land. With the limited data used, it shows that it is possible to show trends as well as show what habitats should be preserved and even show if there is suitable habitat to move a species into. With additional data like rain fall or average temperatures, more trends could possibly be found and a greater depth of why a species can be found in specific areas could be determined. | |||||||||||||||||||||||||||||||||||||||||||||||||||||||||||||||||||||||
|
Conclusions Conservationists are always in need of some way to help them figure out where they should focus their limited resources and time to have the biggest benefit for the species they are trying to save. The desert tortoise is no exception, with their decreasing numbers and habitat destruction it is important to do what is possible to save the species. Obtaining data on the desert tortoise's distribution and looking for habitat trends could prove useful for conservationists looking for a quick way to do an initial assessment. The information gathered here shows that there was a more refined preference in habitat than desert and also showed that there are areas within the desert that are less likely to contain desert tortoises. While further studies need to be done to determine how effective this method is at helping to focus conservation efforts it shows promise in being one way to study reasons why a species is in a particular habitat. | |||||||||||||||||||||||||||||||||||||||||||||||||||||||||||||||||||||||
|
References Nussear, K.E., Esque, T.C., Inman, R.D., Gass, Leila, Thomas, K.A., Wallace, C.S.A., Blainey, J.B., Miller, D.M., and Webb, R.H., 2009, Modeling habitat of the desert tortoise (Gopherus agassizii) in the Mojave and parts of the Sonoran Deserts of California, Nevada, Utah, and Arizona: U.S. Geological Survey Open-File Report 2009-1102, 18 p. <"http://pubs.usgs.gov/of/2009/1102/"> Schuman, R., 2013, Desert Tortoise Ecology: Mojave Desert Tortoise GATF Project <"http://geochange.er.usgs.gov/sw/impacts/biology/tortoise1/"> | |||||||||||||||||||||||||||||||||||||||||||||||||||||||||||||||||||||||
|
| |||||||||||||||||||||||||||||||||||||||||||||||||||||||||||||||||||||||