| Title Population Growth and Prosperity in California, 1990-2000 |
||||||
|
Author
David RobinsonAmerican River College, Geography 350: Data Acquisition in GIS; Fall 2013 |
||||||
|
Abstract
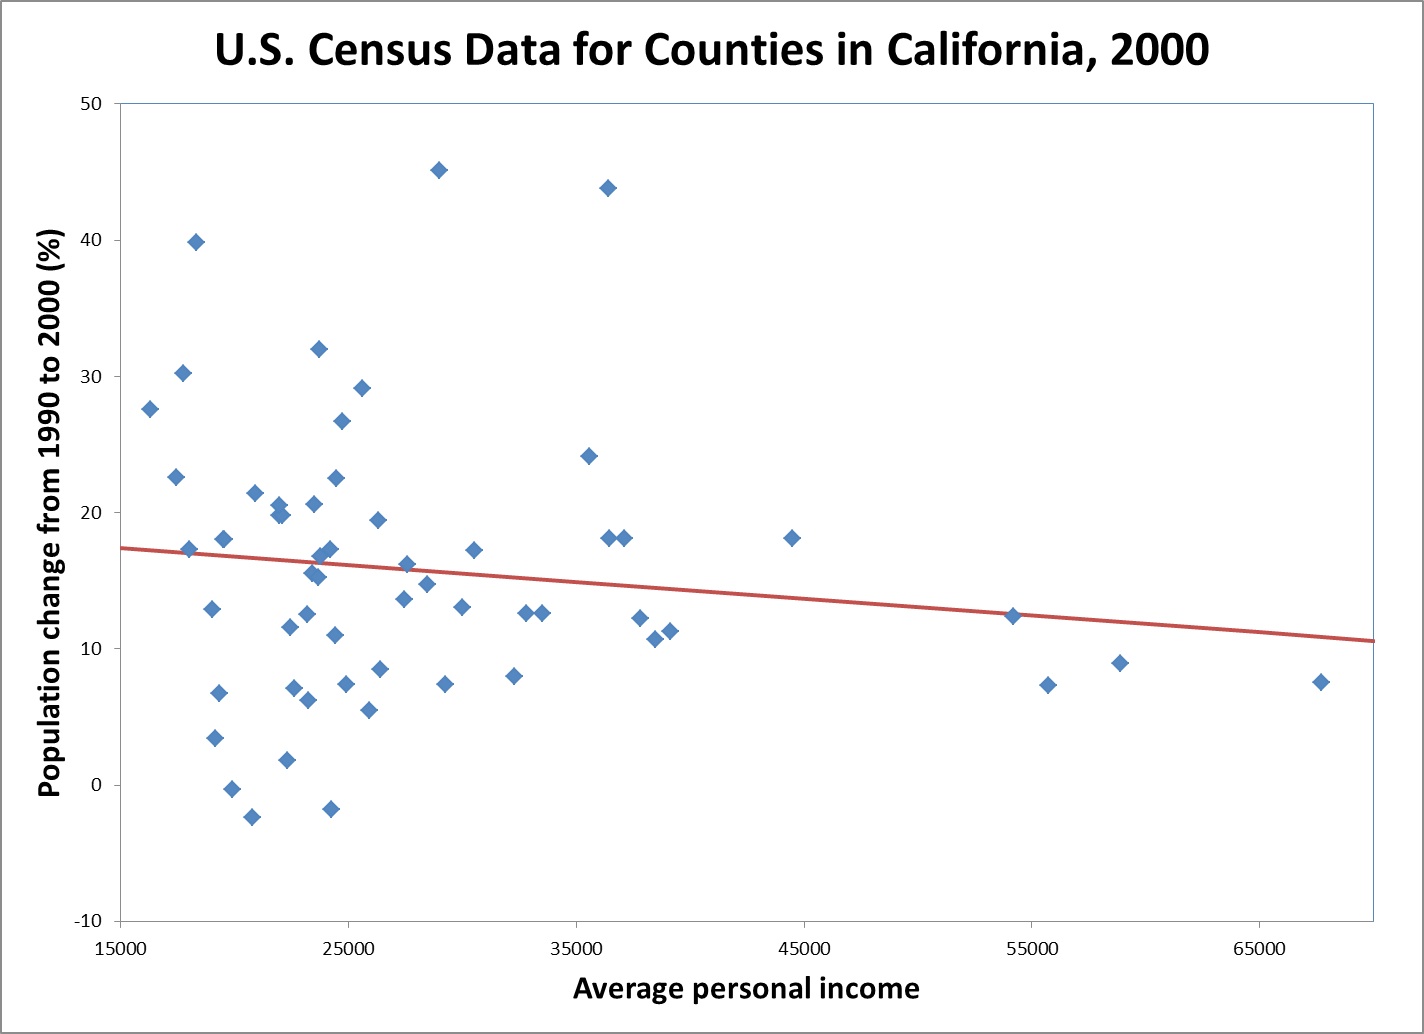
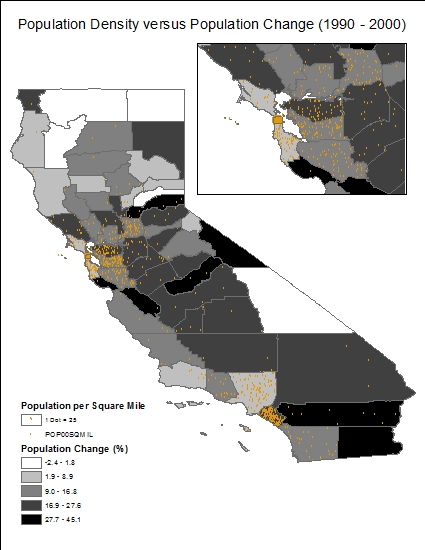
Census data shows no correlation between California population growth
and average income, nor between population growth and population density. |
||||||
|
Introduction
It is a generally accepted fact that no country reaches middle-income
status or higher without significant urbanization.The link between
population growth and urban growth is similarly well-established.
(Annez and Buckley, 2009) However, the link between population growth
and economic growth (if any) is not so clear. Does population growth
result in a dip in prosperity, as too many people compete for a limited
number of jobs? Or does population growth tend to accompany periods of
prosperity, either as cause or effect? This study aims to analyze
California demographic and economic data to see if a correlation
between prosperity and population growth can be found.
|
||||||
|
Background
Every ten years, the U.S. Bureau of the Census conducts a survey of the
U.S. population to provide the basis for apportioning representatives
and taxes, according to the U.S. Constitution. Demographic data collected
includes population and population density, ethnicity, marital
status,
age ranges, persons per household, and other fields. The Census also
collects economic data at 5-year intervals. (US Bureau of the Census, 2013) The historical connection between urban growth and population growth has been documented extensively and is quite strong. (UN-HABITAT, 2011) Industrialized (and therefore urbanized) nations are not only more populous than non-industrialized nations, they are typically more prosperous as well, both as a nation and looking at the average citizen's income. (Annez and Buckley, 2009) |
||||||
|
Methods
I began my search for economic and demographic data with the US Census
website, downloading shapefiles and geodatabases from the TIGER
database. Unfortunately, I found that the data was hard to interpret;
some datasets were lacking basic fields such as total population of
a block group, county, or other geopolitical unit. One
shapefile contained
multiple errors: several counties were given the name and demographic
data for a different county, including two California counties (Santa
Cruz and Nevada). Given that the TIGER demographic data was
unreliable, I chose to use census data from the National Atlas
website
instead. I chose to focus on the following attributes from 2 datasets: population per square mile, population change from 1990 to 2000 (expressed as percentage), and per capita income. I used Microsoft Excel to compare population change versus income and create a regression line, DataDesk to calculate regression statistics, and ArcMap to map the two attributes. I repeated the process to compare population per square mile versus income, and again with population density versus population change. |
||||||
|
Results
|
||||||
|
Analysis
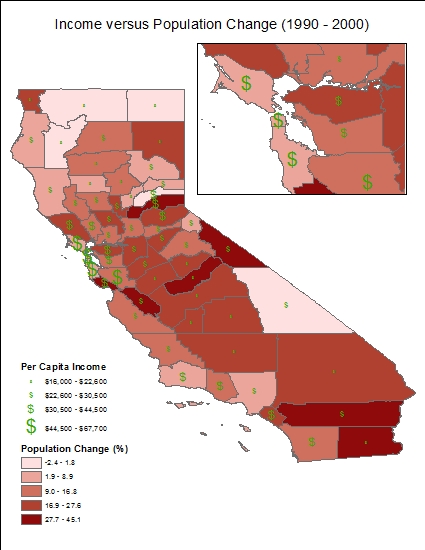
As expected, there is a clear correlation between population density
(which itself correlates to urbanization) and per capita income
(p<0.0001). This is consistent with previous data linking
density to urbanization, and urbanization to increased prosperity. Although the map shows a slight correlation between population growth and per capita income, the relationship is not statistically significant (p=0.3). With as much as a 30% chance that the results are coincidence, we cannot draw any conclusions linking population growth to economic prosperity (or depression, as what little correlation there is is negative). There is no significant correlation between population growth and population density (p=0.4). |
||||||
|
Conclusions
The goal of the analysis was to determine whether any link exists
between population growth (or decline) and economic prosperity (or
depression), or between population growth and population density. With
no significant correlation existing between either, we can conclude
that population growth at this particular time and place was not driven
by an economic boom, nor did it cause one; however, the sample size is
too small to draw generalized conclusions. The lack of correlation
between density and growth suggests that urban areas do not grow
significantly faster than rural areas, although the sample size is
again too small to confirm this conclusion. Further studies focusing on
diffierent geographical areas and decades might yield better results. The analysis's secondary goal was to confirm our assumption (based on previous papers) that per capita income increases in areas with high population density; this part of the study was successful, as these two factors were strongly correlated. |
||||||
|
References
|
||||||
|
Annez, Patricia Clarke and Buckley, Robert M., 2009. Urbanization and Growth: Setting the Context. http://www2.lawrence.edu/fast/finklerm/chapter1urban.pdf Last accessed: 2013.12.17 National Atlas of the United States, 2013. US Data Downloads. http://nationalatlas.gov/atlasftp.html Last accessed: 2013.12.13 UN-HABITAT, 2011. Cities for All: Bridging the Urban Divide. State of the World's Cities 2010-2011. US Bureau of the Census, 2013. About Us. http://www.census.gov/aboutus/ Last accessed 2013.12.17 Working Group on Population Growth and Economic Development, Committee on Population, 1986. Population Growth and Economic Development: Policy Questions. National Academy Press: Washington, D.C. |