| Title Obesity vs. Diabetes Rates in the U.S. | |
|
Author Jason Shillinsky American River College, Geography 350: Data Acquisition for GIS; Fall 2013 Contact Information (2873 Stony Creek Circle, Acampo, CA. 95220, 209.200.2724, jshillinsky@gmail.com) | |
|
Abstract Obesity is a rising health concern in the U.S. Many organizations, including the Federal Government, are researching the many issues associated with it. Diabetes is an expensive and life altering disease associated with obesity. This project will map the rates of obesity and diabetes and attempt to show a direct correlation between the two. | |
|
Introduction Both obesity and diabetes have been on the rise in the United States for many years. One of the key factors in the contraction of diabetes is being obese. Is there a correlation between rising obesity rates and rising diabetes rates? I shall map the rates and see for myself. Mapping the rates will be a simple matter of joining a table of the rates to a shapefile of the individual states. Where the work comes in here, is the data. Data will be used from several sources and a determination will be made as to how to show the individual state rates. | |
|
Background In the U.S. 35.7% of adults are obese (FRAC, 2012). There are many contributing factors to obesity, including lack of exercise, work, fast food, transportation, TV watching, affluence and poverty (Roland Sturm, Ph.D, 2005). Obesity is considered the number one health risk for children (Research America, 2013). Diabetes has stricken 8.3% of the U.S. population (Diabetes.org, 2010). Diabetes care amounted to $174 Billion in 2007 (Diabetes Report Card, 2012). For contrast, the entire budget for the state of California was $142 Billion in 2012 (Department of Finance, California, 2012). | |
|
Methods In my research, I discovered several things about health data. In general, there are many different sources for data. There appears to be an advocacy group for every disease of note. However, all sources seem to refer to the U.S. Centers for Disease Control (CDC). So let's look at the CDC's data. The only complete set of data for both the obesity rate and diabetes rate was 2010. Both the obesity rates and diabetes rates were for adults only. Apparently children are thought of as a seperate categary, for an unspecified reason. For obesity figures, one is obese at or above a Body Mass Index (BMI) of 30. The BMI calculation is weight (lb) / [height (in)]2 x 703. For diabetes, I only used diagnosed diabetes. I excluded figures that included "pre-diabetes" or "undiagnosed" diabetes; which use fasting blood sugar levels and levels of a chemical marker. The CDC collects its data using "The National Health and Nutrition Examination Survey" (NHANES). The NHANES is an annual voluntary questionaire, interview and physical examination given to 7,000 randomly selected participants across the nation. For obesity and diabetes rates by state, the Behavioral Risk Factor Survailance System (BRRFSS) conducts random phone surveys of adult participants in the NHANES. That random sample is then calculated and applied to the entire state. | |
|
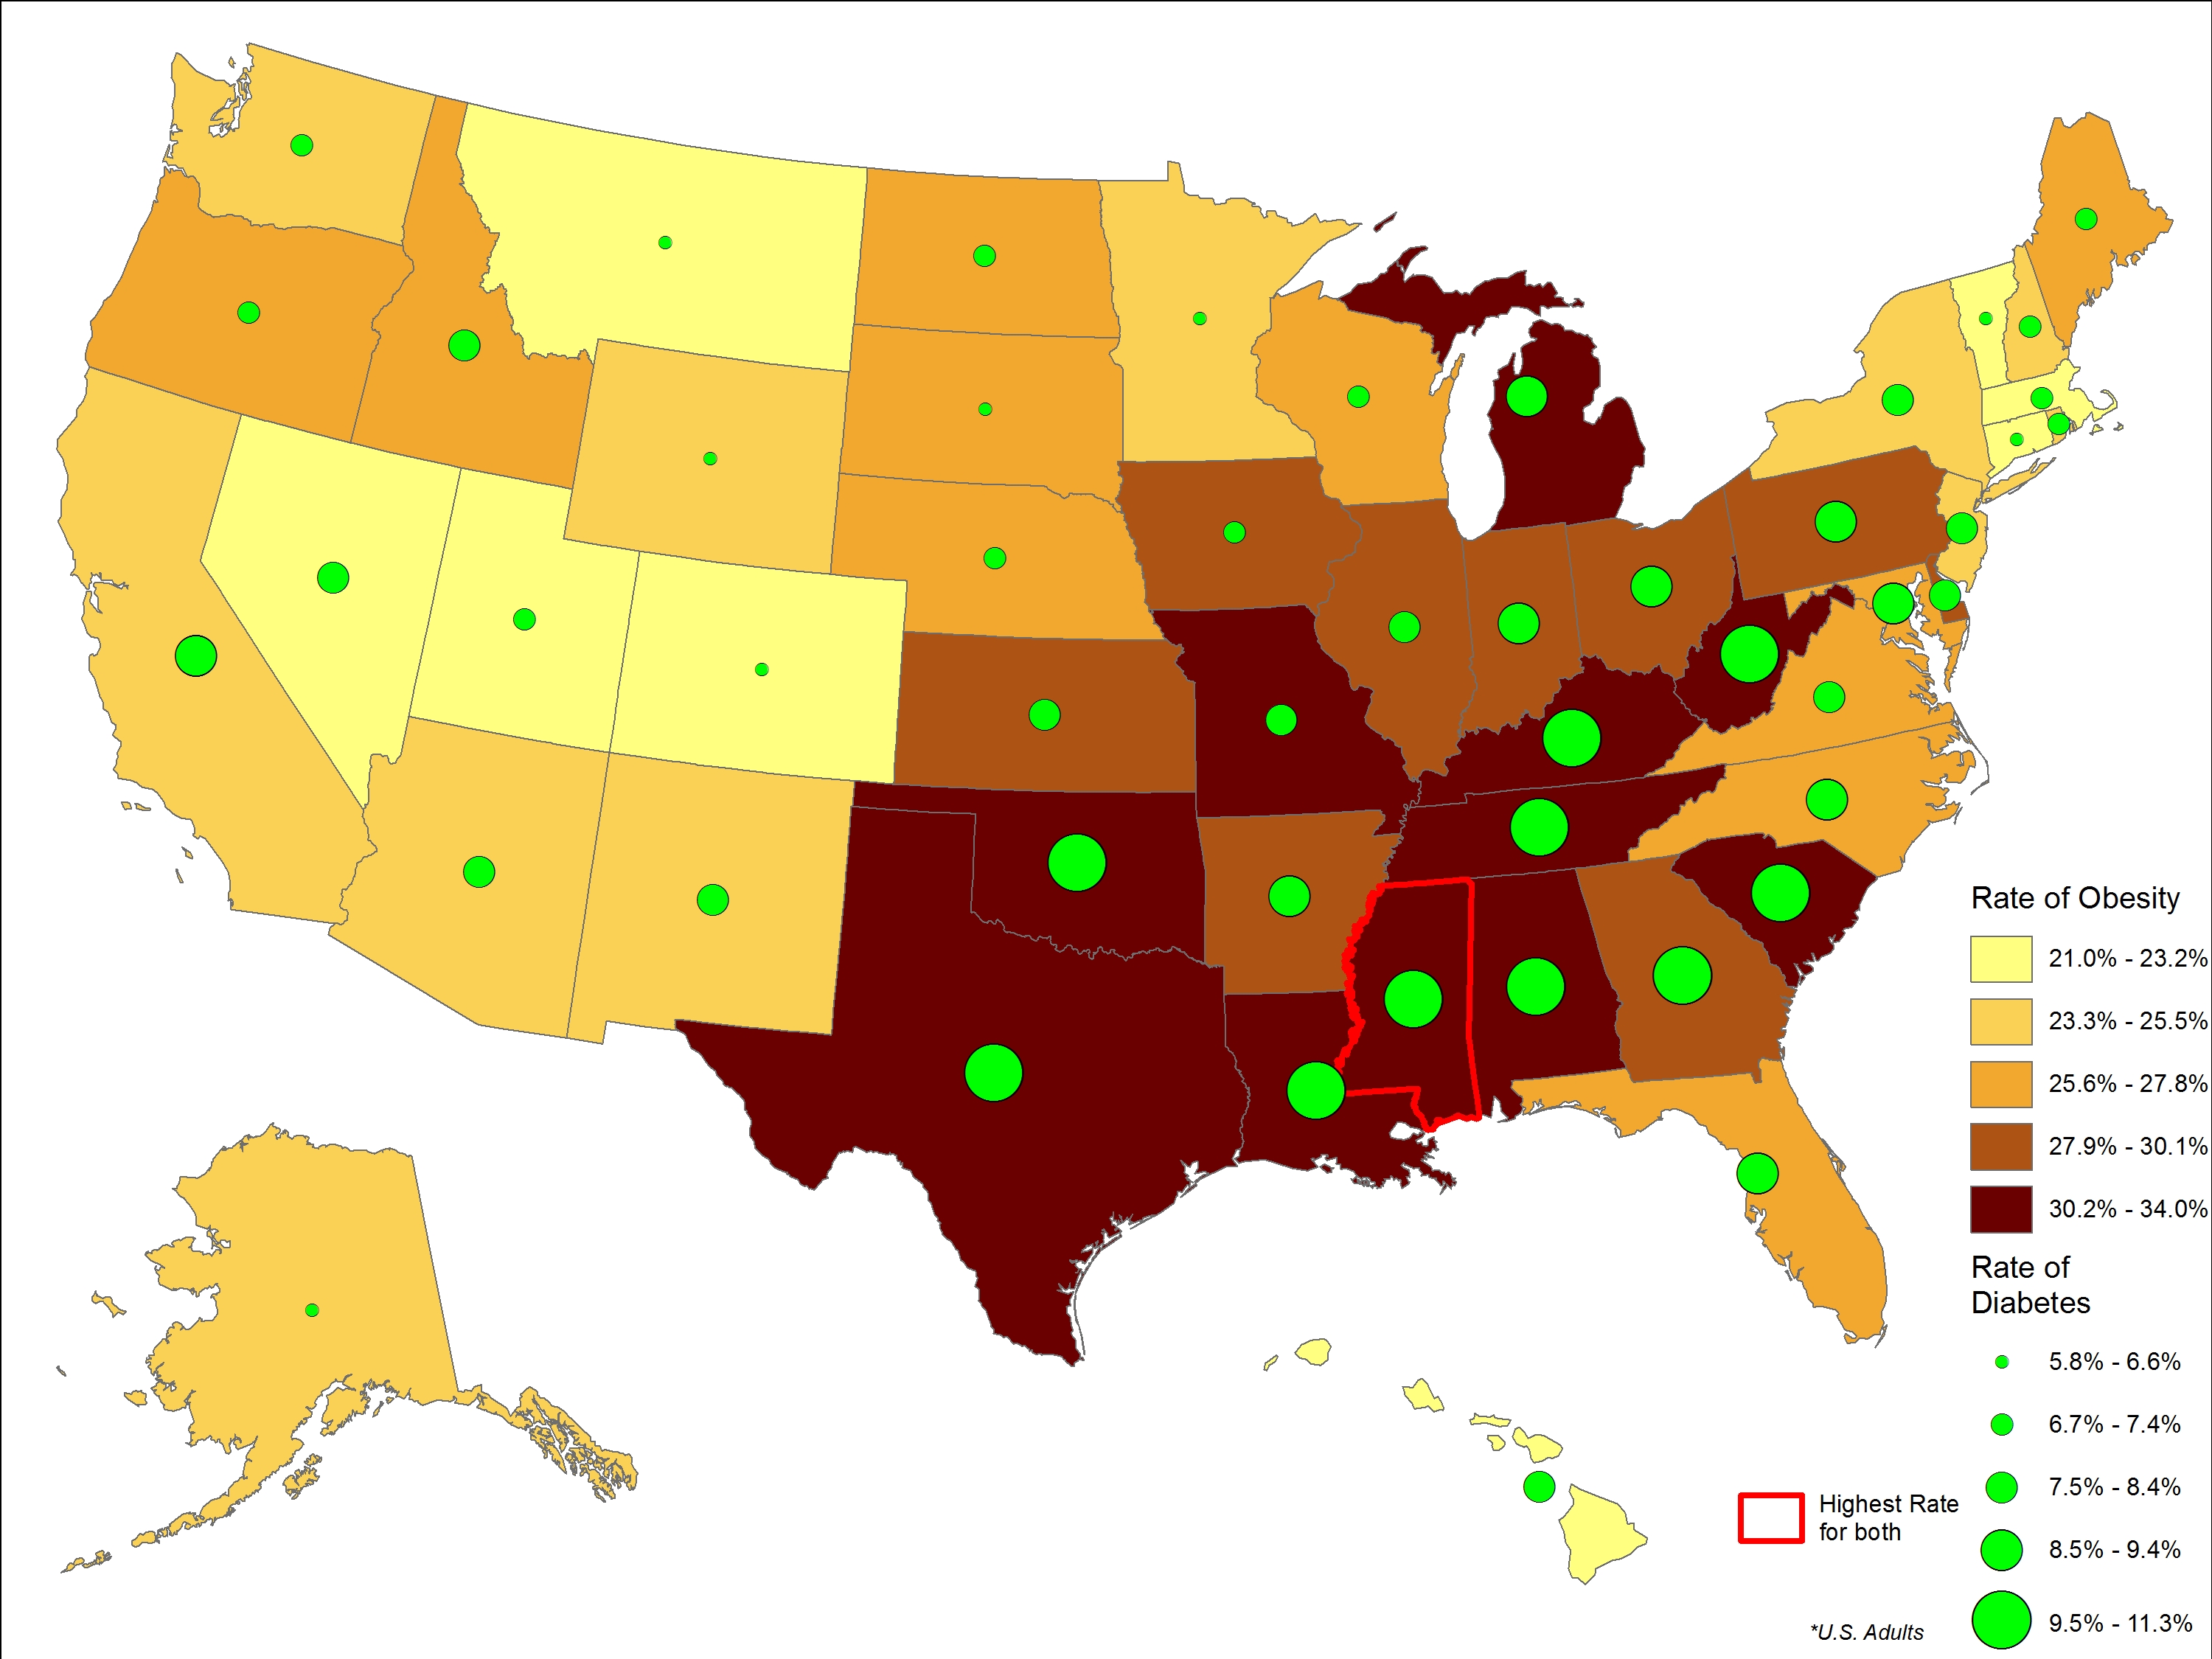
Results I started with a shapefile of the U.S. available from the Census Bureau and used the Lambert Conformal Conic projection, the preferred projection for display of the U.S. I then created an Excel spreadsheet of the state rates and added them to the map. I joined the tables to the shapefile and created a choropleth map for obesity. Finally I added in the diabetes rates as graduated symbols. The resulting map does show a correlation between obesity rate and rate of diabetes. In fact, one state, Mississippi, is highest for both. (Colorado lowest for obesity, 2nd lowest for diabetes) | |
| |
|
Analysis I started with the scope of the project. The subject matter was so vast, that I decided that the scope must stay very narrow and focus only on the state rates. I was pleasantly surprised to see an abundance of sources for this project. From government agencies to private corporations, the number of sources was incredible. I quickly learned, however, that these organizations all rely upon the CDC for their figures. And rightly so, the amount of effort involved in the collection and tabulation of this data is enormous. It wouldn't be cost effective to collect your own data, especially since the CDC data is free to obtain. I also noticed that this data was often sliced into subgroups and subgroups of subgroups. I encountered a couple of interesting anomoles in my research. One theory on obesity is that the poor seem more likely to be obese. This is a prevalent theory today, however, one study shows no clear connection with being poor and being obese, except in certain subgroups. In fact, among white men, the middle-class are most likely to be obese. I also encountered a global obesity map. My focus was the U.S., but I found the data compelling. On the island of Hispaniola, the western one-third is the country of Haiti, the eastern two-thirds is the Dominican Republic. The obesity rate of Haiti is 8.4%, while the Domincan Republic has a rate of 21.9%. The major difference between the two nations, Haiti's GDP is $13 billion, while the Domincan Republic's is a whopping $59 billion. Not part of my project, but interesting. | |
|
Conclusions The topics of obesity and diabetes are vast. The opportunities for discussion, research and analysis are far and wide. What does seem clear, both from my reading and from my map, is that loosing weight will help keep away diabetes, as well as a number of other ailments and diseases. | |
|
References National Center for Chronic Disease Prevention and Health Promotion, 2012, Diabetes Report Card, Centers for Disease Control and Prevention Sturm, Roland, Ph.D, 2005, Obesity and Poverty in America:time and demogrphic trends, Rand Health White House Task Force on Childhood Obesity, 2010, Solving the Problem of Childhood Obesity within a Generation Food Research and Action Center Diabetes Information at the CDC Obesity Information at the CDC | |