 Figure 1
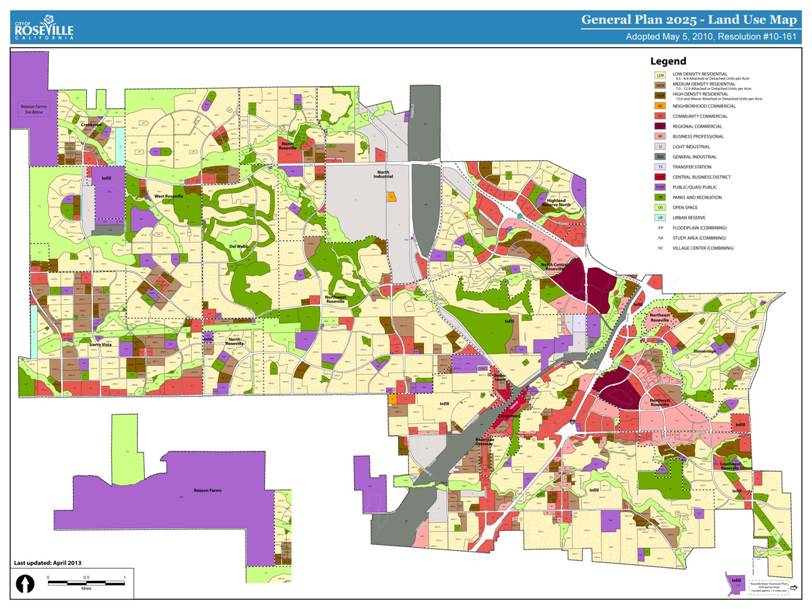
General Plan 2025 – Land Use Map
Title
Has the City of Roseville adhered to their General Plan 2025?
Author
Ann L. Tolman
American River College, Geography 350: Data Acquisition in GIS, Fall 2013
Abstract
As the population for the City of Roseville has increased, so has the need for urban development including residential neighborhoods and commercialization. As urban development increases, land must be built upon. State law requires open space and conservation issues including the preservation, management, and efficient use of open space and natural resources. By performing a classification on land cover, I was able to provide detailed assessments on whether or not the City of Roseville has adhered to their General Plan 2025.
Introduction
Previous planning of urban development is already configured prior to construction. This paper will assess whether the City of Roseville has followed their General Plan 2025 in regards to Land Use. The study will assess whether the preservation of natural wetland and habitat preserves has been adhered to according to their General Plan. A reclassification of historical imagery will be completed to calculate four types of Land Use including Soil, Grass, Trees, and Urban.
Background
As a new resident residing in Roseville for the last 5 years, I had noticed how much construction of new housing developments was taking place. My previous job was in the housing construction business, specifically drywall. My current job, an engineering consulting firm, performs environmental assessments and much is dealt with endangered species of plants and animals, watersheds and habitats for plants, animals, fish, and bugs. As all the construction was taking place, I was very interested in the land that the new construction was taking place on. I wanted to find out how much loss of habitat was taking place. I visited the City of Roseville offices and was directed to the General Plan 2025. The area that my concentration was West Roseville, more specifically West Park and Fiddyment Farms. I was able to acquire much information on their website for the General Plan 2025, however the information was all in PDF format. My original goal was to determine how much loss in habitat there actually was in this area. However, it was difficult to attain quality historic data and imagery to compare what the areas looks as of today. So instead I turned my focus more towards whether or not the City of Roseville has so far adhered to their General Plan 2025. To do this I still needed data and imagery but I did not need to go back as far.
The City of Roseville General Plan serves as a long-term policy guide for physical, economic, and environmental growth. It is a statement of the community's vision of its ultimate physical growth. State law requires that every county and city prepare and adopt a comprehensive long-range plan to serve as a guide for the development of the community. City actions, such as those relating to land use allocations, annexations, zoning, subdivision and design review, redevelopment, and capital improvements must be consistent with the General Plan. The General Plan also designates land use categories for the entire city. Each land use category is identified and defined within the General Plan and includes information on the general uses, development, intensity, siting and compatibility standards. General Plan 2025 was adopted by the City Council on May 5, 2010.
Roseville’s first General Plan, consisting basically of a land use map, was adopted in 1963. The first comprehensive General Plan for the City was adopted in 1977. While various elements were updated since 1977, the 1992 General Plan represented the first comprehensive update since that time. Although no new land uses were allocated beyond those identified in the precious General Plan, the 1992 Plan did result in substantial policy revisions. The Plan land use allocation has been modified by the City Council several times since the 1992 update with the adoption of several additional Specific Plans as the city grew. This included a wastewater treatment plant and business park. However, although land use has changed, the core policies of the 1993 update were retained.
The City of Roseville is located on the Interstate 80 corridor, approximately 16 miles northeast of downtown Sacramento, California. This places the City in the northeast fringe of the Sacramento Metropolitan area. Located within Placer County, Roseville is the largest city within the County.
The first residents in the area were the Maidu Indians. Their territory extended from the Sacramento River to the Sierra Nevada. Of the two principal divisions that made up the Maidu nation, the southern Maidu controlled the entire American River drainage area, the Bear and Yuba Rivers, and the area now encompassed by the City of Roseville.
Outside exploration of the region was first recorded in the early 1800's. This included early fur trapping explorations. The discovery of gold in 1848 brought over 10,000 people to Placer County. By the 1850's, miners failing to find promised riches began turning to other pursuits, such as farming. Disgruntled miners and pioneer ranchers formed the nucleus of the first families who settled the area before it became known as Roseville.
On November 29, 1863, during construction of the transcontinental railroad from Sacramento to Promontory, Utah, railroad graders reached “The Junction.” The original map of the City was filed with the Placer County Recorder on August 13, 1864, titled “Plan of the Town of Roseville at the Junction of the Central Pacific and California Railroads.” Between 1870 and 1906, small frame buildings and roughhewn board sidewalks sprang up. A school was built; churches and fraternal organizations were established; and efforts were made to stimulate industry, first by the establishment of a flourmill and later a winery.
In April of 1908, the Southern Pacific Railroad Company officially moved its terminal, roundhouse and shops from Rocklin to Roseville. This move brought many jobs and residents to the community. After the railroad’s relocation, an organized drive for incorporation began. On April 2, 1909, by a vote of 241 to 90, the people voted in favor of incorporation. Roseville became a Charter City on January 10, 1955 and, on March 26, 1964 during the City’s 55th anniversary, Roseville was honored as an All American City. In 009, Roseville celebrated its 100th anniversary and was honored to win the Governor’s Trophy with its entry into the Rose Parade.
Today Roseville has evolved, from what was considered a “bedroom community” in the 1970's, to an emerging urban center with a mix of residential and employment uses. As of January 2011, the City’s population was estimated at 120,593 and is expected to exceed 175,000 at build out. In addition, the City has attracted a significant amount of non-residential growth including commercial, office and industrial development. It is anticipated that Roseville, along with the remainder of the South Placer/Sacramento Region, will continue to be the focus of significant development activity.
The City is characterized by a mix of older and newer development. Roseville has generally grown outward from its historic downtown adjacent to the Southern Pacific railroad yard. The center of the City is typified by the downtown and small lot, single-family residences, while newer commercial and office development and larger suburban-type residences characterize the edges of town. The current focus of new development is along the eastern, western and northern portions of the community within the City’s thirteen specific plan areas and the North Industrial area.
As a new resident residing in Roseville for the last 5 years, I had noticed how much construction of new housing developments was taking place. My previous job was in the housing construction business, specifically drywall. My current job, an engineering consulting firm, performs environmental assessments and much is dealt with endangered species of plants and animals, watersheds and the preservation of natural habitats, both aquatic and terrestrial. As all the construction was taking place, I was very interested in the land that the new construction was taking place on. I wanted to find out how much loss of habitat was taking place. I visited the City of Roseville offices and was directed to the General Plan 2025. The area that my concentration was West Roseville, more specifically West Park and Fiddyment Farms. (See Figures 1, 2, and 3)
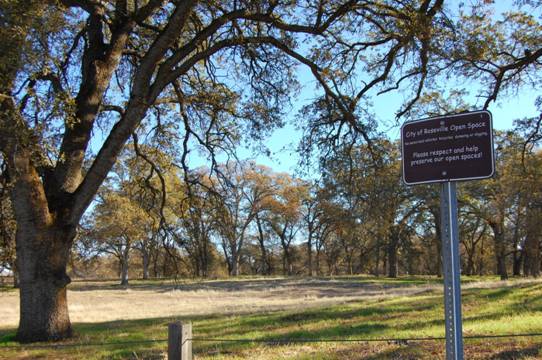
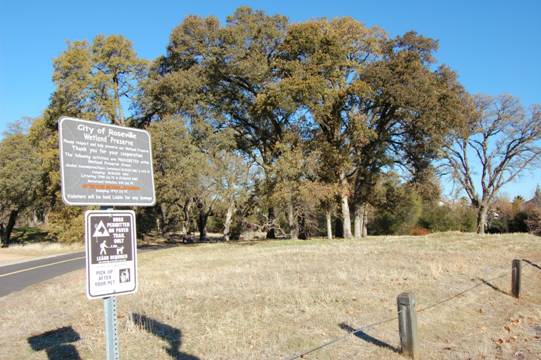
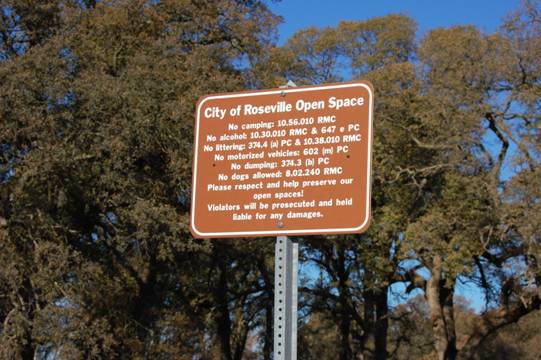
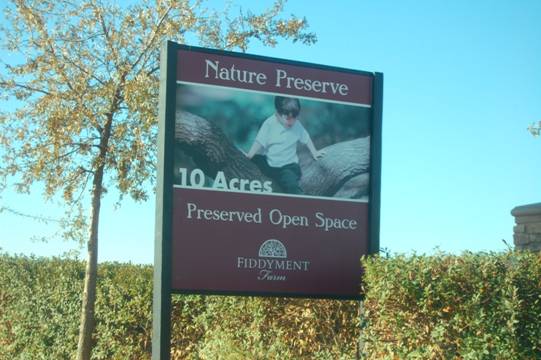
State law requires each general plan to address open space and conservation issues including the preservation, management, and efficient use of open space and natural resources. State law is also addressing the issue of Climate Change, in terms of both the cause and the potential effects. Natural resource conservation has been identified as one of the most effective ways to counteract the effects of global warming.
It is an overall goal for the City of Roseville Open Space and Conservation Element to preserve a comprehensive interconnecting system of open space, encompassing preservation and enhancement of natural habitat and significant resource areas, for the use, appreciation, and enjoyment of the community.
Figure 1
General Plan 2025 – Land Use Map
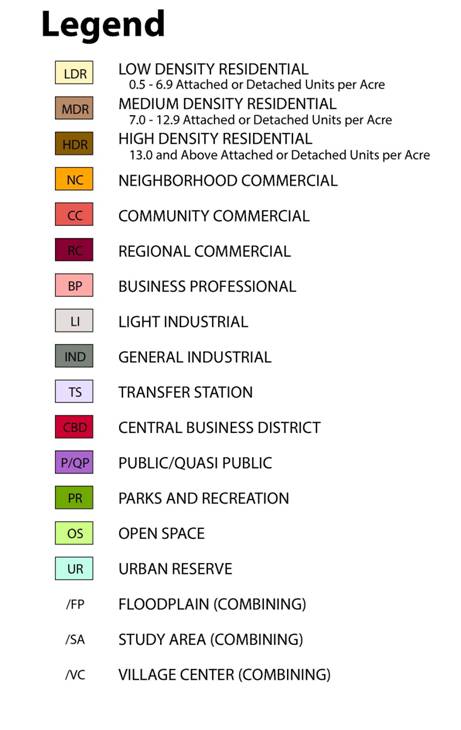 |
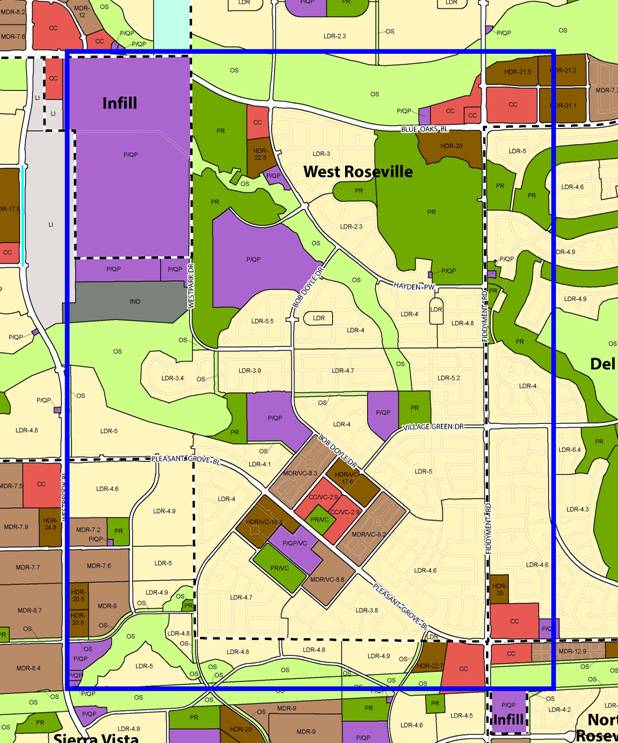 Figure 3
West Roseville Land Use Plan (within blue border)
(use Figure 2’s Map Legend)
Methods
I was able to acquire much information on the City of Roseville website for the General Plan 2025, however the information was all in PDF format (as shown in above figures). My original goal was to determine how much loss in habitat there actually was in this area. However, it was difficult to attain quality historic data and imagery to compare with how the areas looks as of today. So instead I turned my focus more towards whether or not the City of Roseville has so far kept to their General Plan 2025. To do this I still needed data and imagery but I did not need to go back as far.
The City of Roseville General Plan 2025 information was first acquired, specifically their Land Use Plans for West Roseville area. Historical imagery was acquired from the Department of Fish and Game in CIR 3-Band and NAIP 4-Band. Imagery from four different years was acquired (2005, 2009, 2010, and 2012). The imagery was for all of California, whereas only a small portion of area was needed. Once the area needed was zoomed into, just the data frame plus the data within the frame was clipped out. The raster size was adjusted to a maximum of 4100 rows. The bands were then adjusted to reflect proper band coloring.
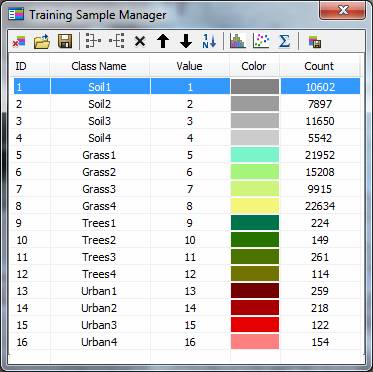
The CIR_2005 image was the used as the base map for all other images; to view the change over time. Using the Image Classification Toolbar, 16 polygons were drawn to be used for the training samples; 4 each for Soil, Grass, Trees, and Urban. The spectral signatures were evaluated to confirm high quality signatures were created. High quality signatures consist of a single bell-shaped histogram, small standard deviations, and variances for each band. Once all spectral signatures were created and individually evaluated, the entire set of spectral signatures evaluated by using the Dendrogram Tool and the Spatial Analyst Toolbox. The dendrogram was saved as an output text file. The dendrogram was a helpful tool to evaluate an entire set of spectral signatures. It provided a useful method to quickly review and identify where potential confusion may occur between spectral signatures.
Once the spectral signature file was created and evaluated, then a supervised classification was performed. The Maximum Likelihood Classification option in the Image Classification Toolbar was used. The clipped image and data were used as the input image. The spectral signature file that was created, from the training samples, was also used in this task. The output was saved as an image file. The output image contained randomly selected colors for the spectral classes previously created. Due to the random coloring of the image, reclassification of the spectral classes was performed. The individual classes that represented the same land cover type (Soil, Grass Trees, and Urban) were then recoded using the Reclassify tool in the Spatial Analysis Toolbox. Hence, the 16 different polygons used to create the spectral signatures were reclassified into 4 unique values. Each value represented one of the unique land cover types in the classification scheme and colors were assigned for each classification in the symbology tab.
Once the reclassification of the imagery was completed, it was then compared to the City of Roseville General Plan 2025 to confirm whether or not the City of Roseville adhered to their General Plan and the construction of urban development and the preservation of wetlands and habitat preserves.
Results
My initial approach of acquiring historical data and imagery was taking weeks for me to complete. I acquired so much data and imagery that I began to get overwhelmed with the amount of data I had and I was then not able to ascertain as what data I should use. I finally narrowed my data and I chose imagery from Department of Fish and Game for four (4) different years from 2005 to 2012.
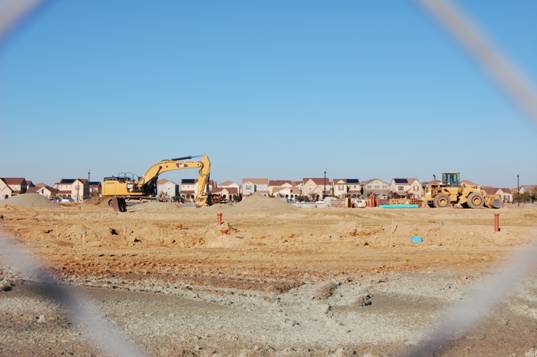
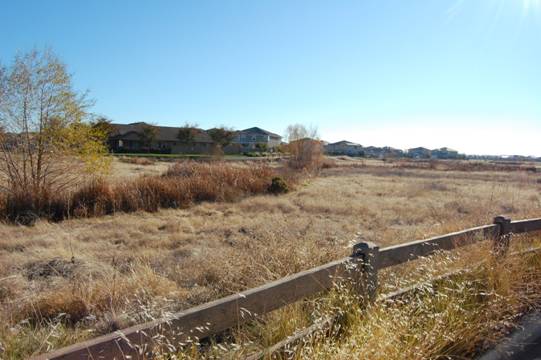
 The City
recognizes that open space land is limited and that valuable resources must be
conserved wherever possible. For many in Roseville, the City's open space
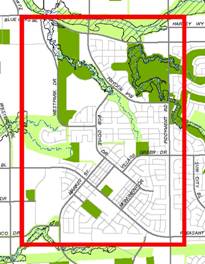
setting is a highly valued natural resource. (See Figures 4 and 5)
The City
recognizes that open space land is limited and that valuable resources must be
conserved wherever possible. For many in Roseville, the City's open space
setting is a highly valued natural resource. (See Figures 4 and 5)
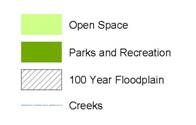
Figure 4
Open Space Areas (West Roseville - within red border) and Legend
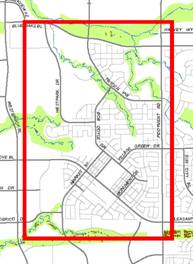
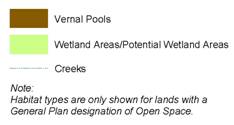
Figure 5
Habitat Types (West Roseville - within red border) and Legend
Each year of imagery was put through a detailed amount of Image Classification. The same Training Samples was used for all years.
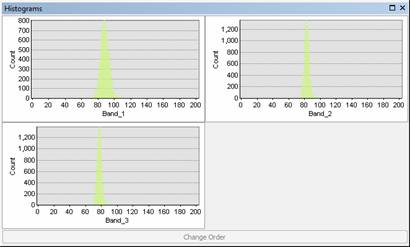
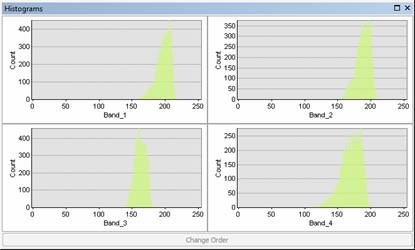
To verify that I had good training samples, histograms and statistics were performed for each year specifically for Grass3. Dendrograms were also performed for each year. These steps were to ensure that I created good training samples.
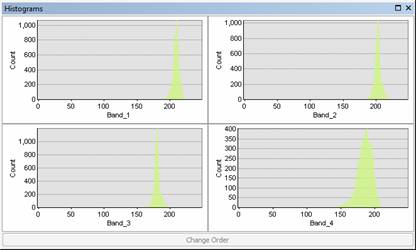
 2005
Histogram for Grass3 2009
Histogram for Grass3
2005
Histogram for Grass3 2009
Histogram for Grass3
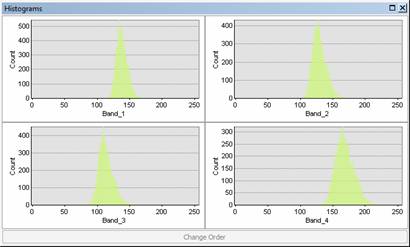
2010 Histogram for Grass3 2012 Histogram for Grass3
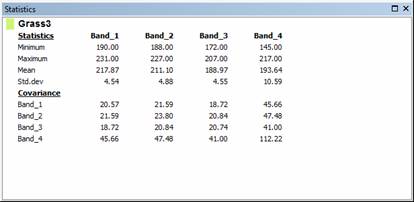
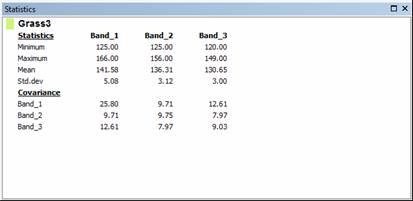
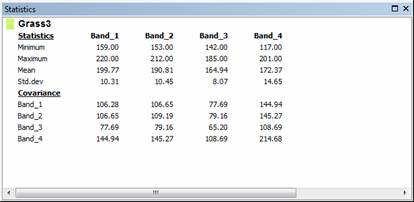 2005
Statistics for Grass3 2009
Statistics for Grass3
2005
Statistics for Grass3 2009
Statistics for Grass3
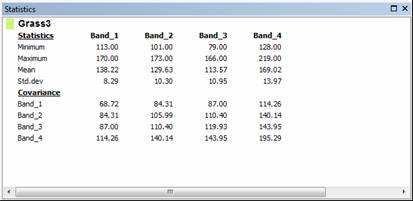
2010 Statistics for Grass3 2012 Statistics for Grass3
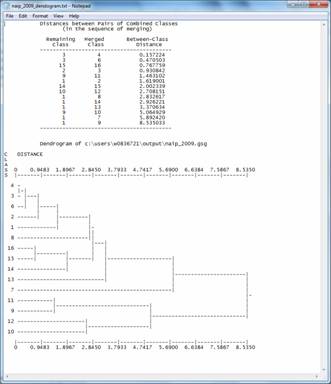
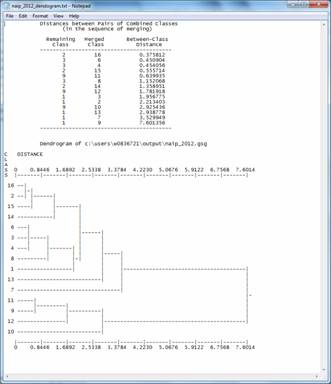
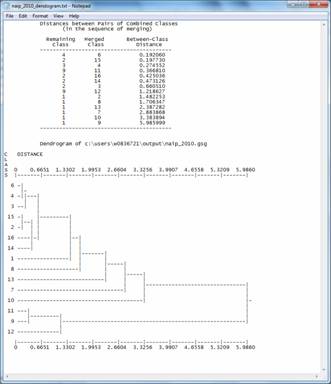
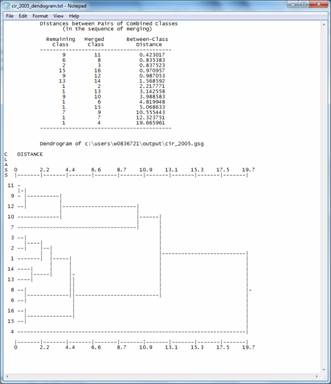 2005 Dendrogram 2009
Dendrogram
2005 Dendrogram 2009
Dendrogram
2010 Dendrogram 2012 Dendrogram
Once I verified that my training samples for each year were good, I then performed a Supervised Classification using the Maximum Likelihood Classification. The results for each year are as follows (Note: the color scheme is chosen at random by ArcGIS).
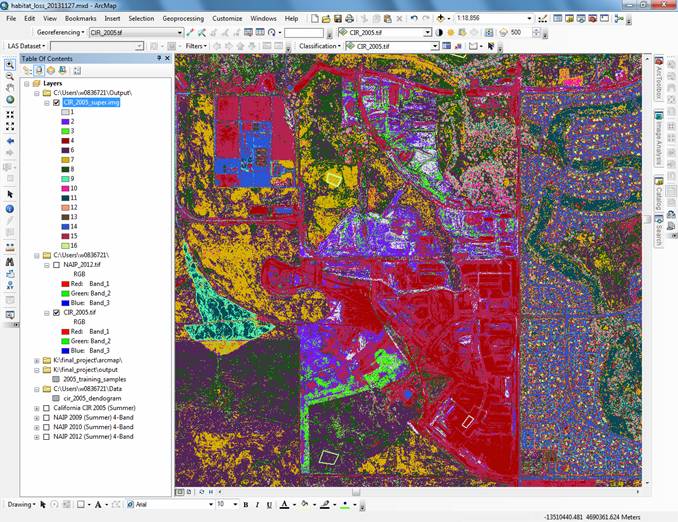
2005 Supervised
Classification
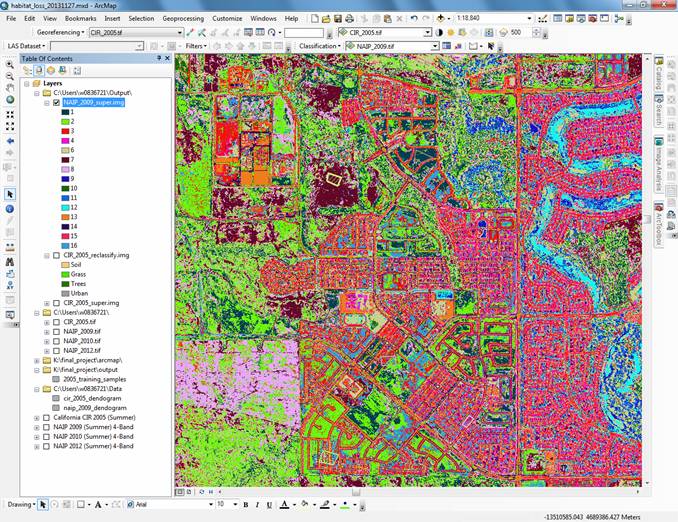
2009 Supervised Classification
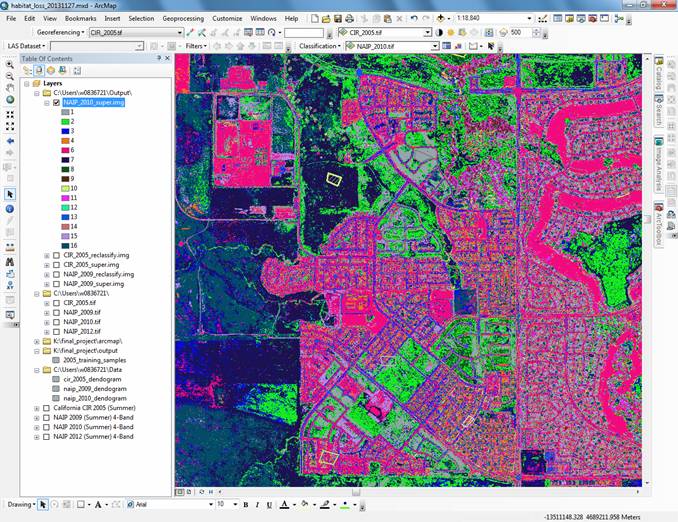
2010 Supervised Classification
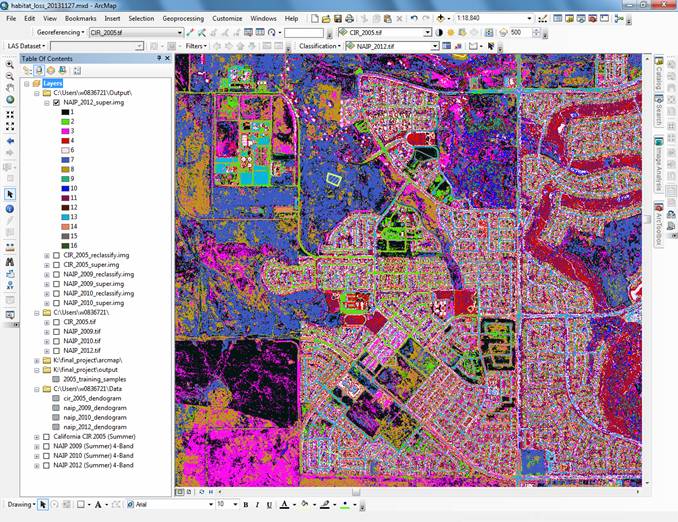
2012 Supervised Classification
Due to the variety and complexity of colors, it is very hard to decipher what is what. So I took this classification one step further and reclassified the spectral classes.
|
Spectral Class Number |
Information Class Number |
|
1-4 |
1 – Soil |
|
5-8 |
2 – Grass |
|
9-12 |
3 – Trees |
|
13-16 |
4 – Urban |
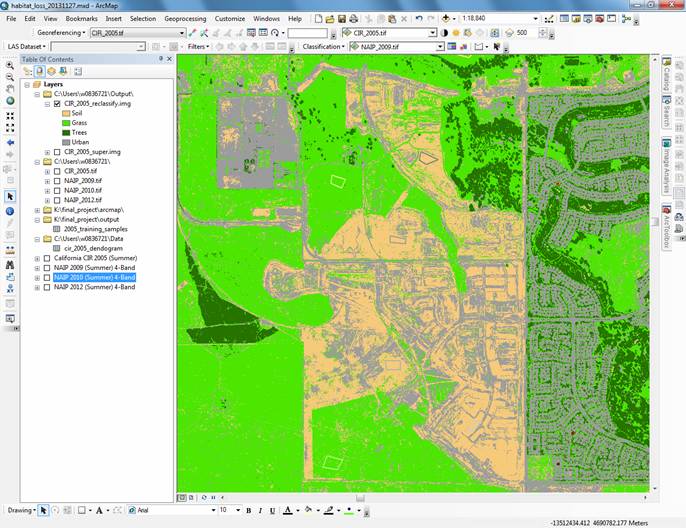 Below are the
2005 and 2012 Reclassifications as comparisons:
Below are the
2005 and 2012 Reclassifications as comparisons:
2005 Reclassification
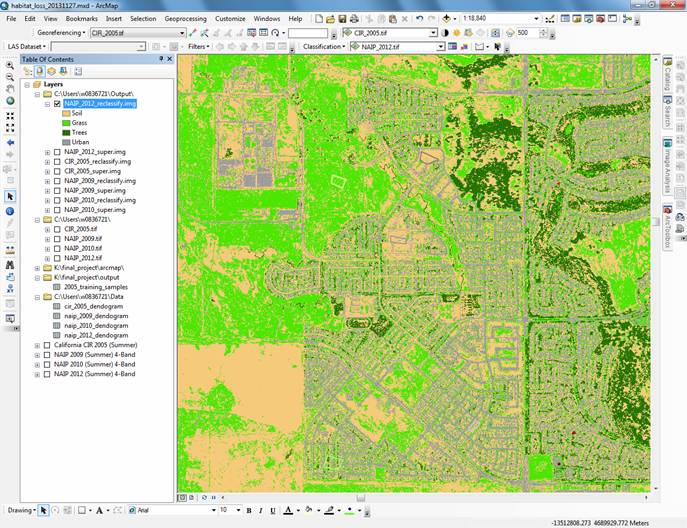 2012
Reclassification
2012
Reclassification
Analysis
I felt I had wasted precious weeks gathering data and imagery that I did not use. Instead I would have rather wanted that time to recode “localized misclassifications”. By this I mean that some data that came back as urban in the soil area was not urban but actually soil or grass. This method to recode “localized misclassifications” would have been performed for each year, and I believe my results would have been a more true representation of the actual land cover.
Conclusion
Urban development has again commenced since the construction housing crash 10 years ago.
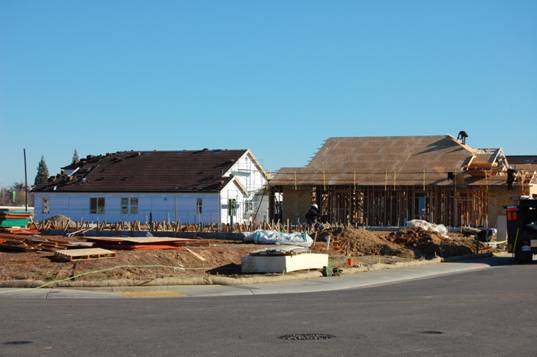
Concurrent with the urban development that has already been built, the City has provided many specified areas to comply with State law that requires each general plan to address open space and conservation issues including the preservation, management, and efficient use of open space and natural resources.
The City of Roseville has also made notifications of future projects. These projects will not only help in the preservation efforts but they will also be available for residents to enjoy.
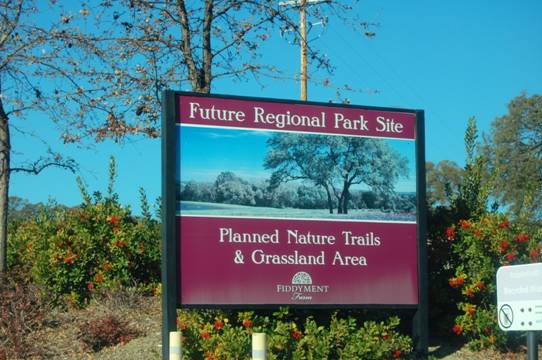
Roseville’s conservation efforts increase and maintain vegetated groundcover through the protection of trees and woodland areas, and the enhancement of urban parks and street-tree programs. Since Climate Change is also likely to have adverse effects on vulnerable plant and animal species, Roseville’s conservation efforts also address the preservation of natural habitats, both aquatic and terrestrial.
Based on the results of the Supervised Classification that was performed, the City of Roseville has followed their General Plan 2025. It is my conclusion that not only have they preserved existing habitats but they have also created or have plans to create new ones. The land that once was used for agricultural farmland with natural creeks and streams running through it has now and will continue to be developed into a retreat and haven for all species; plant, animal, and human to enjoy.
References
http://blogs.esri.com/esri/arcgis/2011/01/10/georef4/
http://www.dfg.ca.gov/biogeodata/gis/map_services.asp
Jennings, Nathan 2013, in work. American River College
Geography 342
https://d2l.losrios.edu/d2l/home/372335;
Last accessed 2013.12.16
http://www.roseville.ca.us/planning/general_plan_n_development_guidelines.asp
Tolman, Ann L. 2013, photography 2013.12.13.
Veisze, Paul M. 2013, in work. American River College
Geography 350, Past Student Presentations.
https://ic.arc.losrios.edu/~veiszep/;
Last accessed 2013.12.11.
Appendices
A Metadata
B Powerpoint Presentation
Appendix A
Metadata
Tags:
City of Roseville, West Roseville, Wetlands, Parks and Recreation, Fiddyment Farms, Color Infrared, 3-Band, National Agricultural Imagery Program (NAIP), 4-Band, Image Classification, Supervised Classification, Reclassification, Summer, Urban Construction, General Plan 2025, Land Use, Habitat Loss, Wetland Preserves, Habitat Preserves
Summary (Purpose):
The purpose of reclassification of imagery is to see if the City of Roseville has adhered to their General Plan of 2025 during the construction of urban development and the preservation of natural wetland and habitat preserves in West Roseville.
Description (Abstract):
City of Roseville General Plan 2025 information was first acquired, specifically their Land Use Plans for West Roseville area. Historical imagery was acquired from the Department of Fish and Game in CIR 3-Band and NAIP 4-Band. Imagery from four different years was acquired (2005, 2009, 2010, and 2012). The imagery was for all of California, whereas only a small portion of area was needed. Once the area needed was zoomed into, just the data frame plus the data within the frame was clipped out. The raster size was adjusted to a maximum of 4100 rows. The bands were then adjusted to reflect proper band coloring.
The CIR_2005 image was the used as the base map for all other images; to view the change over time. Using the Image Classification Toolbar, 16 polygons were drawn to be used for the training samples; 4 each for Soil, Grass, Trees, and Urban. The spectral signatures were evaluated to confirm high quality signatures were created. High quality signatures consist of a single bell-shaped histogram, small standard deviations, and variances for each band. Once all spectral signatures were created and individually evaluated, the entire set of spectral signatures evaluated by using the Dendrogram Tool and the Spatial Analyst Toolbox. The dendrogram was saved as an output text file. The dendrogram was a helpful tool to evaluate an entire set of spectral signatures. It provided a useful method to quickly review and identify where potential confusion may occur between spectral signatures.
Once the spectral signature file was created and evaluated, then a supervised classification was performed. The Maximum Likelihood Classification option in the Image Classification Toolbar was used. The clipped image and data were used as the input image. The spectral signature file that was created, from the training samples, was also used in this task. The output was saved as an image file. The output image contained randomly selected colors for the spectral classes previously created. Due to the random coloring of the image, reclassification of the spectral classes was performed. The individual classes that represented the same land cover type (Soil, Grass Trees, and Urban) were then recoded using the Reclassify tool in the Spatial Analysis Toolbox. Hence, the 16 different polygons used to create the spectral signatures were reclassified into 4 unique values. Each value represented one of the unique land cover types in the classification scheme and colors were assigned for each classification in the symbology tab.
Once the reclassification of the imagery was completed, it was then compared to the City of Roseville General Plan 2025 to confirm whether or not the City of Roseville adhered to their General Plan and the construction of urban development and the preservation of wetlands and habitat preserves.
Credits:
City of Roseville, Department of Fish and Game NAIP Imagery and CIR Imagery, American River College GEOG 342 Remote Sensing Class, American River College GEOG 350 Data Acquisition Class, Nathan Jennings, Paul Veisze