| Title Impervious Surfaces and Stormwater Management in Los Angeles County | |
|
Author
Elena DavertAmerican River College, Geography 350: Data Acquisition in GIS; Fall 2014 | |
|
Abstract While in its fourth year of severe drought, California faces another threat to its limited water supply: nonpoint source pollution. Also known as polluted runoff, nonpoint source pollution is the leading threat to water security in the U.S. It is exacerbated by impervious surfaces in dense urban areas and inadequate stormwater treatment. The Los Angeles County is the most populous county in the U.S. and the tenth largest by square miles. With nearly 2,800 square miles of urban development and increasing pressure on its scarce water supply, Los Angeles could benefit from Low Impact Development strategies for stormwater management.
| |
|
Introduction After another year of severe drought, Californians passed a $7.5 billion ‘water bond’ during the 2014 midterm elections. The bond was passed in order to fund “water quality, supply, treatment, and storage,” with more than a third of the funds designated for storage projects (White, 2014). In Southern California, cities such as Los Angeles are faced with insufficient infrastructure and water reserves given their rapid growth in the last 100 years. Although the 20th century marked the wettest recorded century in over 2,000 years, new climate research suggest the beginning of another dry period (Bartholomew, 2013). At the same time, billions of gallons of untreated stormwater are discharged into Los Angeles waterways each year because of insufficient rain capture. Instead, precipitation falls on impermeable paved surfaces, mixes with debris, pollutants, and sediment, and flows into storm sewer system (NRDC, 2013). This polluted runoff, also known as nonpoint source pollution, is the leading threat to water security in the United States (Gaffield et al, 2003). Although additional dams and water diversion systems are predicted to be costly and energy intensive, low-tech approaches to stormwater management based on biomimicry might be an alternative (Cohen et al, 2004). By replicating natural functions within man-made environments – decentralized rainwater catchment, permeable surfaces, water filtration via wetland creation, etc. – principles of 'permaculture' can benefit humans’ need for water management as well as foster a more diverse urban biosphere (Ormund et al, 2010). These types of techniques, also referred to as ‘Low Impact Development’ (LID), help retain water in order to reduce runoff and pollution (EPA, 2012). | |
|
Background With a population of over 10 million, the County of Los Angeles is the most populous county in the United States. It is also the 10th largest, encompassing 4,058 square miles (US Census Bureau 2013). Based on estimates from the Department of Agriculture Forest Service, nearly 45% of the County is classified as “urban or built-up land”, which equals 1,800 square miles of paved, or impervious, surfaces (USDA Forest Service 2010). | |
|
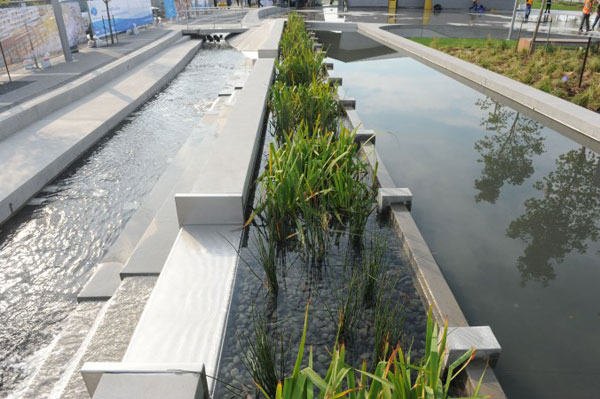
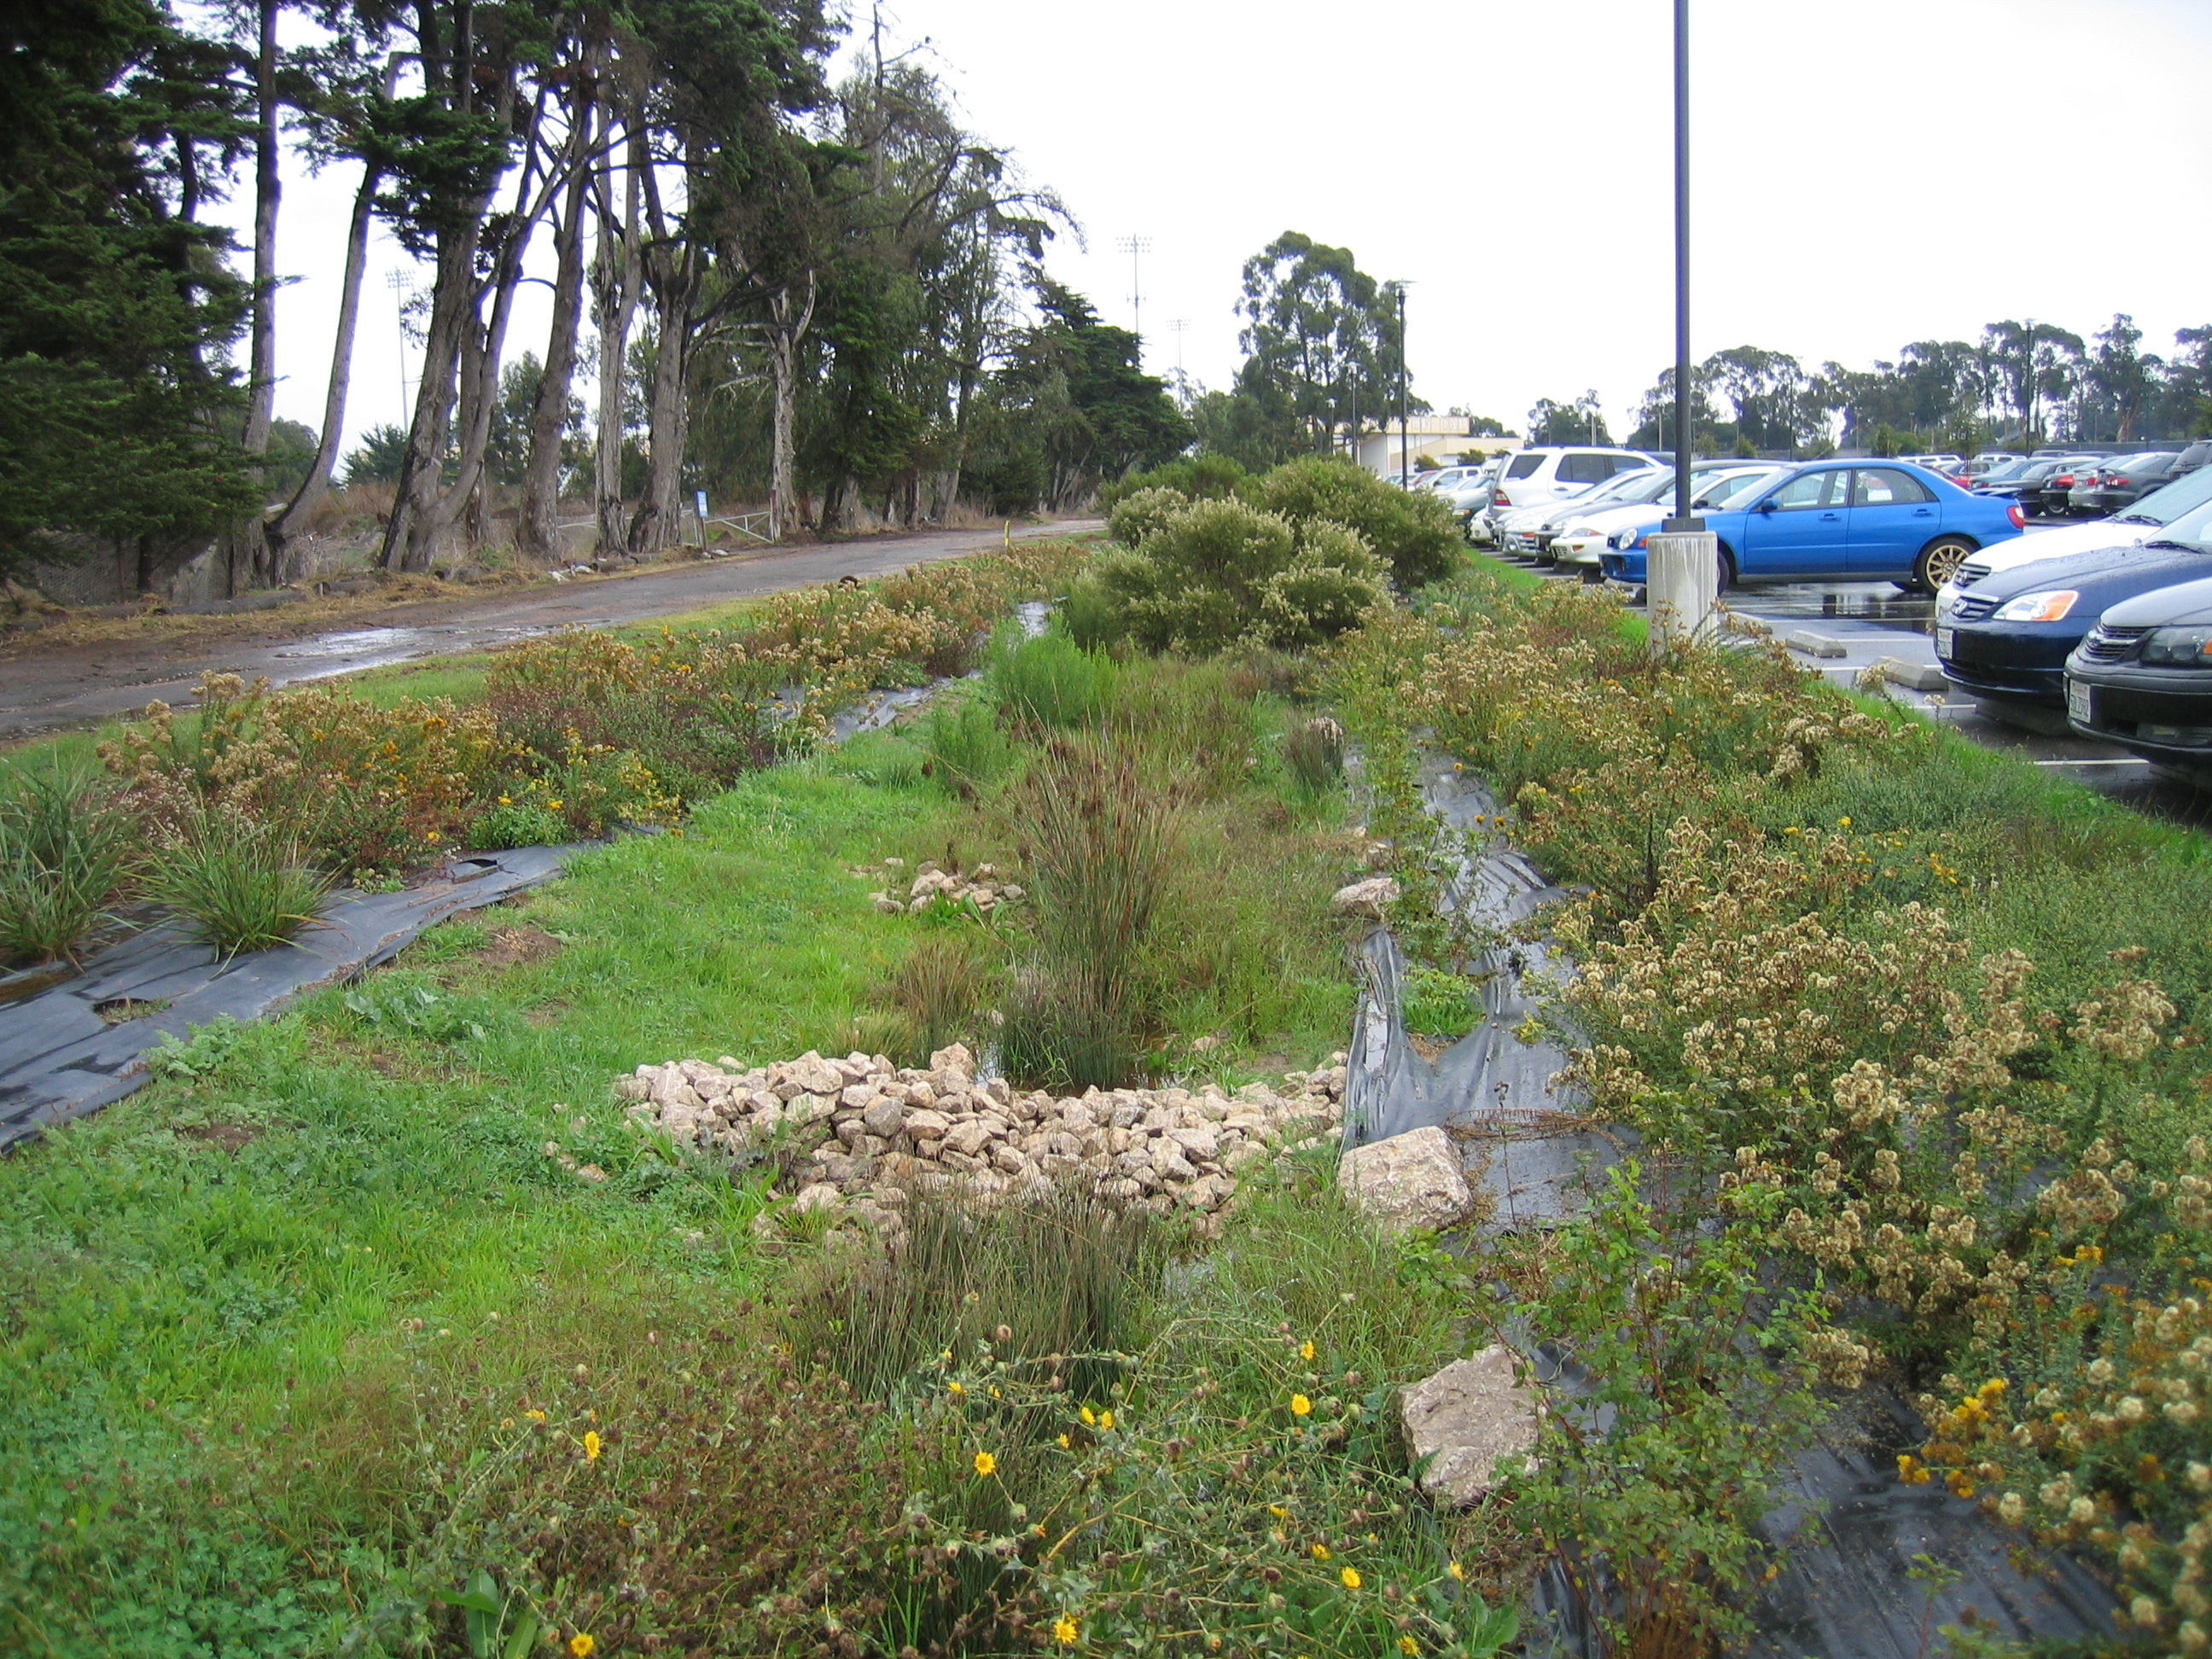
In the context of stormwater management, impervious surfaces such as roads, rooftops, buildings, and sidewalks are the major culprits of hydrological disruption that create nonpoint source pollution. When precipitation falls on paved areas, water is unable to infiltrate the soil. Rather than recharging the groundwater, large volumes of water trapped above ground are funneled through gutters, roads, and pipes in order to drain urban areas as quickly as possible (Arnold and Gibbons 1996). Unfortunately, this exacerbates three problems that face Los Angeles County today: flash flooding, drought, and pollution. The artificial “rivers” of stormwater systems allow water to reach high velocities, which not only increases risk of flooding and erosion, but also quickly drains water from the landscape rather than storing it. At the same time, conventional stormwater systems with slick impervious surfaces cannot trap the runoff fast enough, or in great enough volumes, to adequately filter it before discharging into local waterways (Gaffield et al, 2003). The County of Los Angeles relies heavily on a large network of aging, concrete lined pipes and channels for its stormwater management. More than 10 percent of the 7,200 miles of water pipes were built over 90 years ago and are reaching the end of their optimal lifespan (Los Angeles County, 2013). However, it is estimated that using conventional technologies and the current level of annual funding would take the Department of Water and Power 315 years to replace them (Nagourney, 2014). However, Permaculture or Low Impact Development pilot programs might be a low cost option for the County. When redesigning Los Angeles’ open channels, bioswales may be able to help retain, filter, and percolate runoff. Bioswales are shallow, elongated basins filled with plants (preferably native) that act as a buffer for silt deposits and pollution in surface run-off; they are essentially artificial wetlands that provide intermediate filtration between paved urban surfaces and rivers. Bioswales along roadways can also be used to divert water for landscaping as well (Koester, 2008). | |
| |
| |
|
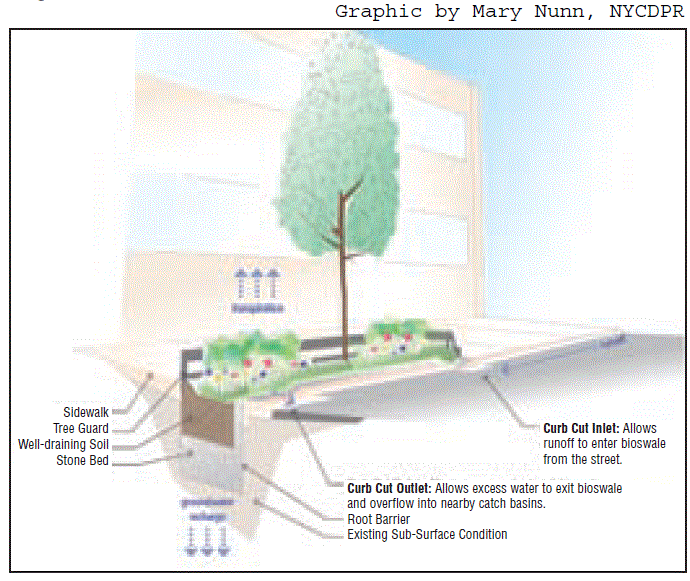
For example, a successful bioswale pilot in New York City incorporated bioswales into roadside curbs to mitigate gutter flooding and provide passive irrigation (McLaughlin, 2012). And in Portland, Oregon, the Oregon Museum of Science and Industry (OMSI) incorporated 10 bioswales into the parking lots which absorbed runoff from nearly 4 acres of paved lots (City of Portland, 2005). | |
| |
|
In this project, the goal is to locate concrete canals and channels that may be converted into bioswales in Los Angles County. | |
|
Methods
My basic approach for this project was:- Locate high density areas of impervious surfaces in CA - Select an area of interest - Locate polluted waters within the AOI - Identify areas where bioswales may be beneficial | |
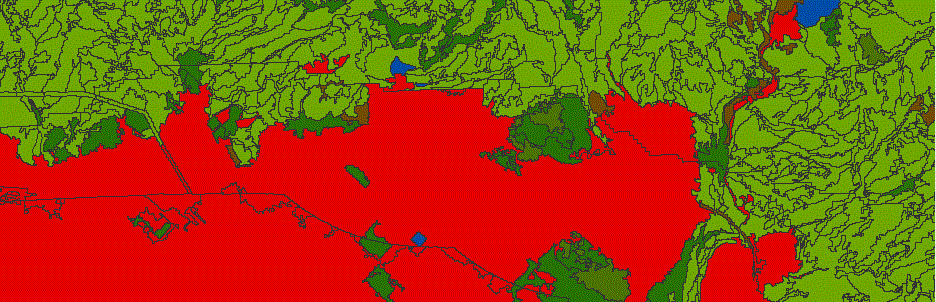
First, I downloaded a raster layer from the National Land Cover Database that showed the percent of developed impervious surfaces in the United States. It uses a 16-class land cover classification scheme at a resolution of 30 meters (Xian et al, 2011).
|
|
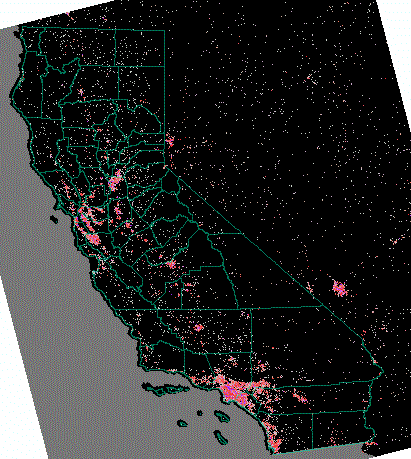
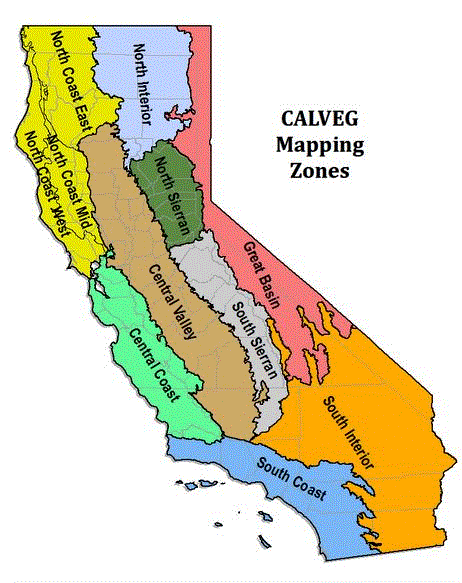
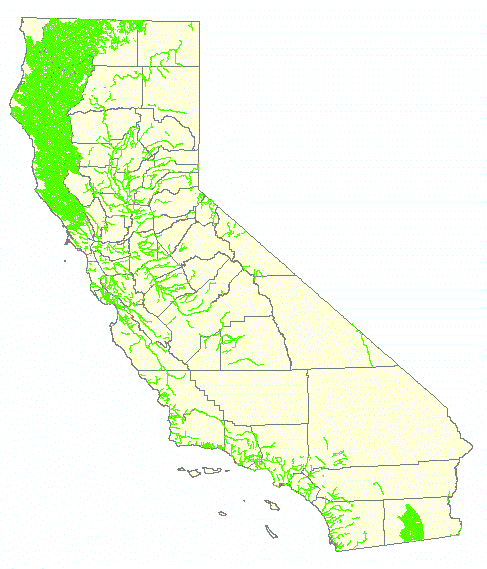
Next, I compared the the NLCD layer to the Existing Vegetation (Eveg) polygon feature class from the U.S. Department of Agriculture, Forest Service (2010). I found that the highest concentrations of of impervious surfaces to be in three zones: Central Coast Central Valley South Coast |
|
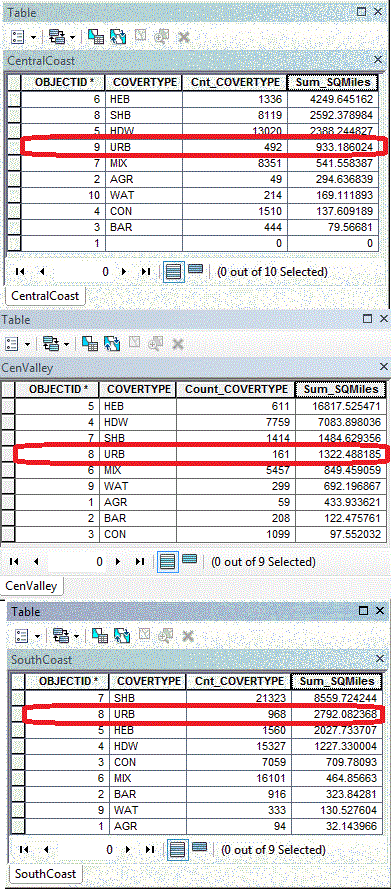
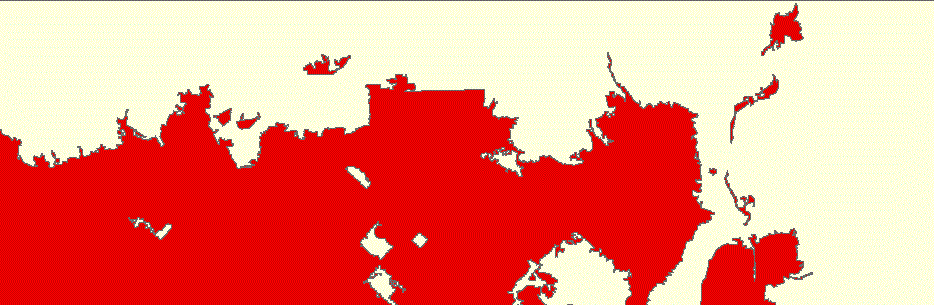
After selecting the three vegetation regions, I: - Downloaded the three shapefiles - Added a "SQMiles" field to each Attribute table and calculated geometry - Summarized each table on the "COVERTYPE" field - Compared the square miles of "Urban" development in each zone ("Urban" is defined as: "landscapes that are dominated by urban structures, residential units, or other developed land use elements such as highways, city parks, cemeteries and the like") I found that the South Coast contained the most square miles of urban development (2,792 square miles), particularely the County of Los Angeles. |
|
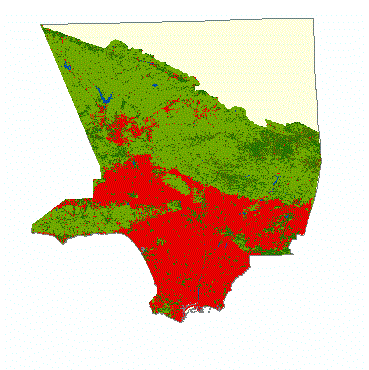
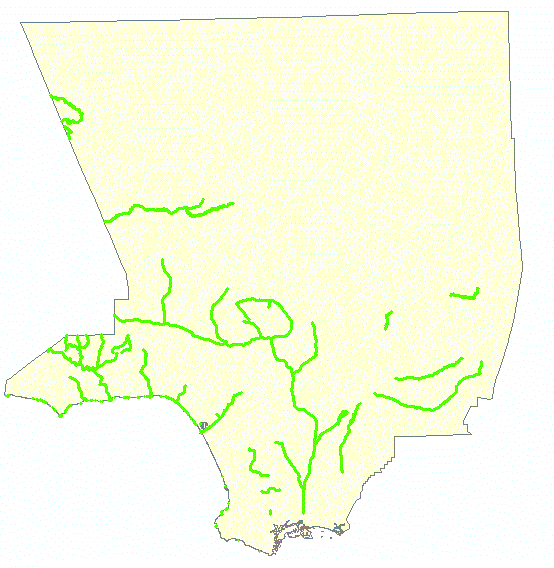
Next, I cropped the South Coast vegetation file for Los Angeles County, created a Definition Query for urban development, and dissolved the polygons along the field "COVERTPYE" for later use. 
|
|
| |
| |
|
I then located polluted waterways in California by using the California Environmental Proection Agency's 2010 Integrated Report. This report asseses degraded waterways based on criteria from the Federal Clean Water Act, Section 303(d). The polyline file sorts waterways into 3 categories: Category 5 - 303(d) list requiring the development of a Total Maximum Daily Load (TMDL) Category 4A - 303(d) list being addressed by USEPA approved TMDL Category 4B - 303(d) list being addressed by an action other than a TMDL Note: TMDLs are used for "evaluating the condition of surface waters and setting limitations on the amount of pollution that the water can be exposed to without adversely affecting the beneficial uses of those waters."
|
|
|
In order to refine the data for my project, I; - Clipped the 303d layer to Los Angeles County - Joined the layer with the associated table that listed potential pollution sources for each water segment - Created a Definition Query for'Unspecified Nonpoint Source' in the "SOURCE CATEGORY" field. Note: The California 303d layer also has 'Urban Runoff' as a source category, but none of the waterways in LA County were described as such. However, I would include those records when working in a different AOI because urban runoff also contributes to nonpoint source pollution.
|
|
|
Next, I downloaded shapefiles from the Los Angeles County storm drain system that included catch basins, gravity mains, maintenance holes, natural drainage, pump stations, and open channels. After reading the descriptions of each, I decided to focus on open channels that are defined as "concrete lined stormwater channels." I discovered that some of the open channels and 303d waterways were the same, and that some were offshoots that fed into the 303d waterways. I also learned from the attribute table and metadata that some of the channels are lined with concrete on the sides, but not along the bottom, and that some are simply ditches with no concrete lining at all. | |
| |
|
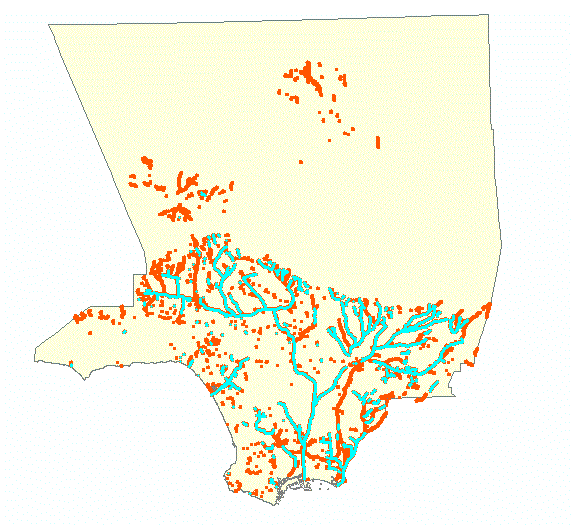
In order to narrow my search for potential bioswale sites, I queried the Open Channel layer based on two criteria:
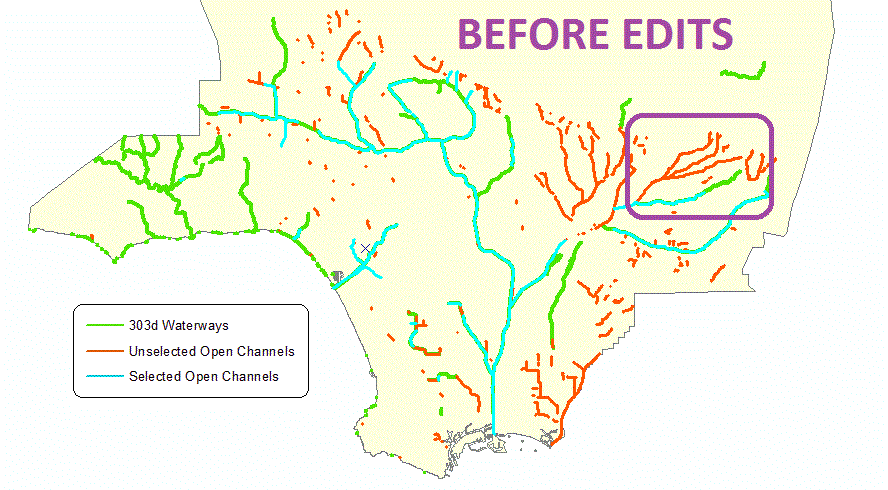
1)"SOFT_BTTM" = 'N' OR "SUBTYPE"= 'Improved' I did this in order to select open channels with concrete that could be converted into non-concrete bioswales. Because some records had had no information about their bottom lining, I expanded the query to include the subtype. 'Improved' signified paved surfaces while 'unimproved' or 'swale' indicated ditches or vegetated ditches. 2)"ASBDATE" < date 1/1/1964 According to the metadata, "ASBDATE" refers to "the date the design plans were approved "as-built" or accepted as " final records." I selected the older infrastructure because the county has been focusing more funds on replacing old, broken concrete rather than newly paved surfaces. The oldest record in the shapefile has an ASBDATE of 1/1/1927. I then exported the selected set to a new layer. The query reduced the number of records from 6,834 to 2,620. Below, all open channels are in orange; the selected open channels based on my queries are in blue. | |
| |
|
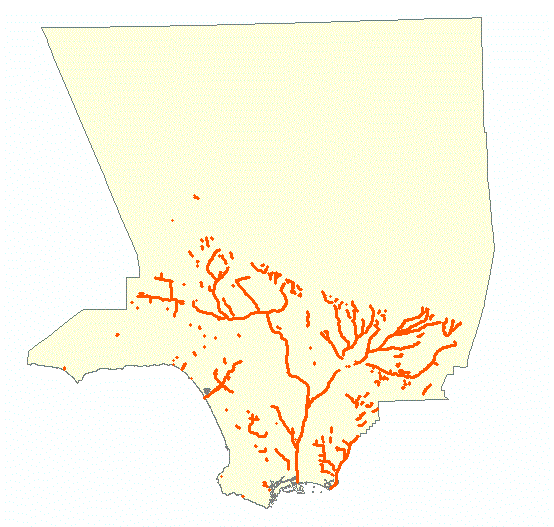
After opening the exported data layer containing the older, concrete improved channels, I dissolved the polylines by the "NAME" field in order to create continuous, rather than choppy, line segments.
This reduced the number of records from 2,620 to 250. | |
| |
|
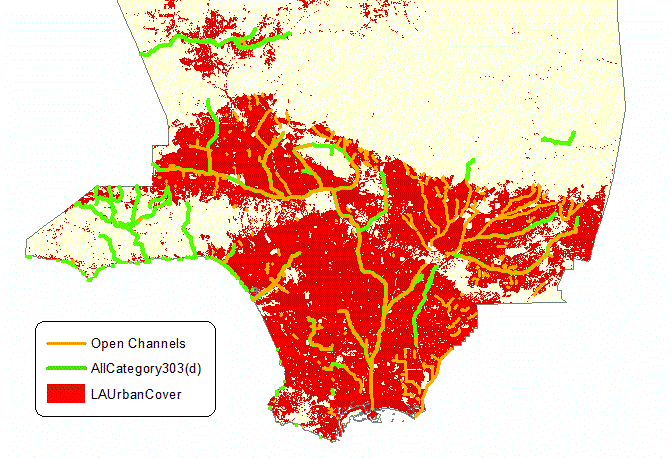
Then I used Select by Attributes and Select by Location to find the Open Channels that: 1)Intersected with urbran land cover 2)Intersected with - or actually were - 303d waterways (they overlapped at points) | |
| |
|
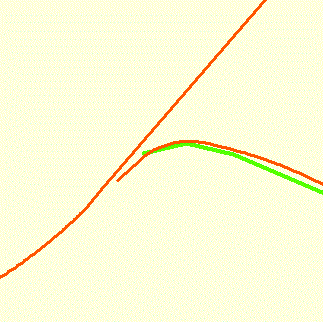
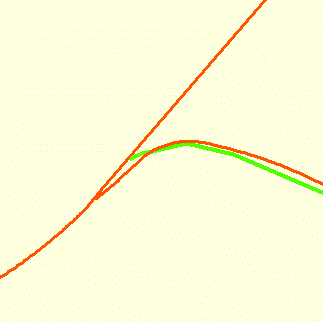
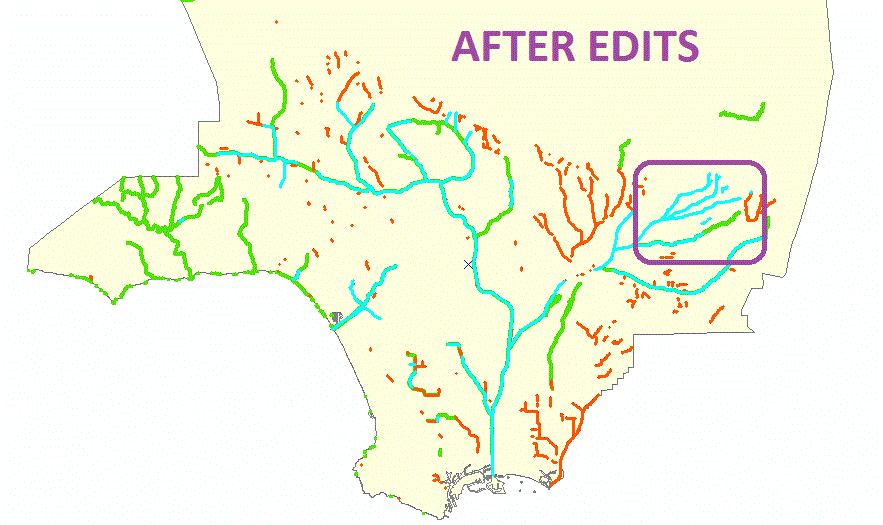
However, I noticed that some areas which appeared to feed directly into 303 waterways were not highlighted. After zooming in, I realized that two vertices in the upper right corner of the map were not connected, likely due to the different data sources. By using the Identify tool and Google Earth, I felt confident that editing the layers would not alter the integrity of the data. I then used the Editor tool to fix the Open Channel layer.
| |
| |
|
|
| |
|
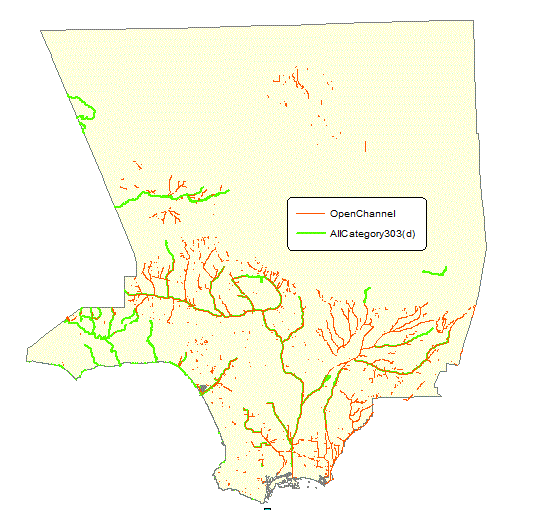
Results After comparing, querying, and editing the data, these are the following channels that I recommend for bioswale pilot programs in Los Angeles County: | |
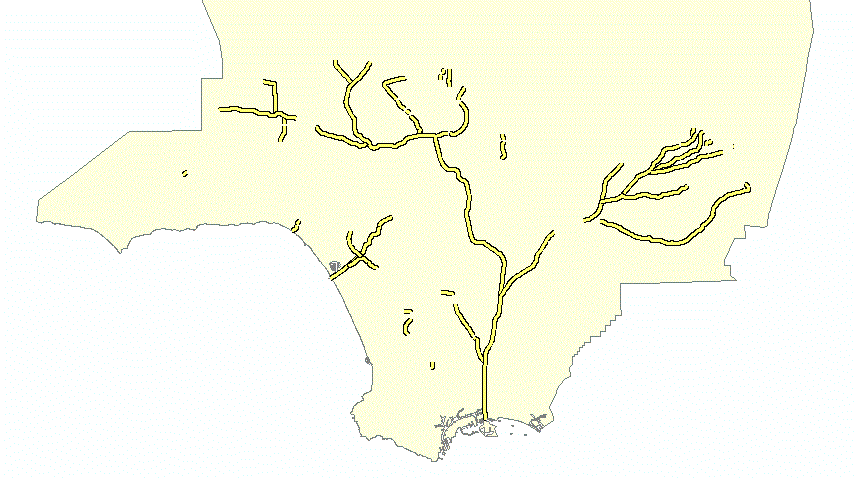
| |
|
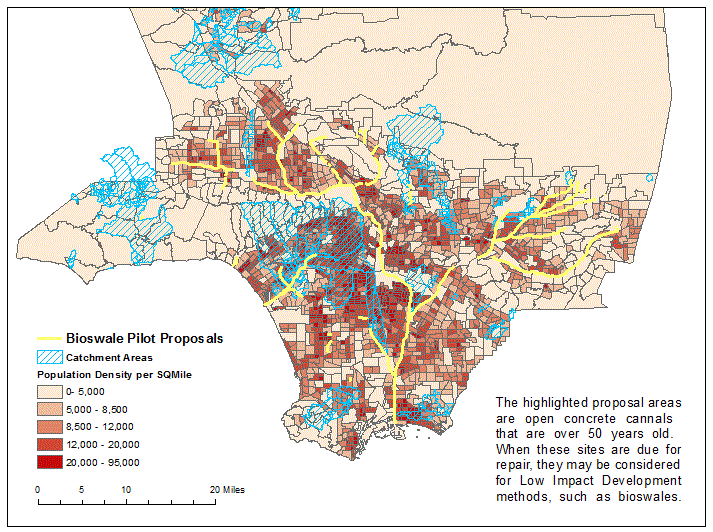
After making these final selections, I combined the recommended channels with two additional layers depicting dense urban areas (Census, 2010)* and water catchment zones (Los Angeles County, 2012). Presenting the data this way is important because: A) It emphasizes the fact that these canals are the arteries of the County, carrying polluted area away from dense urban areas. B) It shows that some channels fall in the crux of multiple catchment zones that have the potential to move large volumes of water. c) It illustrates how many sections of the stormwater system are over 50 years old and in need of update. *I calculated dense urban areas by normalizing population data by the square miles of each census tract. This involved clipping the California 2010 Census file with the Los Angeles County shapefile, adding a 'SQmile' field and calculating geometry. | |
| |
|
Analysis
Overall, I acheived my objectives of highlighing areas within Los Angeles County that may benefit from bioswale installation. I was able to combine elements of land cover, contaminated waterways, and urban density to provide preliminary suggestions. However, I would have conducted further analysis if I had more time to work with the data. The Los Angeles County stormwater shapefiles also contained layers with catch basins (i.e. gutters) and natural drainage canals that could be applied for further studies. Combining catch basins with transportation layers may indicate which roadside gutters are closest to Impaired Waterways and would benefit from LID principles. Additionally, natural drainage canals that are already void of concrete or other impervious surfaces might also be transformed into bioswales. Additionally, some aspects of this study are far beyond my scope as a first year GIS student. Incorporating high resolution DEMs or data regarding flow rates for different parts of the storm system may help calculate which areas handle the greatest volume and velocity of runoff during peak storms. Information about exact amounts of pollutants might also help determine the size of bioswales and plant varieties needed to adequately filter the stormwater. | |
|
Conclusions Los Angeles County is a good candidate for LID stormwater management due to its size, amount of impervious surfaces, polluted waterways, and water insecurity. While this project focused on old, concrete canals that could be turned into bioswales, curbs and natural drainage may also benefit from LID principles. Additional research should be conducted regarding specific flow rates and pollutant levels throughout the storm water system and 303d waterways. | |
|
References
Arnold, Chester L. Jr. & Gibbons, C. James (1996): Impervious Surface Coverage: The Emergence of a Key Environmental Indicator, Journal of the American Planning Association, 62:2, 243-258. Bartholomew, Dana (2013). Los Angeles Water Supply May Not Be Enough In a Few Decades, The Los Angeles Daily News. Accessed December 2, 2014: http://www.huffingtonpost.com/2013/11/04/los-angeles-water-supply_n_4212323.html City of Portland (2005). Oregon Museum of Sicnece and Industry Parking Lot Swales. Accessed November 13, 2014: https://www.portlandoregon.gov/bes/article/78489 Cohen, Ronnie; Nelson, Barry; and Wolff, Gary (2004). Energy Down the Drain: The Hidden Costs of California’s Water Supply. Natural Resources Defense Council, Pacific Institute. Accessed December 4, 2014: https://www.nrdc.org/water/conservation/edrain/edrain.pdf Gaffield, Stephen J., PhD, Goo, Robert L., Richards, Lynn A. MSES, MPA, and Jackson, Richard J., MD, MPH (2003): Public Health Effects of Inadequately Managed Stormwater Runoff, The American Journal for Public Health, 93:9, 1527–1533. Koester, Helko (2008): Native Plants And Urban Sustainability, Native Plants Journal, 9:3, 323-333. Los Angeles County (2012). Stormwater Catchment Areas. Accessed December 1, 2014: http://egis3.lacounty.gov/dataportal/2014/06/30/stormwater-catchment-areas/ Los Angeles County (2013). Los Angeles County Storm Drain System. Accessed December 2, 2014: http://egis3.lacounty.gov/dataportal/2013/08/08/los-angeles-county-storm-drain-system/ McLaughlin, John (2012). NYC Bioswales Pilot Project Improves Stormwater Management, Clear Waters (Summer 2012): 20-23. Nagourney, Adam (2014). Infrastructure Cracks as Los Angeles Defers Repairs. The New York Times, September 1, 2014. Accessed December 3, 2014: http://www.nytimes.com/2014/09/02/us/pipes-roads-and-walks-crack-as-los-angeles-defers-repairs.html?_r=0 National Resources Defense Council (2013). Federal Appeals Court Finds Los Angeles County Liable for Polluted Waterways. Accessed December 7, 2014; http://www.nrdc.org/media/2013/130808.asp Ormond, T., Mundy, B., Weber, M., and Friedman, Z. (2010) LID Meets Permaculture: Sustainable Stormwater Management in the Mountains of Western North Carolina. Low Impact Development 2010: pp. 935-948. Accessed 10/14/2014: http://books.google.com/books?id=g7dUqY9Opy8C&pg=PR942&lpg= PR942&dq=LID+Meets+Permaculture:+Sustainable+Stormwate+Management+ in+the+Mountains+of+Western+North+Carolina&source=bl&ots=BZA_S1euKd&sig =lRbz5RRQ-J9aHfGZhEnpw6PdxqQ&hl=en&sa=X&ei=DPg9VPjbDoTgo ATr2IKABg&ved=0CC4Q6AEwAg#v=onepage&q&f=false State Water Resources Control Board (2010). Impaired Water Bodies. Accessed November 11, 2014: http://www.waterboards.ca.gov/water_issues/programs/tmdl/integrated2010.shtml U.S. Census Bureau (2010). TIGER/Line® with Selected Demographic and Economic Data. Accessed November 7, 2014: https://www.census.gov/geo/maps-data/data/tiger-data.html U.S. Census Bureau (2013). State & County QuickFacts. United States Census Bureau. Accessed December 12, 2014: http://quickfacts.census.gov/qfd/states/06/06037.html United States Environmental Protection Agency (2012). Costs of Low Impact Development. Accessed November 14, 2014: http://water.epa.gov/polwaste/green/upload/bbfs3cost.pdf White, Jeremy B. (2014). California water bond wins passage, The Sacramento Bee. Accessed November 15, 2014: http://www.sacbee.com/news/politics-government/election/article3569770.html Xian, G., Homer, C., Dewitz, J., Fry, J., Hossain, N., and Wickham, J., 2011. The change of impervious surface area between 2001 and 2006 in the conterminous United States. Photogrammetric Engineering and Remote Sensing, 77(8): 758-762. Accessed 12/8/14: http://www.mrlc.gov/nlcd11_data.php | |