| Farmers Markets and Food Access Sacramento, California Acquisition and Analysis of Available Data | |||||||||||||||||||||||||||||||||
|
Author Michael Dobyns American River College, Geography 350: Data Acquisition in GIS; Fall 2014 Contact Information (w1459582@apps.losrios.edu) | |||||||||||||||||||||||||||||||||
|
Abstract Nutrition and food access issues for those with low income is a national issue. This report focuses on the potential impact farmers markets could be having on this population. In order to better understand the subject on a local level, analysis on data for the Sacramento, CA region. Useful local and national datasets are detailed and some inferences are made. | |||||||||||||||||||||||||||||||||
|
Introduction Americans are becoming increasingly aware of the health benefits of a good diet. We also know the negative impacts a poor diet and unhealthy food have on the individual and society. Instances of childhood obesity are on the rise, with one in three children in America now overweight or obese. Heart disease, diabetes and other dietary related conditions are on the rise in adults (CDC, 2014). While there are many variables that contribute to these conditions, one can argue that most dietary issues boil down to choice. Ultimately, we all have a choice in what we eat... right? After all, hitting the drive-thru for that double cheeseburger combo is a choice isn’t it? Couldn't someone just as easily choose to buy a healthy meal from the grocery store? While this is true for some of us, many Americans don’t have a full-service grocery store down the street, and even if there were, many couldn’t afford to shop there. For most Americans, income level and access to food stores affect our food choices. For those with low income who live in low access neighborhoods, choice is eliminated almost entirely.
A
As the capital of the largest agricultural state in the nation, Sacramento is known as “America’s Farm to Fork Capital” and its local food scene includes over 50 farmers markets (SCVB, 2014). Sacramento is one of the most racially diverse communities in California, which is the now the most diverse state in the nation. Sacramento’s economy is also varied; with a cost of living at 16.2% above the national average, but 12.4% below the state average, a median income of $53,046, and 15.4% living below the poverty line (USCB, 2014). Recently, the local public radio station produced a documentary titled "Hidden Hunger" which focused on some of the food access issues facing the community (KXJZ, 2014). This documentary highlighted the need for improved options and access for area residents. This report will summarize the available relevant geographic data, along with literature and data review to better understand the problem of food access in the Sacramento region. This report details the findings of the project, details select datasets, and attempts to make some inference as to the impact farmers markets could be having on the low-income/low-access population. | |||||||||||||||||||||||||||||||||
|
Background
Relevant Cultural Data: Initial research was focused on developing analysis methods based on existing and accepted methodologies utilizing census data. The literature review revealed that in recent years the USDA has been conducting research into food access, and has produced some very useful datasets based on the 2010 Decennial Census, and the 2006-10 American Community Survey. These datasets are available for download from the USDA’s website in excel format, and can be utilized in a GIS by joining the datasets to a 2010 census tract boundary file (ERS, 2014). Below are details on the datasets utilized for this report:
The Food Access Research Atlas (FARA) "presents a spatial overview of food access indicators for low-income and other census tracts using different measures of supermarket accessibility; provides food access data for populations within census tracts; and offers census-tract-level data on food access that can be downloaded for community planning or research purposes (ERS, Dec 2014)." The FARA dataset contains pertinent tract level census data, along with the indicator fields which are designed for use within a GIS. The indicator fields are defined in the accompanying documentation and can be utilized for display or additional analysis (ERS, Dec 2014). The Food Environments Research Atlas (FERA) dataset was created by the USDA in order “to assemble statistics on food environment indicators to stimulate research on the determinants of food choices and diet quality, and to provide a spatial overview of a community's ability to access healthy food and its success in doing so (ERS, May 2014)." The FERA dataset is similar in design and concept to the FARA with indicator fields for use in a GIS. The FERA's indicators are measured at the county level.
The Food Desert Locator Tool is an online tool developed by the USDA to help the public locate food deserts. The data is available for download and can be joined to census tract polygons for display and analysis in a GIS. “USDA, Treasury and HHS have defined a food desert as a census tract with a substantial share of residents who live in low-income areas that have low levels of access to a grocery store or healthy, affordable food retail outlet (ERS, 2014) The USDA maintains a database of farmers markets in the US, known as the “National Farmers Market Directory”. This database can be searched and viewed on the USDA website using a built in tool. The search results can be exported to a spreadsheet. The data includes X and Y coordinate fields that can be used in ArcMap to create a point feature class (AMS, 2014). This dataset is large with 8,374 markets listed at the time of this report, and the directory includes a lot of attribute data (including columns for Facebook, Twitter, and Youtube!!), however the data is "dirty" with many inaccurate entries (more details below). Sacramento Area Farmers Markets: The USDA “National Farmers Market Directory” (detailed above) is the best resource available for obtaining a national or statewide dataset of farmers market locations, and at first glance it appears to be fairly detailed and complete. However, when it was examined on a local level, it was found to have many inaccurate entries. Issues with the dataset included incorrect coordinates and out of date or missing attribute data. It became apparent that it would be necessary to create a local Sacramento dataset to perform any meaningful analysis in this region. To create the "Sacramento Area Farmers Markets" dataset a web search was performed to find all farmers markets in the area. Relevant attributes were recorded in a spreadsheet. Location information (address or other details) were then input in Google Earth and a series of place points created. These points were exported from Google Earth as a KMZ file and then converted to a geodatabase feature class format using XTools Pro; "Import from KML tool". Once in ArcMap, the points were joined with the attribute data collected during the web search, then exported as a geodatabase feature class. Additional Relevant Spatial: In addition to the USDA datasets, some government unit data was acquired for use during this project. Statewide (CA) datasets for County Boundaries, City Boundaries, and Census Designated Places where download from the CalAtlas data clearinghouse. Census Tract geometry were downloaded at both the state and national level though the USCB website. All base data used for cartographic puroposes in this project came from ESRI's online basemaps. | |||||||||||||||||||||||||||||||||
|
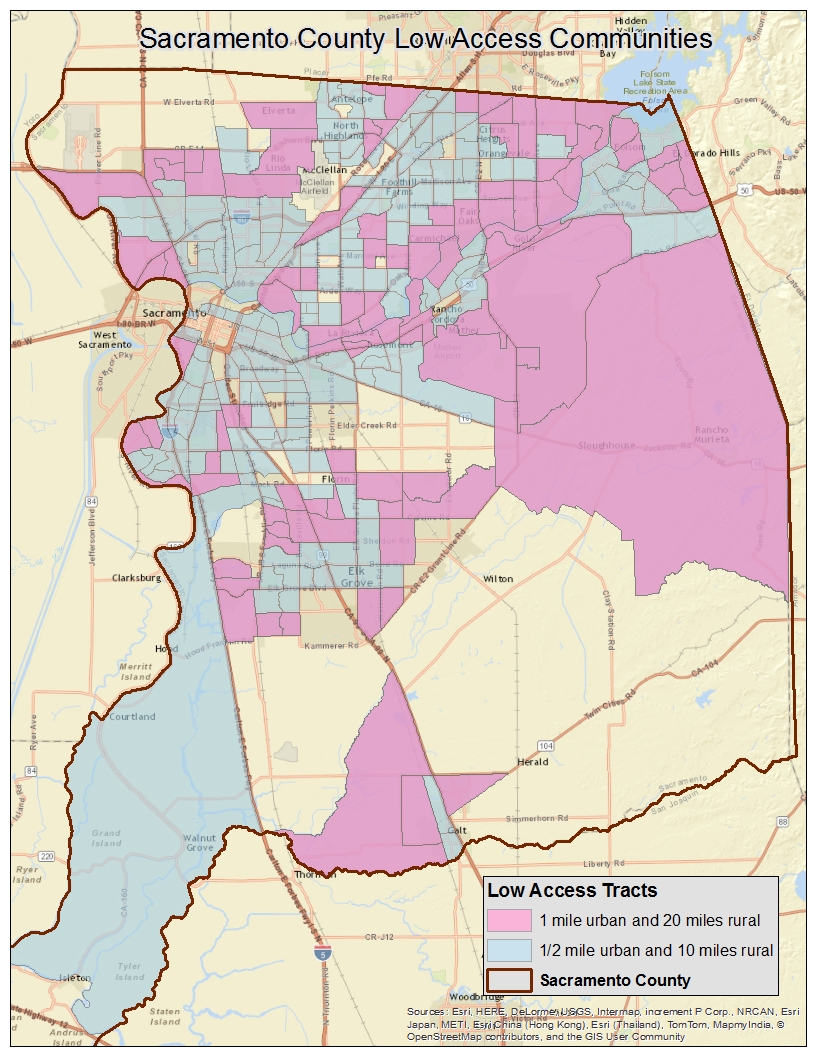
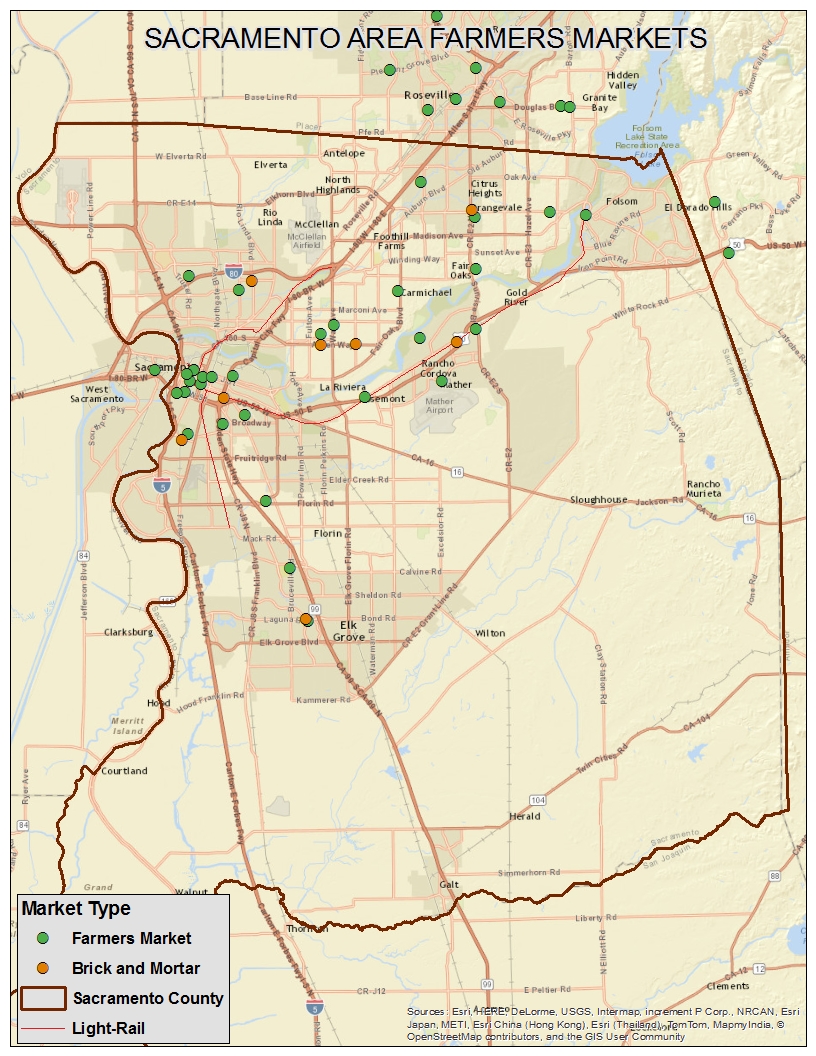
Example of food desert indicator data (below). Sacramento Farmers Market Layer (right): |
| ||||||||||||||||||||||||||||||||
|
Methods
| |||||||||||||||||||||||||||||||||
|
Having no prior knowledge of the subject, the researcher thought he was asking a simple question: Are the farmers markets in Sacramento helping increase access to those in need? Research for this project began with an extensive internet literature review. Research first focused on food access and more specifically, farmers market access. After investigating other maps and reports, it was found that others were consistently referencing the USDA research*. This led the researcher to the USDA website. The site includes some online tools, along with opportunities for data download. Once the data was downloaded, considerable time was spent on understanding the datasets and displaying the indicator data in a GIS (information on dataset download and import into AcrMap in background section).
*You can check out a great interactive ESRI story map on the subject at http://storymaps.esri.com/stories/2014/farmers-markets/.
|
| ||||||||||||||||||||||||||||||||
|
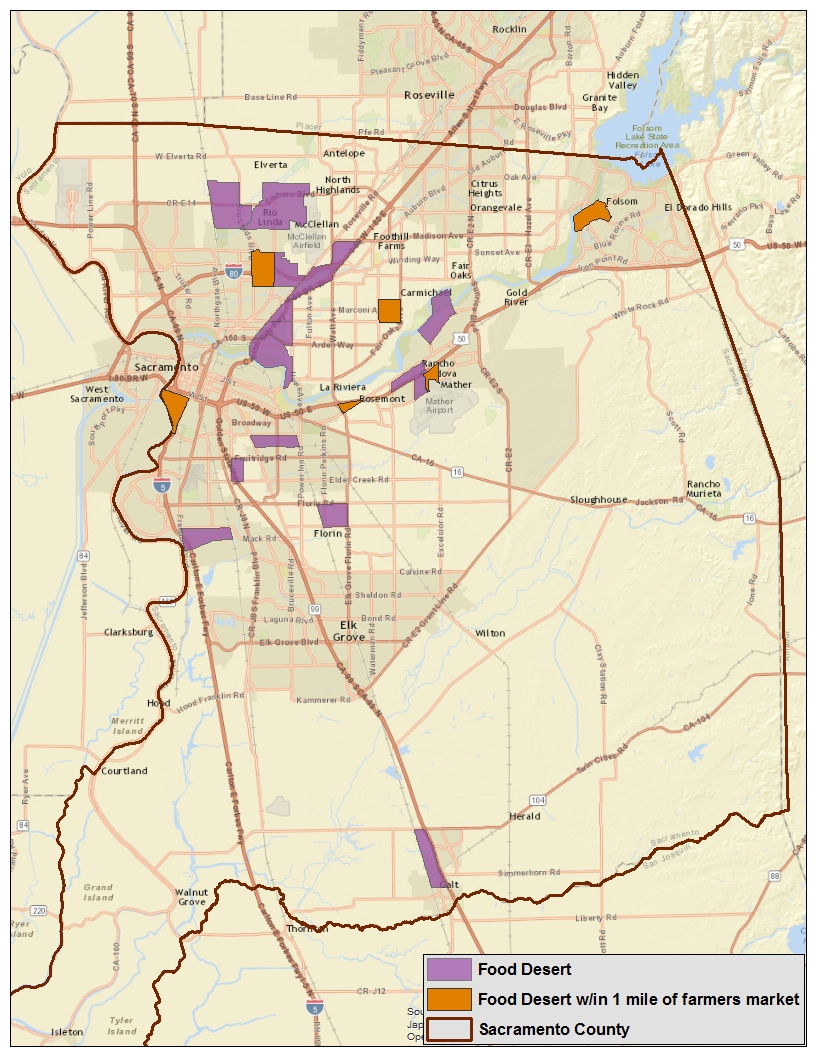
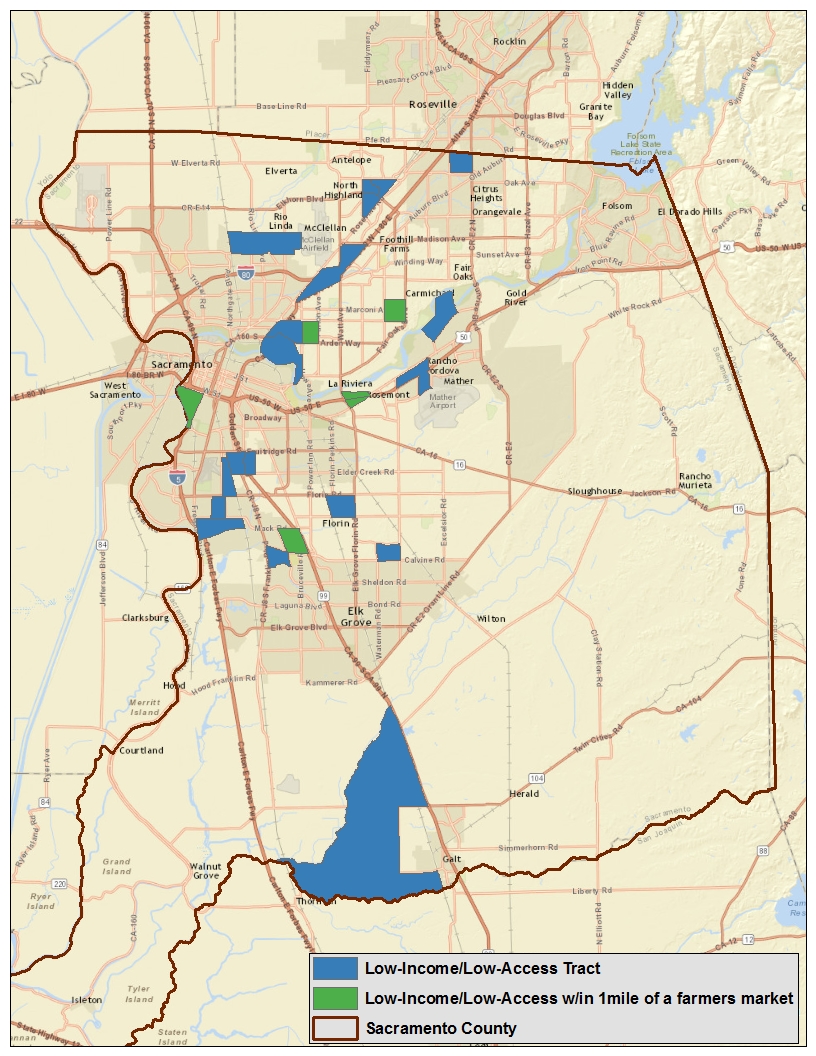
Results
The analysis of the USDA datasets produced some general data about the state of Food Access in Sacramento County (see chart below). Out of the 317 census tracts in Sacramento County, 20 are considered to be food deserts. The regional farmers market layer contains 53 makets, 37 of which are in Sacramento County. Out of the 20 food desert tracts in the county, 6 were within 1 mile of one of the Sacramento farmers markets (based on the centroid of the census tract polygon). | |||||||||||||||||||||||||||||||||
|
 | ||||||||||||||||||||||||||||||||
|
Figures and Maps
| |||||||||||||||||||||||||||||||||
 |
 | ||||||||||||||||||||||||||||||||
|
Analysis
The topics and issues investigated during this project were much more complex than originally anticipated. The amount of available research on food access and food environments is extensive. The USDA datasets which were ultimately utilized are incredibly rich and it took some time to understand them.
The development of the Sacramento area farmers market dataset was also rather time intensive. There was a desire to use this dataset for a variety of potential processes such as geocoding and network analysis, or for use in a web application. Therefore it was crucial that the domains were properly designated and that the data was “clean." Through this process, the researcher learned a great deal about the acquisition of spatial data from more traditional, non-spatial sources. Nearly every market entered into the dataset came from the farmers market's website or other online resource (yelp). Location information was either an address or some type of descriptive information (Chavez Park or Target parking lot for example). The researcher learned how to create and then export a set of points in Google Earth, and then import those points into ArcMap. | |||||||||||||||||||||||||||||||||
|
Conclusions This findings of this report indicate that the subject of food access in communities is a complex issue. The USDA datasets provide the means for analysis of this subject in a GIS. Some inferences were made as to the potential impact of local farmers markets on the regions food desert however, the study would need to consider many other variables before conclusions could be drawn. While data was collected regarding the season and open hours for each market, this information was not included in the analysis. Another important variable recorded but not included in analysis is the acceptance of food stamps (SNAP) at the markets. Future work on the subject should be focused on establishing a method for quantifying the potential impact taking into account these variables. | |||||||||||||||||||||||||||||||||
|
References
Agricultural Marketing Service (AMS), United States Department of Agriculture (USDA). “Creating Access to Healthy, Affordable Food.” Apps.ams.usda.gov. n.d. December, 2014. <er, 2014. <http://apps.ams.usda.gov/fooddeserts/foodDeserts.aspx>.
Agricultural Marketing Service (AMS), United States Department of Agriculture (USDA). “Farmers Markets Search.” Search.ams.usda.gov. n.p. December, 2014. < http://search.ams.usda.gov/FARMERSMARKETS/>.
California Department of Social Services. “CalFresh Program.” calfresh.ca.gov. n.p.2007 <http://www.calfresh.ca.gov/>.
Capital Public Radio (KXJZ 90.9 Sacramento, CA). “The View From Here: Hidden Hunger.” capradio.org. December 05, 2014 <http://www.capradio.org/news/the-view-from-here/2014/12/05/hidden-hunger/>.
Charles, Dan. “How 'Double Bucks' For Food Stamps Conquered Capitol Hill.” npr.org. November 10, 2014 <http://www.npr.org/blogs/thesalt/2014/11/10/361803607/how-double-bucks-for-food-stamps-conquered-capitol-hill?sc=17&f=1001&utm_source=iosnewsapp&utm_medium=Email&utm_campaign=app>.
Centers for Disease Control and Prevention (CDC). “Adolescent and School Health.” cdc.gov. n.p. Dec, 2014. <http://www.cdc.gov/HealthyYouth/obesity/facts.htm>.
Economic Research Service (ERS), U.S. Department of Agriculture (USDA). “Food Access Research Atlas.” ers.usda.gov. n.p. 2014. <http://www.ers.usda.gov/data-products/food-access-research-atlas.aspx>.
Economic Research Service (ERS), United States Department of Agriculture (USDA). “Food Environment Atlas: Overview.” ers.usda.gov. n.p. May, 2014. < http://www.ers.usda.gov/data-products/food-environment-atlas.aspx>.
ESRI Story Map. “The Rapid Rise of Farmers Markets.” storymaps.esri.com. n.p. 2014. <http://storymaps.esri.com/stories/2014/farmers-markets/>.
Obama, Michelle. “Let’s Move. America’s Move to Raise a Healthier Generation of Kids.” Letsmove.gov. n.p. April, 2013. <http://www.letsmove.gov/>.
The Sacramento Convention and Visitors Bureau (SCVB). “Farm to Fork”. Farmtofork.com. n.p. 2014. < http://www.farmtofork.com/>.
United States Census Bureau (USCB). “Maps and Data: TIGER Products.” census.gov. n.p. November, 2014. <http://www.census.gov/geo/maps-data/data/tiger.html>. United States Census Bureau (USCB). “State & County Quick Facts.” quickfacts.census.gov. n.p. December, 2014. <http://quickfacts.census.gov/qfd/states/06/06067.html>. | |||||||||||||||||||||||||||||||||
|
Appendices Material may be included in various appendix sections at the student’s option. | |||||||||||||||||||||||||||||||||