Title Using GPS and Buffer Analysis to Quantify Tree Canopy Cover in Carmichael Park | |
|
Author Rachel Enes American River College, Geography 350: Data Acquisition in GIS; Fall 2014 Contact Information (email: r.enes0625@gmail.com) | |
|
Abstract In the face of rapidly growing cities and a booming population, it is becoming increasingly important to maintain sensitivity toward nature and to continue to value and plan to incorporate greenery in our everyday lives. For example, public parks help provide a stable, refreshing interaction with nature, and can give us a break from busy urban life. In particular, this project sought to quantify the tree canopy in Fair Oaks’ Carmichael Park for the purpose of visualizing shade cover to highlight to the growing importance of maintaining and preserving trees for health benefits as well as general enjoyment. GPS was used to mark tree locations in the park and to record a radius (in feet), which would later be used in ArcGIS to generate a buffer around each tree. These buffers, along with a hand-drawn park boundary, were used to calculate a percentage of canopy cover for the entire. A map was produced showing the tree locations along with their buffers in order to display the areas containing the most canopy cover as well as to highlight any gaps. In conclusion, Carmichael Park is well-wooded and well-maintained. It is clear to see that it provides more than adequate shade cover, even having used an amateur’s measurements. Carmichael Park is a good example of a recreational area - in particular, a public park - that people benefit from due to its lush state. | |
|
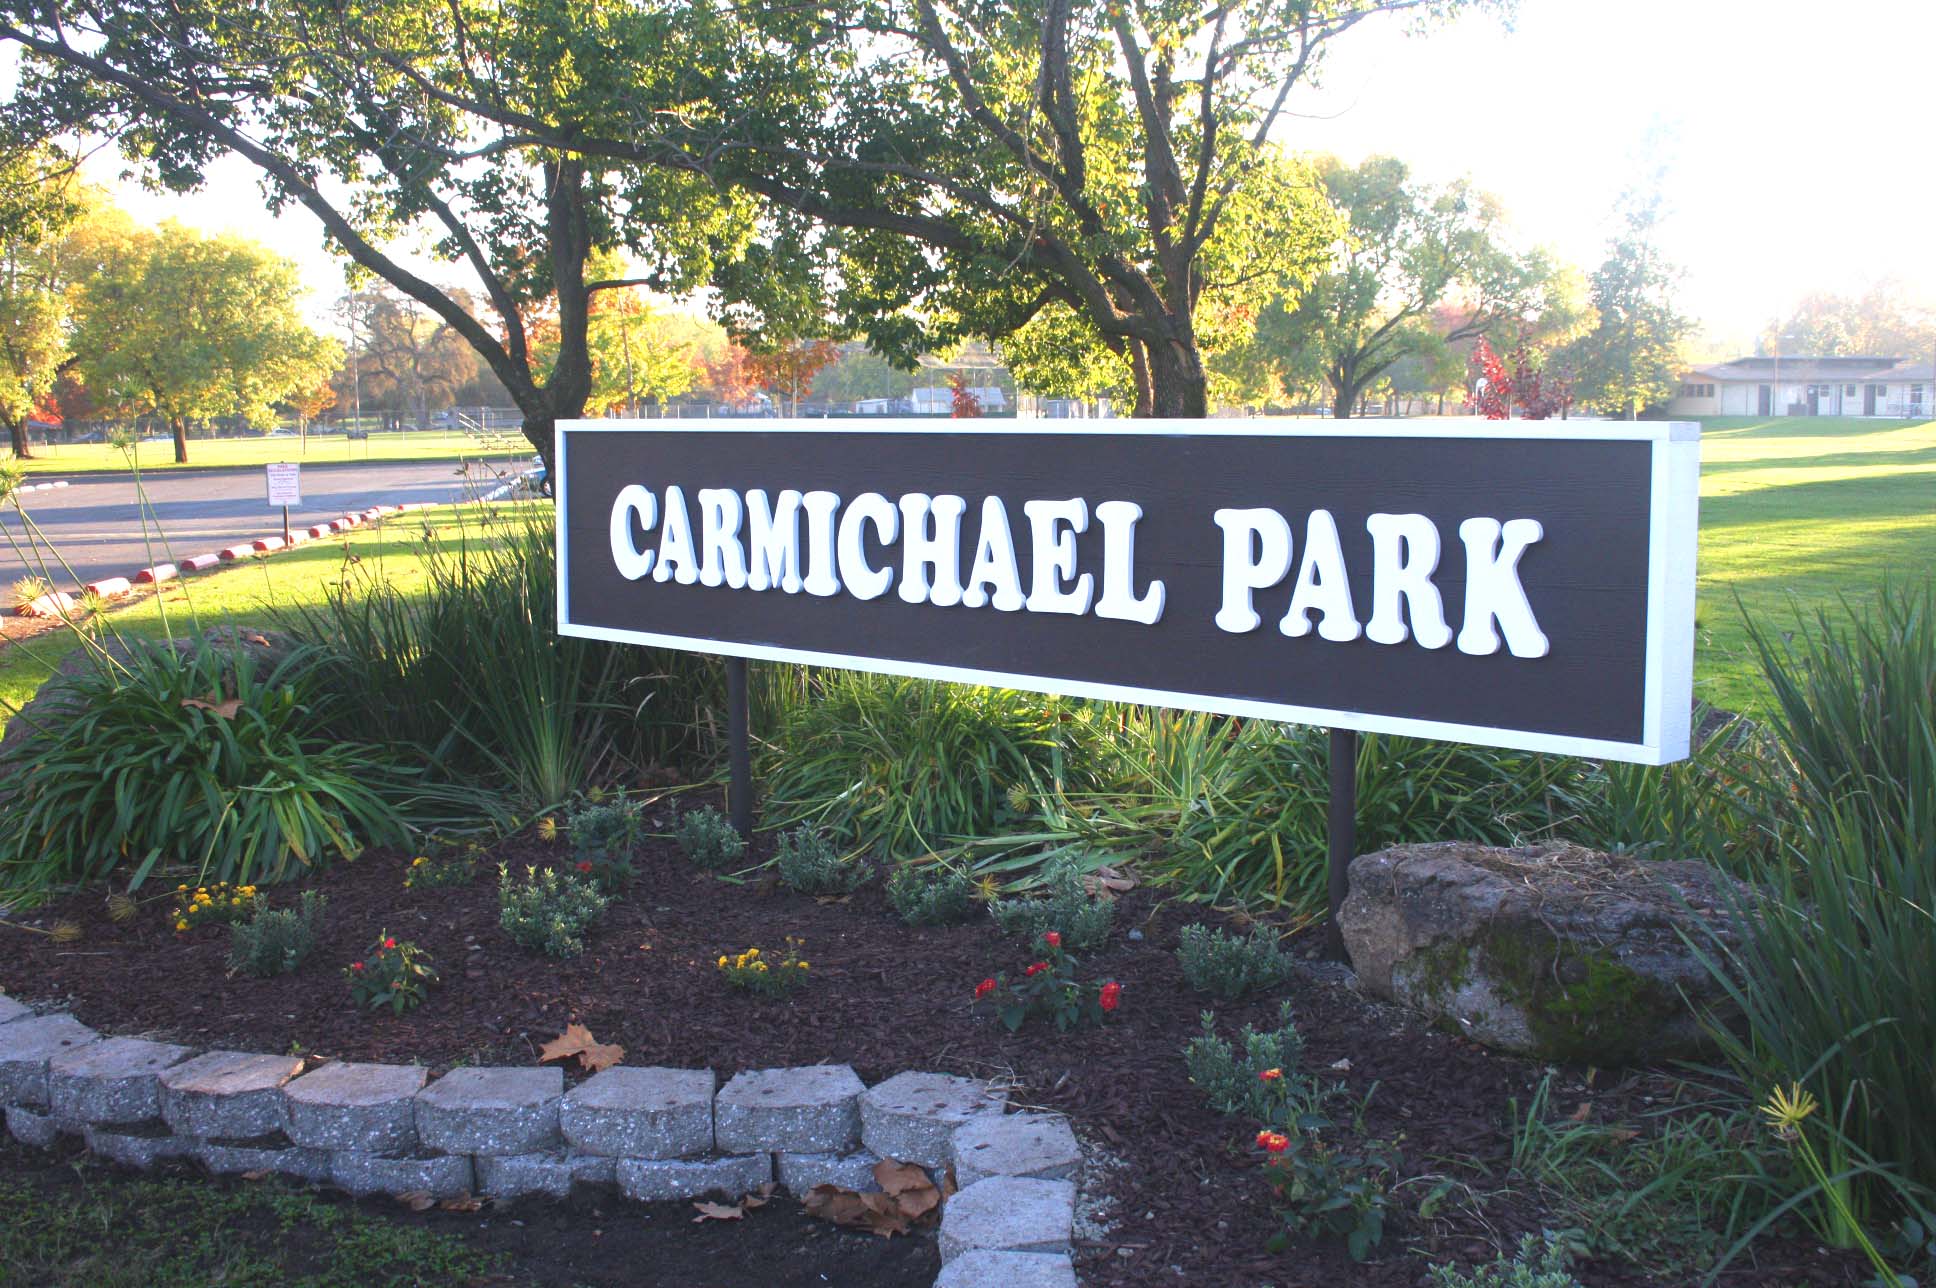
Introduction In our increasingly urban world, it has become of vital important to consider how nature will continue to coexist with our favored non-natural structures. Trees in particular are vital to human survival; they recycle carbon dioxide and produce the oxygen that we breathe. Tree canopy cover is important for several reasons, including .Tree canopy has been studied and suggested as a method of mitigation for the urban heat island effect (source). In addition, trees are simply enjoyable, and just about everyone can appreciate a day in a green, well-wooded park. Public parks are a place for repose, socialization, and are a place to enjoy nature. One of the most important aspects of trees is the shade canopy they provide.This project takes a look at the Carmichael Park in particular and seeks to quantify tree canopy cover for the purpose of using that canopy cover as a shade cover proxy. Shade provides cooling on hot days, and in the instance of this particular park, is of vital importance due to the presence of a disc golf course, playgrounds, tennis courts, and dog park. The analysis methods used to define this shade cover utilize GIS - in particular, geoprocessing tools like buffer generation - and auxiliary technologies like GPS. The result is a tree cover percentage and a map displaying tree locations and their canopies. | |
|
Background While not the focus of widespread study, tree canopy analysis has been done before and has turned out to be relevant and useful. In one case study in India, people of various backgrounds and industries were trained in the data collection of trees for the purpose of quantifying and analyzing urban tree cover. The article discusses tree cover in the urban areas of Gujarat, India. Written by H.S. Singh, it details how people, ranging from students to working professionals, were trained on handheld GPS units to utilize previously designed data dictionaries to track trees and enter data about them in order to get an idea of where the trees were and included thorough data collection. The Indian government actually instated a program for tree planting and hired people ranging from trained volunteers to biologists, who were instructed in how to properly measure trees for the survey. This included taking a measurement in DBH (diameter at breast height), stem diameters and counts, and a canopy measurement (Singh 2013). It emphasizes the importance of having trees in cities and lists the benefits. These include decreased rapid warming in summer, decreased CO2, and simply the fact that trees are nice and make people happier (Singh 2013). It outlines the methods used for gathering tree cover data, and then how the data was quantified for analysis. Another article used a GIS approach to analyze vegetation cover in Poland. This article, written by Oimahmad Rahmonov, focused on tracking the repopulation of plant species within abandoned limestone/dolomite quarries in an area of Poland with particular interest in the methods used to achieve this. Namely, the authors utilized aerial and orthophotography to track vegetation changes over time between the 1950s and 2009. Additionally, ArcINFO software was used to generate vegetation cover maps that represented change over time, showing plant succession and the spread or receding of certain cover types. The authors attributed the extent and speed of vegetation spread to the types of surrounding vegetation area already existing around the abandoned quarries as well as the amount of time that had passed since abandonment. It is concluded that GIS analysis significantly sped up the analysis of vegetation cover and provided an indispensable database for referencing. Altogether, vegetation analysis is typically done by recording and quantifying cover for various reasons. | |
|
Methods Tree canopy cover analysis is not new. It is used currently in order to note the locations of tree cover and how much cover there is. With the use of GIS, analysis is a relatively simple process that begins with data collection, although it can be labor intensive. First, tree locations must be recorded with a GPS unit. For this project, a Garmin eTrex Venture HC was used. It is not the most accurate GPS available, but typically comes within 3-4 feet of accuracy, and it comes with WAAS (wide area augmentation system) for additional accuracy. 
Garmin eTrex Venture HC. Source: Amazon.com Tree radii were recorded in the GPS unit as a “note,”, although this was time-consuming due to the lack of a true data dictionary. Each value had to be entered manually after navigating through the device’s menus. The radii were measured by approximating the longest branch of the tree and visually measuring its length. 
Diagram showing how trees are measured. Source: chears.org After the GPS collection was completed, the data was transferred to a computer via a micro USB cable to a program called Expert GPS. After being uploaded, the .GPX file was converted using ArcMap software into a point shapefile and given the CA State Plane Zone II projected coordinate system. Unfortunately, due to time constraints and inclement weather, not all trees were recorded properly. As a result, aerial photography was utilized as a proxy for tree locations. After putting the GPS points on a map, an ESRI basemap was added to the ArcMap document, and additional point features were added going off of the ESRI basemap in ArcMap. Google imagery was used as a cross reference. Additionally, a boundary of the park was not publicly available in shapefile format. Utilizing Google Maps and the ESRI basemap, a boundary of the park was hand drawn, or digitized, and used. After all of the data was on the map document and in the same coordinate system, the buffer analysis was run. This was done simply by using the Buffer geoprocessing tool and using the “RAD” (radius field) to generate buffers around all tree points. GIS acres were calculated in the park boundary shapefile, and GIS acres were also calculated after the tree buffers were generated. The results are shown below. 
A diagram of the results of a buffer analysis. Source: esri.com | |
|
Results
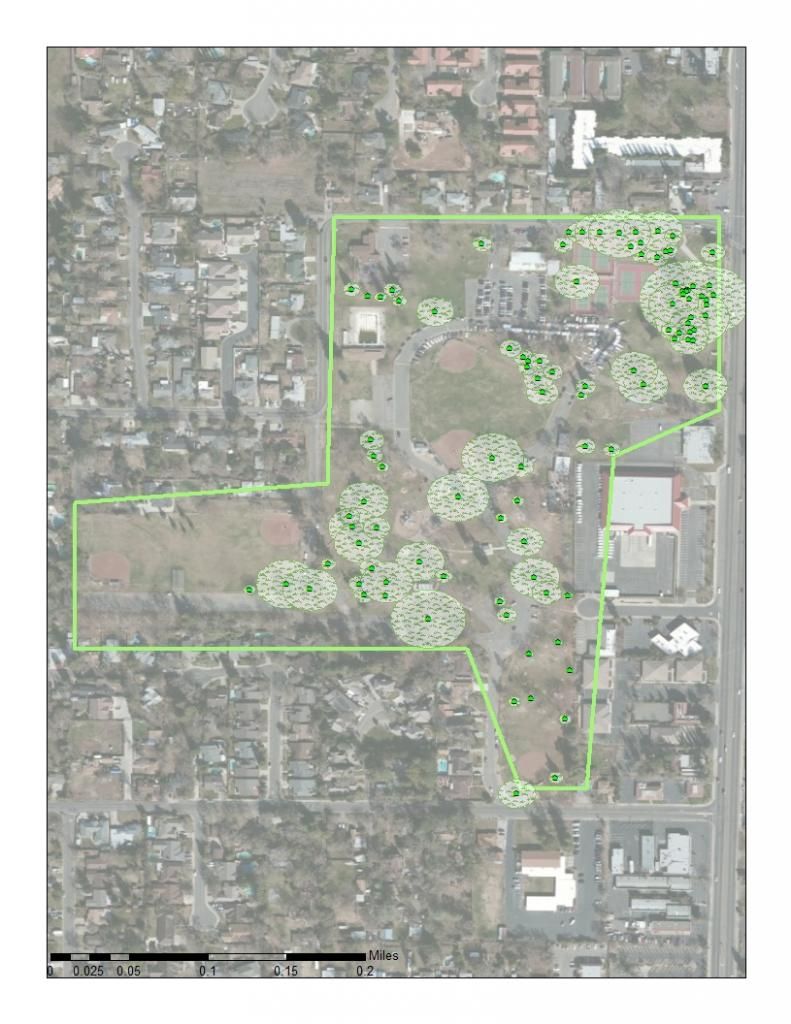
This map shows the locations of the GPSd trees as well as the trees placed using aerial imagery as a proxy. The circles you see are the buffers that are supposed to give a rough approximation of the circumference of the canopy. Additionally,a rough boundary of the park is shown. | |
|
Analysis The tree canopy cover in Carmichael Park is significant. By taking even a quick look at it from the street, you can see that it has many trees, and the variety of species and mature state of many of the trees all contribute to a healthy canopy. There are even small groves of grouped trees that, when looked at together, provide excellent shade cover when maybe one would not have been enough. Additionally, there are many young trees that seem to have been planted within the last few years that will add to the canopy as they grow. While the project had good intentions, the results fell short in several areas, unfortunately. Although I have done data collection in the past with an experienced coworker, I found it difficult to do alone. Recording data while taking GPS locations by yourself can be a challenge, and I was also using a GPS alone and not taking field notes. This resulted in less accurate data, and I worry that some diameters may have gotten mixed up and some trees recorded twice. The lower quality GPS also posed a few problems. It is not a bad unit in itself, but for the purposes of data collection, it fell short in a few areas such as ease of use in the field and thoroughness of data collection as well as accuracy. The weather was also not very desirable - it was cloudy, drizzling, and muddy - and the trees themselves may have posed their own problems to the GPS accuracy in the form of signal blocking. While the results were interesting, I have concluded that they are far too inaccurate to be useful. The type of GPS used, the use of aerial photography as a proxy for tree locations and canopy extent, and the amateur approximations of tree branch radius all add up to a rough version of tree canopy cover. The only thing the map provides is a very rough approximation of tee locations along with canopy extent. | |
|
Conclusions Part of any project design is retracing your steps and seeing where your methods could be improved. Next time, I would use a higher quality GPS for more accuracy equipped with a data dictionary and bring a partner, if available. Trekking alone in rain and mud made it difficult to record data alone despite having a small work area. I would also plan my route in advance and bring a paper map to trace a footpath; I found myself getting mixed up in the trees, and it’s highly possible some trees were recorded twice. Preparation seems to be key when it comes to field work. Additionally, I would also include more detailed data such as tree species and tree health to better describe the type of cover and perhaps aid in future planning. For example, an oak will provide more shade cover than a cypress for a time; the deciduous leaves of a maple will litter the park and only provide temporary cover, whereas a pine will provide year-round coverage, though not as large of a canopy extent. As for the analysis, I would just define the area early on so I know the exact swath I will be dealing with. The GIS analysis is solid and I would not change that. Additionally, it may have been nice to work in conjunction with Carmichael park staff. Maybe a tree shade map could have been provided for public use. I also think more data should have been taken for a more thorough and beneficial analysis. Tree cover alone does not tell us much. It would have been much more useful to include other things like a comparison of temperatures in the shade versus in the sun. All in all, this was a fun project and a good exercise in data acquisition. I see more clearly just how difficult and time-consuming it can be to create your own data, and you can run into several problems along the way. However, it is very rewarding to see your hard work in a visual format and to know that you produced something somewhat useful. | |
|
References Rahmonov, Oimahmad et al. 2014. “GIS Methods in Monitoring Succession Processes in Limestone and Dolomite Quarries.” Political Journal of Environmental Studies, 23(2):647-653. Singh, H.S. 2013. "Tree density and canopy cover in the urban areas in Gujarat, India." Current Science, 104(10):1294-1299. | |