| Title Youth Outreach in Sacramento County: A look into youth outreach placement methodology and the targeting of at risk communities. | |
|
Author Farl Grundy III American River College, Geography 350: Data Acquisition in GIS; Fall 2014 | |
|
Abstract This study will examine how and why organizations decide to place youth outreach programs in designated locations. Specifically, this study will look for a methodology used in the placement of youth outreach programs. With the aid of this methodology, this study will also apply it to Sacramento County in an attempt to identify possible areas of under service. Although numerous youth outreach programs exist in Sacramento County, many are narrowly directed toward youth who are experiencing specific types of problems. The aim of this study is to examine the more general type of youth outreach programs. Interviews with local professionals engaged in some of these more general programs revealed many factors that represent an increased need for general youth programs in an area. Extensive research turned up no agreed upon methodology for the placement of youth outreach programs; therefore a general methodology was assembled using the information obtained from local professionals. This methodology, in conjunction with existing general youth outreach programs and the service area of those programs, was used to determine which areas in Sacramento County were under serving the youth of the area. Analysis of the factors revealed previously unknown areas that were under served and also displayed a high number of the factors leading to the need for youth programs. I believe that this framework can be easily transformed to accommodate the needs of future researchers, in turn making it a stepping stone for more in depth studies. | |
|
Introduction After school hours provide today’s youth with many opportunities and challenges, which can be both positive and negative. While in school, children are supervised and given a well structured curriculum to follow, keeping them safe and intellectually stimulated. Conversely, after school hours do not hold this same supervision and structure. Now, with more and more parents working, children are increasingly left unsupervised after school and it is these after school hours that worry most parents, school officials, and the community alike. Between the hours of approximately 3pm to 6pm is where we find that school age children could best benefit from further supervision and structured activities, which can commonly be found in after school programs and youth outreach programs. This research will look at locally obtained factors in an attempt to determine the methodology behind where and why organizations locate youth outreach programs in Sacramento County.  This project focuses its attention on Sacramento County, which is home to Sacramento, the state capital of California. Sacramento County is home to over 1.4 million people, with a median household income of $55,846 (Sacramento 2014). Due to the location of the state capital within Sacramento County, it makes it one of the most influential counties in the state in terms of policy and law making. Sacramento County has 13 public school districts containing over 330 elementary through high school sites, which serve over 235,000 students between the ages of 5 and 18, all of whom come from very diverse backgrounds (SCOE 2014). The combination of these above mentioned factors help to make Sacramento County an ideal location for this study. Within the study area of Sacramento County, this study chose to focus on youth outreach programs which tend not to directly target themselves to a specific type of youth outreach such as: homeless youth, drug dependence, youth from battered homes, or youth with terminal diseases. This study elected not to include these sites, not because they lack importance to our youth, but because this projects focus is on youth outreach programs that provided a more general service reaching a wider range of youth. Also not chosen to include in this study were after school programs run by the local school system. Many of these after school programs are seen by students as “daycare”, causing many not to attend. Overall, programs chosen for this study were general in structure and charged no fee or very low fees for admittance. Compilation of this list of youth outreach sites required many hours of: research, phone calls, and emails as currently there is no master list of youth outreach programs in the County of Sacramento. The compiled list of youth outreach programs contains approximately 20 sites located throughout the county. These 20 sites are by no means a complete list of every youth outreach program in the county, but again are only those sites deemed to have a more general outreach focus. | |
|
Background “The block of unsupervised time, between the release of school and the return of parents from work, has led many adolescents to destructive and often criminal behavior” (Girod 2004). The Afterschool Alliance reported that, “24% (1,653,108) of California’s K-12 children are responsible for taking care of themselves after school and these children spend an average of 8 hours per week unsupervised after school” (California 2009). So what is the best way to provide these children with the physical and physiological security that they so desperately need in these after-school hours? Many suggestions have been made and currently the decision to extend school hours is gathering much traction. Through ever expanding pressure from parents, educators, and law makers the federal government now spends over 1 billion dollars annually on after school programs and California spends another 550 million annually (Dietel 2009). Federal money is granted to states through various programs including the 21st Century Community Learning Centers Program (Awards 2014).While this influx of money might seem well directed, there are many different types of after school programs and no one type has been documented to be better than the others. “Early enthusiasm for after-school programs led to rapid growth in their numbers but has not been accompanied by research sufficiently rigorous to produce unambiguous conclusions” (Apsler 2009). Many researchers have attempted to classify after school programs with little consensus. Researchers Hofferth, Brayfield, Deich, and Holocomb classified after school programs based on the goals in which they attempted to achieve, “(1) providing adult supervision and safe environments; (2) providing a flexible, relaxed, and homelike environment; (3) providing cultural or enrichment opportunities; (4) improving academic skills; (5) preventing behavior problems; (6) providing recreational activities” (Apsler 2009 ). Only with further research will we be able to determine which type of program is most effective in having positive impacts on today’s youth in their after school hours. So, how do organizations determine which areas are in need of such programs? Are there inherent underlying factors in a neighborhood, or group, which assist organizations in locating optimal sites for youth outreach programs? Does Sacramento County display any areas that might benefit from further youth outreach programs? A common universally held methodology for the placement of youth outreach programs might best provide answers to these questions. Commonly, youth outreach programs are directed toward “at risk” youth. The definition of which varies but according to Margarita Donnelly at risk youth are; "students who are not experiencing success in school and are potential dropouts. They are usually low academic achievers who exhibit low self-esteem. Disproportionate numbers of them are males and minorities. Generally they are from low socioeconomic status families. Students who are both low income and minority status are at higher risk; their parents may have low educational backgrounds and may not have high educational expectations for their children" (Donnelly 1987). So with at risk youth being the target of many of these youth programs, how do organizations determine where these “at risk” youth are located and in turn locate their programs? With little to no written information found containing a common methodology for the placement of youth programs, this research centers around methodologies common to the local facilities in Sacramento County obtained through personal interviews with local professionals from four Sacramento County youth programs. Through these interviews, local professionals stated that there were certain characteristics or factors that would lead to an increase in the need for youth outreach programs in an area. The most agreed upon factors included local school statistics and an area’s underlying socio-economic factors. Specifically, local professionals stated that factors such as: suspension rates, expulsion rates, drop out rates, median household income, and unemployment rates were the most significant factors to consider when determining an area’s need for potential youth outreach programs. These locally obtained factors provide the perfect starting point for the study of where and why organizations locate youth outreach programs in Sacramento County. | |
|
Methods Initial research failed to reveal a universal methodology used in the determination for the placement of youth outreach programs, however, the interview of local professionals provided key factors which became the basis for this research project. Interviews were conducted with: Genevieve Geignan of the Sacramento Food Bank, Curtis Harrison a branch director with the Boys and Girls Club, Marianne Bird a 4-H Youth Development Advisor, and Julie Rhoten with the Stanford Settlement Neighborhood Center (Geignan 2014; Harrison 2014; Bird 2014; and Rhoten 2014). These professionals were asked about which factors were the most important when considering the need for, and the location of, a youth outreach program. Unanimously, these professionals stated that although need is hard to determine and varies from location to location throughout an area, one common theme is to gear a program toward “at risk” youth. When asked what constitutes an at risk youth, again there was universal agreement. According to these local professionals the term “at risk” is most commonly used to classify youth that typically are struggling in school and usually come from economically disadvantaged families. Curtis Harrison stated that, “most gang members read at or below the third grade level and that is why many programs emphasize literacy in their program goals” (Harrison 2014). A collection of factors were mentioned throughout the interview process and became the basis in determining a local methodology for the placement of youth outreach programs. These factors included: suspension rates, expulsion rates, dropout rates, unemployment rates, and median household income. Another factor which was mention but was not included in this study was an areas crime rate. Crime rates were not included in this study due to the complexity on the reporting of youth crimes. Data was then collected regarding these factors. Suspension, expulsion, dropout rates, and location for all schools in Sacramento County were collected through the Sacramento County Office of Educations website and individual school websites. Tract level data regarding unemployment and median household income was obtained through the United States Census Bureau. Information regarding the locations of existing youth outreach programs was compiled through internet research and communication with local professionals in the youth outreach community. Data was transferred into an excel spreadsheet which was then able to be used in ArcGIS software. Once all of the data was entered into excel and in turn ArcGIS; each category was then reclassified and given a factor level which reflected how influential each factor was in the determination of need for a youth outreach center. These individual reclassified factors were then combined and attributed to school sites throughout the county. School sites were chosen to hold these values because this is where youth are concentrated at the end of the school day and the point at which they disseminate following dismissal from school. Upon the completion of data collection and the reclassification of said data, analysis of these factors and how they contribute to the placement methodology of youth outreach programs was then possible. | |
|
Results Analysis began by defining a local methodology in the placement of youth outreach programs. The previously mentioned factors reported by local professional as some of the most important were then combined with the locations of existing youth outreach programs and the locations of local schools.Suspension, expulsion, and dropout rates were collected for the 2010-11 school year. This year was chosen so that information collected from school sites would correspond with unemployment and income data collected from the 2010 U.S. census. Suspension, expulsion, and dropout rates were calculated by dividing the total number of incidents by the total enrollment and then multiplied by 100 (Table 2).Dropout rates were only reported for high school students. 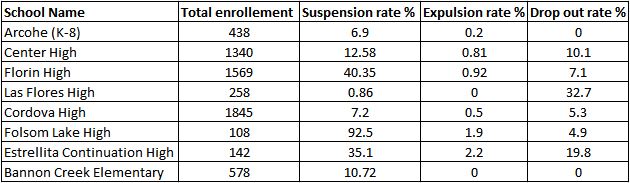 Census tract information was collected from the 2010 U.S. Census, with unemployment being reported as a percentage of the total tract population. Median household income was reported as a dollar amount. Median income represents that half of the tract population made more than the reported amount while the other half made less than that amount(Table3). 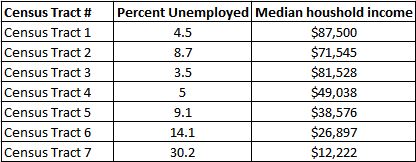 Existing youth outreach sites were compiled into an excel spreadsheet in the following format. (Table 4) Following the compilation of data, all individual factors were then reclassified and combined in order to better understand how the combination of factors influence the potential need for additional youth outreach programs. 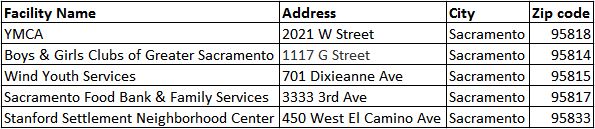 Suspension and expulsion data was reclassified into three categories or factor levels. A reclassified factor level of 2 was given to those values that fell within 1 standard deviation of the mean value, and a factor level of 1 was given to those values that fell below one standard deviation of the mean value. A factor level of 3 was given to those values that were 1 or more standard deviations above the mean value. Dropout data values were reclassified in the same fashion with a factor level of 1 given to those values that fell within one standard deviation of the mean value and a factor level of 2 given to those values that were more than one standard deviation above the mean value. Next, tract level data concerning unemployment and income was spatially joined to each school site that fell within a given census tract. Now each school site had associated with it all of the previously mentioned factors, which indicate an increased need for youth outreach. Reclassified combined factor levels ranged from a low of 5 to a high of 11. A low factor level such as 5 indicated that an area displays a relatively low total of the indicating factors. A high combined factor level of 11 indicated that an area exhibits a high total of the indicating factors, and in turn a greater potential need for youth outreach. Analysis was completed with the aid of ArcGIS software. The combined factors were input, and an interpolated surface was generated using the school sites as control points. An inverse distance weighted interpolated surface was used to estimate values where there was no data reported such as in between school sites. Now the entire county had either a known factor level, school sites, or an estimated value. Areas within Sacramento County which displayed higher factor levels were now easily distinguishable from those areas that displayed lower factor levels. Mr. Harrison stated, “most kids that attend our sites come from within about a mile and a half range” (Harrison, 2014). With this information, existing youth outreach sites were then overlaid onto the map and given a distance buffer of 1.5 miles. This distance was used to indicate the typical service range of a given youth outreach site. Analysis was completed by examining those areas that fell outside of the existing site buffers and that also displayed a high level of the combined indicating factors. These areas now represented the culmination of the analysis; which areas in Sacramento County are currently under served in terms of youth outreach programs. | |
|
Analysis The study derived methodology was first applied to the study area of Sacramento County. Reclassification of the factors made it possible to show how each factor influenced an areas need for youth outreach. Although individual factors are important, more important was the combined total of these factors. (Table 1) 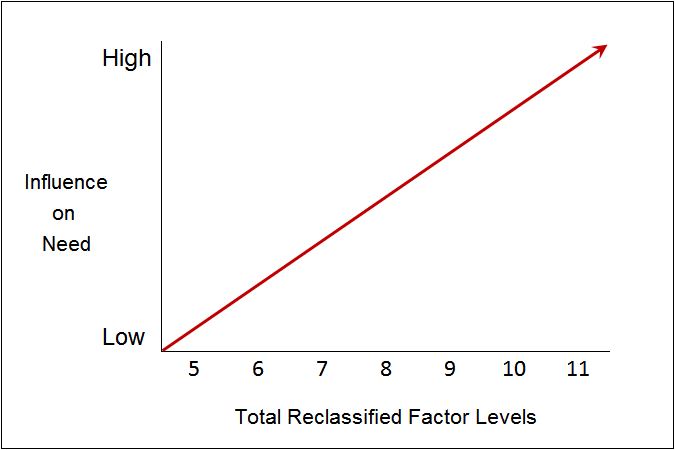 When reclassified and combined, these factors created a scale of need. Areas which displayed lower combined factor levels were in less need of youth outreach than were areas that displayed a higher combined factor level. The use of service area buffers around existing youth outreach sites showed those areas which were currently being well served in Sacramento County, while areas outside of the service buffers brought into view areas which were under served. Even though the identification of service areas provided insight into which areas might be underserved, it became more significant when combined with an area’s need for such services. When service areas were combined with estimated factor levels, it became visible which areas had both a high need and were currently underserved. It is these areas of increased need and under service that this study set out to determine. A map of Sacramento County was also employed to display estimated factor levels, school sites, existing youth outreach sites, and their service buffers. By displaying all of the factors taken into consideration, areas which could benefit from further youth outreach programs became clearly visible. (Map 1) Areas of extreme interest to this study included: Mather, Rancho Cordova, Carmichael/Fair Oaks, and Citrus Heights. Again, the results in these areas showed high factor levels coupled with no service from existing youth outreach programs. Although this study does not take into account every possible factor which might be influential in determining the need for youth outreach, it does take into account those factors described by local professionals to be of most importance. Therefore, by using these pre-mentioned factors in combination with the locally established methodology, the results of this study successfully identify areas within Sacramento County in possible need of youth outreach programs.  | |
|
Conclusions The results of this study indicate that although there is currently no standard methodology for the placement of youth outreach programs, it is possible to obtain local factors which can successfully be analyzed leading to the determination of need in an area. It must also be said that the complexity of this methodology can vary tremendously as more or less factors are taken into account. While it is important to include as many factors as possible, there too is a limit to the resources and time of every research study. Therefore, each study must include enough factors to prove itself useful, but not so many that it bogs down the study with impertinent information.So why is it that most youth outreach programs target “at risk” youth, yet there is no universal methodology for the placement of these programs? This is a perplexing question. What the study concluded is that although organizations use the same term “at risk” to classify their target population, there is no universal agreement on what exactly constitutes “at risk”. Therefore, with no clear definition of the underlying target population, how can one be expected to come up with a methodology for the placement of such programs? Being that most programs target a specific “at risk” youth, this most certainly accounts for the lack of a general methodology. Although I believe this research project achieved its goals, I also acknowledge that this project only took into account general factors which affect the youth in our area. But not every youth is burdened with such things as gang violence, drug abuse, or suicidal tendencies. In fact, from the onset of this project, it was this general youth population that the study had intended on examining. Even through the use of these somewhat general factors it was quite possible to determine which areas might be in need of further youth outreach programs. This study, although general in nature, provides a good stepping stone for other research projects. Reflecting on this study and its use of general factors, one can see that it might easily be implemented into other areas of the country. With simple modifications, this study could incorporate more in depth factors in order to target a more specific youth population. Also interesting is to see how this research might be carried on over time, revealing spatial patterns or movements of problem areas. This study provides the general framework for determining the need for youth outreach in our local community; further research in this area will only help to broaden our understand of this problem. | |
|
References Apsler, Robert. “After-School Programs For Adolescents: A Review of Evaluation Research.” Adolescence 44, No. 173, (2009): 1-16. Print. "Awards -- 21st Century Community Learning Centers." Awards -- 21st Century Community Learning Centers. U.S. Department of Education, n.d. Web. 19 Nov. 2014. Bird, Marianne. Personal interview. 27 OCt. 2014. "California After 3PM." Afterschool Alliance. JCPenney Afterschool Fund, n.d. Web. 18 Nov. 2014. Degnan, Genevieve. Personal interview. 26 Oct. 2014. Dietel, Ronald. "After-School Programs: Finding the Right Dose." The Phi Delta Kappan 91.3 (2009): 62-64. JSTOR. Web. 19 Nov. http://www.jstor.org/stable/10.2307/40345092?ref=search-gateway:0f6ba519b628f4d3b6fe6ca22dc340ad. 2014. Donnelly, Margarita. "At-Risk Students." ERIC Digests Series Number 21. ERIC Digests, 1987. Web. 19 Nov. 2014. Fagan, Abigail A. "Investment In Effective After-School Programs: Is It Worth The Risk?" Criminology & Public Policy 6.2 (2007): 319-26. Print. Girod, Mark, Joseph Martineau, and Yong Zhao. "After-School Computer Clubhouses and At-risk Teens." American Secondary Education 32.3 (2004): 63-76. JSTOR. Web. 19 Nov. 2014. Harrison, Curtis. Personal interview. 26 Oct. 2014. Rhoten, Julie. Personal interview. 27 Oct. 2014. "Sacramento County QuickFacts from the US Census Bureau." US Census Bureau. Web. 17 Nov. 2014. "SCOE | Sacramento County Office of Education." SCOE | Sacramento County Office of Education. Web. 20 Nov. 2014. | |