| Title Determining Vegatation Health in the Sierra Nevada Moutain Range in Order to Determine Fire Risk | |
|
Author Christy Cox American River College, Geography 350: Data Acquisition in GIS; Fall 2015 Contact Information: Current City: Sacramento, CA. Email: christyc107@gmail.com) | |
|
Abstract For Land SAT 8 data in the Sierra Nevada geographic extent, I created to two separate ISO Cluster Unsupervised Image Classification rasters on data from 2014 and 2015 to determinen areas of interest in changed from a healthy to a more stressed state. Identifying theses Areas of Interest (AOIs) is the first step in determining at risk areas of the Sierra Nevada in which the vegetation is showing signs of stress and therefore becoming ideal fuel for wildfires. | |
|
Introduction The western portion of the United States is currently in its 5th year of drought. Due to this prolonged drought forest fire have increased along with their intensity. Wildfires have destroyed nearly 7 million acres of forest across the United States in 2012 (Memmot 2015). With global climate change as unresolved in our future drought and fires are going to be increasingly common in CA. In order to protect our forest resources methods to monitor forest health need to take place so CA can practice fire suppression. One method I propose we use to monitor forest health is using remote sensing in order observe how vegetation health changes. Many plant stresses alter the reflectance, sensors can be used to detect vegetation stress (Lillesland, 2009). Delineating area of stressed and dying vegetation will allow responsible parties the opportunity to practice fire suppression where it is needed most. | |
|
Background California is currently in its 5th straight year of drought and is “currently facing one of the most severe droughts on record” (CA Drought). Not only are reservoirs shrinking but ground water is also being depleted at alarming rates. Furthermore, with reservoirs that are overextended, we have been depending on our groundwater supply more than ever. The depletion of the ground water resource enhances the impact of CA’s drought trees. In a study by the Department of Geography, Pennsylvania State University, Guarin found a positive correlation between tree morality and drought for multi-year periods of drought (2-5 years) (Guarin & Taylor, 2005). Since heat stress and drought cause “climate-driven” forest die-off around the world (Anderegg et al 2013). With the increasing trend of global climate change, reduced snowpack and shorter storm cycles for California, it’s important to study the rate in which trees die from climate-driven drought and possible mitigation methods. Daniel Berlant, Chief of Public Information for Cal Fire says, drought as not only impacted the forests in the Sierra Nevada in terms of tree death from higher temperatures baking the moister out of the soil and air causing stress on the trees themselves and leaves them vulnerable to fire, along with higher temperatures. (Carroll, 2015). With climate change we need to start thinking creatively how to protect remaining resources like forests. In years with average rainfall, typically 492 fires burning 1,300 acres will happen during January through April. This rate has doubled in 2015, with 838 fires burning 3534 acres in the same period. (Carroll, 2015). With continued drought, forest fires rates in CA will increase with greater intensity. Due to elevated fire danger in California’s Sierra Nevada mountain range I wanted to use remote sensing techniques in order to observe vegetation health and determine specific area of interest (AIO) in which a decline in forest health was detected. In determine AIO’s for stressed trees responsible parties can go remediate the situation and help reduce forest fire or forest fire intensity. | |
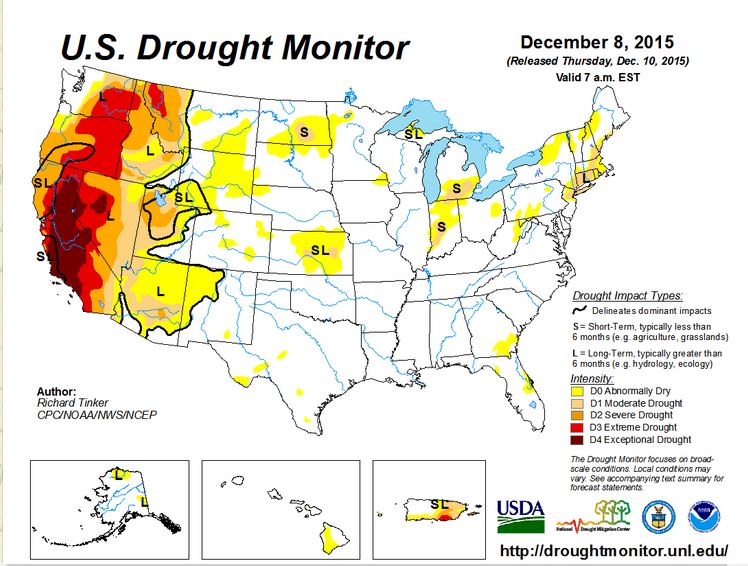
| Large regions of California are currently in an exceptional drought. In 2014 Govenor Jerry Brown decared “Drought” State of Emergency which has yet to be lifted. In the State of Emergency declaration, Brown not only calls state agencies ot use less water and expand water conservation public awareness campaign but he also called for more fighergiters (Bowen, 2014). In 2014, the states snowpack and statewide water content was measured to be at about 20 percent of normal. (Bown, 2014).
The map to the right was produced by National Drought Mitiagtion Center on behalf of the USDA and its shows the areas of the United States that are affected by the drought. In the whole continential united states CA and NV are the areas impacted most dramatically under the intensity status of “Exceptional Drought” Tinker (2015) . Therefore, I decided to analyze a portion of the Sierra Nevada Mt range right in the middle of the “Exceptional Drought” intensity. Tinker (2015) |
|
|
Methods To analyze change over time in vegetation health I downloaded LANDSAT 8 data from August 2014 and October 2015; this data has 30-meter resolution. The extent of the area covered North, East, South, West of Tahoe including the King Fire area that burned in 2014. I choose this geographic region to be my proof of concept test because of the King Fire area was included in the geographic extent. I felt with that known variable included I could analyze the results of my analysis better because there was such a large area where vegetation health declined significantly. To do the analysis I created an image composite with the composite tool in ArcGIS on all the layers. I then did my analysis on bands 5,6,2 and then looked at the changes on bands 5,6,2 from the year 2014 to 2015. Converted my image composite to a raster dataset with unique values corresponding to the bands with the ISO Cluster Unsupervised Classification tool. Once both 2014 and 2015 data had an ISO Cluster Raster output I then used the raster calculator tool to calculate the difference from 2014 to 2015. The raster calculator gave me one raster output which contained 9 values. Group 0 contained values in which there was no difference from year to year. |
|
|
Results To analyze change over time in vegetation health I downloaded LANDSAT 8 data from August 2014 and October 2015; this data has 30-meter resolution. The extent of the area covered North, East, South, West of Tahoe including the King Fire area that burned in 2014. I choose this geographic region to be my proof of concept test because of the King Fire area was included in the geographic extent. I felt with that known variable included I could analyze the results of my analysis better because there was such a large area where vegetation health declined significantly. To do the analysis I created an image composite with the composite tool in ArcGIS on all the layers. I then did my analysis on bands 5,6,2 and then looked at the changes on bands 5,6,2 from the year 2014 to 2015. Converted my image composite to a raster dataset with unique values corresponding to the bands with the ISO Cluster Unsupervised Classification tool. Once both 2014 and 2015 data had an ISO Cluster Raster output I then used the raster calculator tool to calculate the difference from 2014 to 2015. The raster calculator gave me one raster output which contained 9 values. Group 0 contained values in which there was no difference from year to year. | |
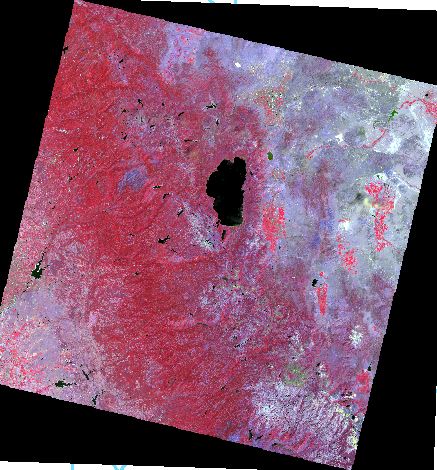 |
2014 Composite Image of LAND SAT 8 data showing vegetation health. Brighter reds represent "healthier" vegetation. vegetitation. |
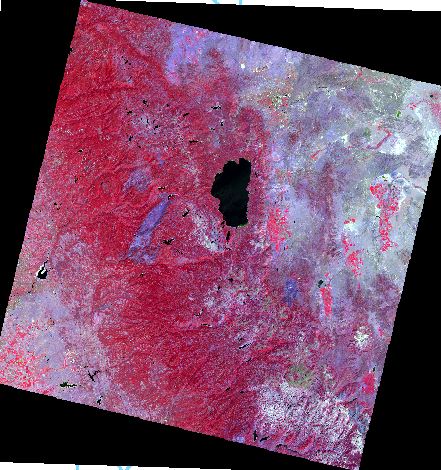 |
2015 Composite Image of LAND SAT 8 data showing vegetation health. Brighter reds represent "healthier" vegetation. In this image the fire scare from the King Fire is prominent. Also, we can see an obvious change in the rest of the image where there is a decrease in the healthy red vegetation color from 2014 to 2015. |
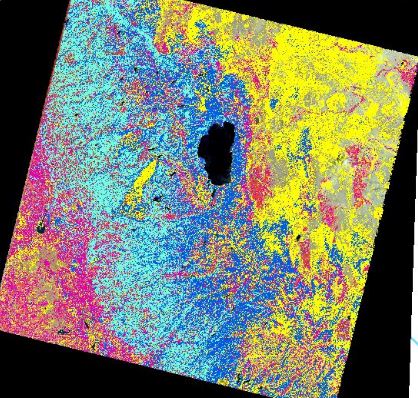 |
Colors are classified as follows: Light Blue: Healthy Vegetation Dark Blue: Medium Health Vegetation Pink: Med/Low Health Vegetation Yellow: Little Vegetation |
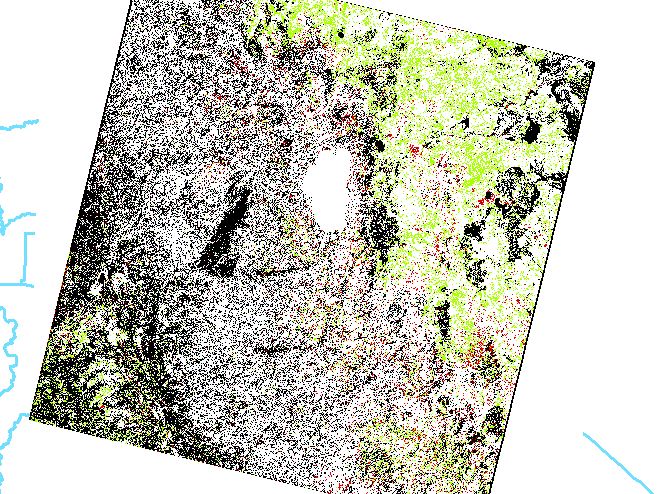 |
Areas symbolized with black area areas in which vegetation health has changed from 2014 to 2015. |
|
Maps
| |
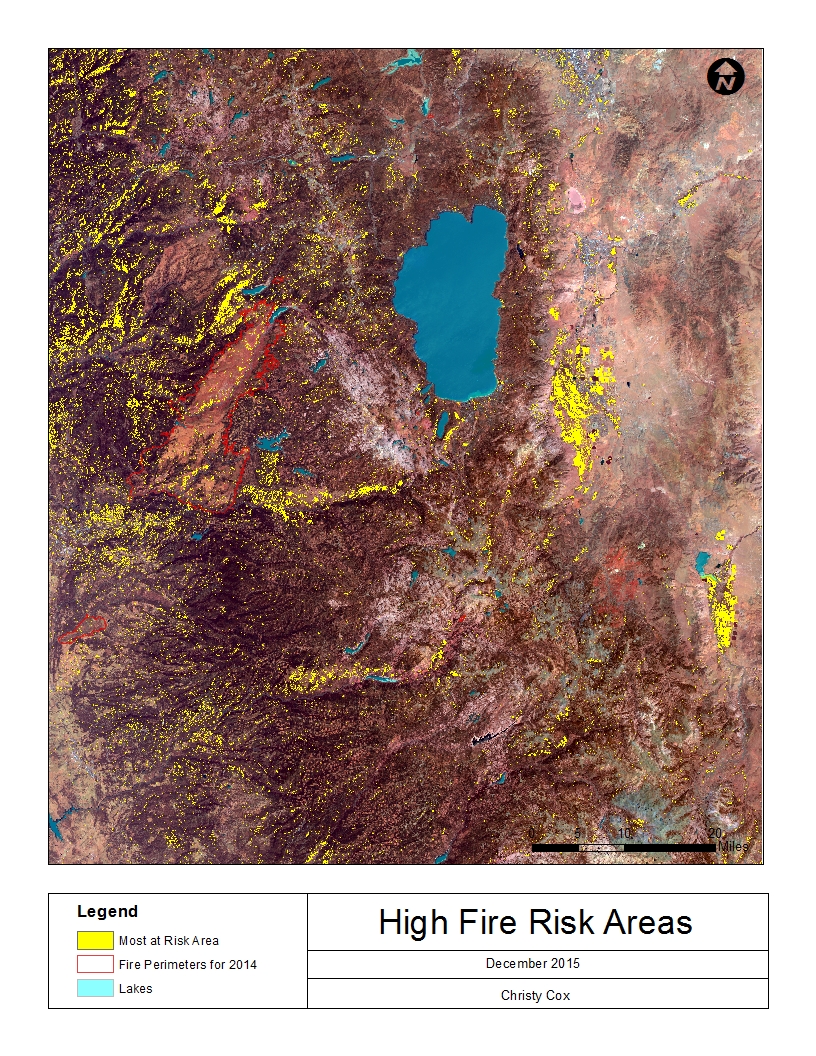 |
Areas in yellow represent areas where healthy vegetation was present in 2014 and now less healthy vegetation is present. Such areas represent an area of concern due to fire risk because these areas are high “fuel areas” where vegetation is drying out. The more concentrated the yellow and the larger the area represents equates to a greater fire risk. |
|
Analysis This research project focused on analyzing healthy vegetation that became “stressed” to determine fire risk over a 1 year period due to time constraints. Multi year analysis would provide a more in depth understating of change in the region. | |
|
Conclusions With the world’s carbon emissions on the rise global climate change is an expected problem for California. Despite the drought, California is going to see shorter storm cycles and less snow in the Sierra Nevada’s which will make water issues on going. With changing climate, stressed vegetation is going to be an ongoing issue. It is up to the public and government to find ways to manage our resources for future generations. Using Remote sensing to determine vegetation health is only the first step. Other factors that should be considered moving forward in order to practice proper fire suppression on stressed vegetation is steepness of slope, fuel, and hydrography. | |
|
References Anderegg, William R. L., Kane, Jeffrey M., Anderegg, Leander D. L. 2012. Consequences of Widespread Tree Mortality Triggered by Drought and Temperature Stress. Nature Climate Change. 30-36 Bowen, Debra. 2014. Governor Brown Declares Drought State of Emergency. Office of the Governor. https://www.gov.ca.gov/news.php?id=18368 California Drought. 2015. Ca.gov/drought. Carroll, L. 2015. California Drought Drives an ‘Explosive,’ Longer Wildfire Season. Science California Drought. www.nbcnews.com Guarin, A., Taylor, A. 2005. Drought Triggered Tree Mortality in Mixed Conifer Forests in Yosemite National Park, California, USA. Forest of Ecology and Management. Volume 218, Issues 1-3, 24, Pages 229-224. Lillesand, Thomas M. Remote Sensing and Image Interpretation. 6th ed. New York: Wiley, 2007. Print. Memmot, Mark. 2012. Wilddfires Have Burned Nearly 7 Million Acres So Far, Up 6 Percent From Last Year. NPR. http://www.npr.org/sections/thetwo-way/2012/08/22/159748679/wildfires-have-burned-nearly-7-million-acres-so-far-up-6-percent-from-last-year. Tinker, Richard. 2015. U.S. Drought Monitor CPC/NOAA/NWS/NCEP http://droughtmonitor.unl.edu/ | |