|
Title
California Drought – A Potential for Solar?
|
|
Author
Christina Crume
American River College, Geography 350: Data Acquisition in GIS; Fall 2015
|
|
Abstract
The drought in California has reduced the hydroelectric generation potential and
opened a door for an increase in solar generation. With the reservoir and dam
levels at historically low capacities, one major El Nino event will not be
able to replenish the capacity and restore the generation levels. Solar
generation demand and pricing make it a primary resource to replace the
hydroelectric generation and fulfill the shortfall during the drought.
|
|
Introduction
California has a vast water supply through many reservoirs and lakes
that provide hydroelectric generation to the state. In recent years, a major
drought has caused hydroelectric generation to dwindle to 30% of normal
generation. With meteorologists predicting an El Nino for the 2015-2016
hydroelectric year, will that be enough to bring the reservoirs to capacity
and regain the normal generation amounts? If an El Nino is predicted to be as
big as the biggest one on record, will generation levels rise? Will one El
Nino year be enough to fill the reservoirs and lakes to sustain the
hydroelectric generation needed to supply California? If the water levels
will not rise to the generation amounts needed, will other resources be able
to fill in the gaps?
|
|
Background
California’s drought has significantly reduced the hydroelectric,
clean generation that is produced for the state. Before the drought, which
started in 2011, the average mix of generation attributable to
hydroelectricity was 18 percent. Due to the drought, this percentage has
dropped to less than 12 percent. To
offset the demand, over 2,200 megawatts of solar electricity have been
installed to combat the loss of hydroelectric generation and the increase in
electricity demand (Scauzillo, 2015). Additionally
to make up for the shortfall, natural gas power plant use has
increased to fill this gap, which is more expensive and environmentally
damaging. Hydroelectric generation does not produce any air contaminants
whereas natural gas used in a combined cycle plant releases contaminants into
the air, an 8% increase for the 2011-2014 years. The additional cost passed
on to rate-payers for the use of natural gas is a steep $1.4 billion for the
years 2011-2014. If the drought continues, hydroelectric generation will
continue to decrease and our dependence on natural gas will increase unless
other renewable resources are added to the mix (Gleick,
2015). With the
expected El Nino in the coming months, the water levels could raise the
reservoirs and lakes which would increase the hydroelectric generation,
however for long term hydroelectric generation we need snowpack. With warmer
temperatures, increased snowpack is unlikely which would reduce the
hydroelectric generation in early summer months.
|
|
Methods
Data for the location and capacity of the reservoirs and dams in California were
collected and edited for accuracy before being compiled into a map for
California. The data was compiled from the Department of Water Resources Data
Exchange Center into an Excel spreadsheet and then converted in ArcMap as an
x,y dataset. Once the location information was obtained and corrected due to
inaccuracies, the capacity information was added for the total, El Nino 1998,
and current October 2015 dates.
|
|
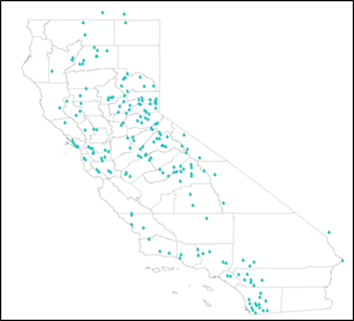
California dams and reservoirs
|
|
Individual
dam and reservoir capacity information was consolidated to get a total. For
the dams and reservoirs in which the data was missing for one or more area,
the totals were omitted to prevent skewed data.
|
|
Total Capacity (af)
|
93,670,832
|
Percentage of Total Capacity
|
|
1998 El Nino Capacity (af)
|
88,867,266
|
95%
|
|
Current Capacity (af)
|
36,132,507
|
39%
|
|
|
Hydroelectric
generation totals for 1998 and 2014 were compiled. The total installed
capacity of hydroelectric in California is 13,841 MW. With a standard 37%
capacity factor, a normal year of generation would amount to 44,861,449 MWh
of hydroelectric generation. In 1998, 48,757,000 MWh were produced and in
2014 16,469,573 MWh were produced. This is consistent with the articles and
data that the hydroelectric generation is around 30% of the normal amount.
The difference in generation is 32,287,427 MWh or 3,686 MW of capacity.
|
|
Generation Calculation
capacity
(MW) x hours per year (h) x capacity factor (%) = annual generation (MWh)
|
|
1998
|
2014
|
Difference
|
|
Generation (MWh)
|
48,757,000
|
16,469,573
|
32,287,427
|
|
|
The
next step is to calculate how much capacity is needed. Assuming the El Nino
event of 2015-2016 will provide half of the water and snowpack, the new
capacity levels would be approximately 32,613,287 MWh. With this, the
remaining generation needed is 16,143,714 MWh. A solar facility has a
capacity factor of 25%, so the installed capacity needed to produce the
generation shortfall from hydroelectric is 7,375 MW.
|
|
Results
The reduction in hydroelectric generation seems to be an
open door for solar generation. In 2014 over 2,500 MW of new solar was added,
and 2015 estimates are on par for around 2,500 MW to be operational by the
end of the year. Currently there are 9,846 MW of solar that has been
permitted and are in preconstruction phases which estimate to be operational
by the end of 2020. With lowering solar production prices and an increase in
demand, it appears that the drought is guiding solar as a primary resource to
fulfill the hydroelectric generation shortfall.
|
|
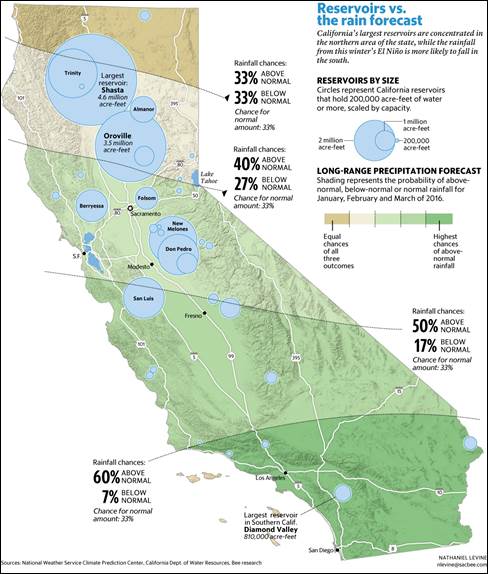
Analysis
The
current capacity levels of the reservoirs and dams in California are a mere
39%. Almost 75% of the reservoirs and dams are in Northern California and in
a typical year approximately 75% of the precipitation falls in these areas.
However during an El Nino event, most precipitation falls in Southern
California and is washed out to sea due to the lack of reservoirs and dams
for storage.
While
the drought is an unfortunate event, it has helped pave a faster route for
more solar generation due to the increase in electricity demand. Going on the
fifth drought year, California needs to make a change to make up for the
shortfall in hydroelectric generation and keep up with the increasing
electricity demand for the growing state. Solar has provided an inexpensive
and lucrative fix because it can be quickly permitted and installed compared
to a gas fired power plant and has a softer public view.
|
|
Discussion
While it was easy to obtain the data, performing the accuracy checks to ensure
the data quality was time consuming. Additionally tracking down numerous to
obtain the different portions of the data and cross referencing the time
frames was challenging. For example, the reservoir and dam capacity levels
were provided for the previous month, however the generation amounts were for
the previous year. To combat this, the current capacities were used and then
compared to the generation totals and an assumed capacity was used.
Additionally, predicting the future has no science – so estimating the amount
of precipitation and the duration for the El Nino event was hard. Speculating
on the 1997-1998 El Nino, estimates were taken and incorporated.
|
|
Conclusions
Overall
it appears that one El Nino event will not pull California out of the multi-year
drought it has entered and will need to supplement the hydroelectric
generation until the reservoirs and dams return to normal capacity levels.
California has planned for the shift in water levels and has already begun
permitting solar generation facilities and in Los Angeles county a new
reservoir was built to capture storm runoff in Southern California. While the
change may not happen overnight, progress and changes have been implemented
to budget for the hydroelectric shortfall and shifting water demands and
resources. The future of the state’s generation is not as dim as predicted,
but rather bright.
|
|
References
California Energy Commission. 2015.10.5. California Hydroelectric Statistics
& Data. http://energyalmanac.ca.gov/renewables/hydro/index.php
Department of Water Resources California Data Exchange Center. 2015.10.5.
California Data Exchange Center – Query Tools. http://cdec.water.ca.gov/cgi-progs/queryCSV
Department of Water Resources California Data Exchange Center. 2015.10.5. End
of Month Reservoir Storage. http://cdec.water.ca.gov/misc/monthly_res.html
Department of Water Resources California Data Exchange Center. 2015.10.5.
Most Recent Reservoir Storage Data. http://cdec.water.ca.gov/cgi-progs/getAll?sens_num=15
Department of Water Resources California Data Exchange Center. 2015.10.5.
Reservoir Information. http://cdec.water.ca.gov/misc/resinfo.html
Gleick, Peter H. 2015. Impacts of California’s Ongoing Drought:
Hydroelectricity Generation. http://pacinst.org/wp-content/uploads/sites/21/2015/03/California-Drought-and-Energy-Final1.pdf;
2015.10.12
Ross, Tom et al. April 1998. National Climatic Data Center Technical Report
98-02. The El Nino Winter of ’97 – ’98. http://www1.ncdc.noaa.gov/pub/data/techrpts/tr9802/tr9802.pdf
Sabalow, Ryan. October 4, 2015. Will El Nino
‘solve’ drought? Not if the rain falls in Southern California. http://www.sacbee.com/news/state/california/water-and-drought/article37743690.html
2015.10.4
Scauzillo, Steve. Drought is killing
California’s hydroelectric power. Can solar make up the difference? http://www.cadrought.com/drought-is-killing-californias-hydroelectric-power-can-solar-make-up-the-difference/
2015.09.21
State of California Geoportal. http://atlas.ca.gov/download.html#/casil/inlandWaters/Hydrologic_Features/2.0
2015.10.14
United States Energy Information Administration. September 2015. https://www.eia.gov/electricity/monthly/epm_table_grapher.cfm?t=epmt_6_07_b
2015.10.5
|