| Title VINEYARD SITE SUITABILITY ANALYSIS, AMADOR COUNTY, CA | |||||||||||
|
Author William Edmonson American River College, Geography 350: Data Acquisition in GIS; Spring 2015 Phone: 209-304-9959 Email: willed32@gmail.com | |||||||||||
|
Abstract This paper illustrates the steps and procedures taken to create a vineyard site suitability model and perform a vineyard site suitability analysis for Amador County. Included in this paper are: the resources and literary works that were used to help perform the analysis, a brief history of the area of interest, analysis results, and numerous figures and maps to provide a visual representation of analysis methods performed. | |||||||||||
|
Introduction Amador County is now being well recognized for its award winning wines and gaining international acclaim. The first vines in Amador County were planted in the mid to late 1800’s during the gold rush era by European immigrants. Today, there are over 40 different wineries located in Amador County. The scope of this analysis is to examine and determine the soil, slope, aspect, land use, average distance from water source, and elevation properties of vineyards located in Amador County. A model will be created that outlines the analysis steps taken to determine the parameters that qualify for suitable vineyard locations within Amador County. After the parameters have been established and ranked, in order of suitability, for each input layer of the model, the suitable vineyard classifications will be applied to all of Amador County. The final model will produce a vineyard site suitability layer that will determine locations in Amador County that are best suitable to plant new vineyards. | |||||||||||
|
Background The most critical component of this analysis was defining the required tasks and procedures for creating a proper suitability model and performing a proper site suitability analysis. These steps were well outlined in Anthony Mitchells book, Modeling Suitability, Movement and Interaction, serving as the foundation of this project (Mitchell, A. 2012). During the research phase of this project it became apparent that there were no known published articles or books detailing a vineyard site suitability analysis of Amador County, CA. In general, the majority of the articles found for vineyard site suitability analysis pertained to areas in the Eastern United States, Oregon, and Washington. These areas have a significantly different climate than the Shenandoah Valley of California. Using these articles to define the data parameters that constitute as suitable for a vineyard location was not going to be applicable. However, these articles were useful in defining the potential data that I would need for this project and define why that data would be needed. It was clear that I was going to have to define my own parameters by examining the data of pre-existing vineyards. In addition, I have had prior work experience on a vineyard in the Shenandoah Valley of Amador County. My own experience and personal knowledge on vineyards was also used in some of the analysis steps outlined in this paper. Soils: Soils data plays an important part in the suitability analysis because it defines areas that are well-drained. Vineyards can be grown on a large variety of soil types, but the drainage is critical for a vineyard based on its ability to, hold water and not waterlog, drain well, and be permeable (Happ, 2015). Elevation: Elevations role in deciding the potential site of a new vineyard is important because locations of higher elevations are more susceptible to frost and can damage the vines. Slope: Slope is important because increasing slopes cause problems using vineyard equipment (Duff, A. and Jones,G. 2015). However, a certain percentage of slope is needed to aid in the proper drainage of a vineyard. Aspect: Aspect is essential in determining the amount of solar radiation a vineyard will receive at certain latitudes; at higher latitudes the sun’s rays pass through a larger layer of the atmosphere (White, 2009). Thus, the strength of the sun’s rays will be less at higher latitudes. Since there is less sun intensity in northern latitudes, the amount of direct sun is important. (Happ, 2015). Land Use: Land use is used to determine areas of high building density, roadways, and other structures that may limit the available land for a suitable vineyard site (Happ, 2015). Distance to Water: Water is important when defining suitable locations for vineyards because vineyards need water to grow. By examining the hydrography of a region, areas that accumulate rainfall can be established, as well as larger water bodies and streams. Climate: In this analysis, climate wasn't used as an input for the site suitability model. The Shenandoah Valley and Fiddletown regions of Amador County, which make up the majority of vine acres in Amador County, are Approved Viticultural Areas (AVA's). An AVA is defined as a delimited grape growing region with geographic features that set it apart from surrounding areas. One of the most notable geographic features that set the Shenandoah Valley apart is the Mediterranean-type climate, which is representative of the most viticultural climatic zone worldwide (Watkins, 1997). For this reason, the climate of the study region was already established to be suitable for vineyards. | |||||||||||
|
Methods To begin the process of creating a model to extract data from vineyard locations and determine suitability classifications, I needed to determine the data that would serve as the input layers for the suitability model. After this was determined, I then needed to collect the data for the analysis. Multiple layers were used in this analysis (both vector and raster) to include: a NED(national elevation dataset), Land use data, county boundary, vineyards, aspect, slope, soils, and hydrography. These datasets were collected from multiple sources. The NED was collected from the USGS (United States Geological Survey) National Map Viewer Website . After viewing the available datasets that were within the area of interest, a 10m resolution NED tile was chosen. Once the NED was downloaded for the area of interest, I then projected the dataset to the coordinate system NAD_1983_UTM_Zone_10N. The NED tile was used as the geoprocessing extent, and default cell size for all other layer inputs for the site suitability model. By doing so, this allows for all inputs to be of the same cell size and same extent for the final Sum and Weighted Overlay. The land use and County Boundary shapefiles were downloaded from the Amador County GIS data webpage. These files were exported to the project file geodatabase and assigned the same coordinate system, NAD_1983_UTM_Zone_10N. The next step in the data collection process was to collect the vineyard data. For this portion of the data collection process, I visited the USDA (United States Department of Agriculture) website. From there I was able use the CropSpace map viewer to upload the Amador County boundary shapefile, as the area of interest, and download the Cropland data layer in .tiff format. In order to extract only the grapes data from the cropland data layer, the raster calculator tool was used. (Figures 1.0 and 1.1)  
(Figures 1.0 and 1.1) Once the grapes were successfully extracted, the layer was overlaid imagery to examine the data. While examining the data it was determined that the grapes layer incorporated some error and did not accurately represent grape locations. Figures 1.2 and 1.3 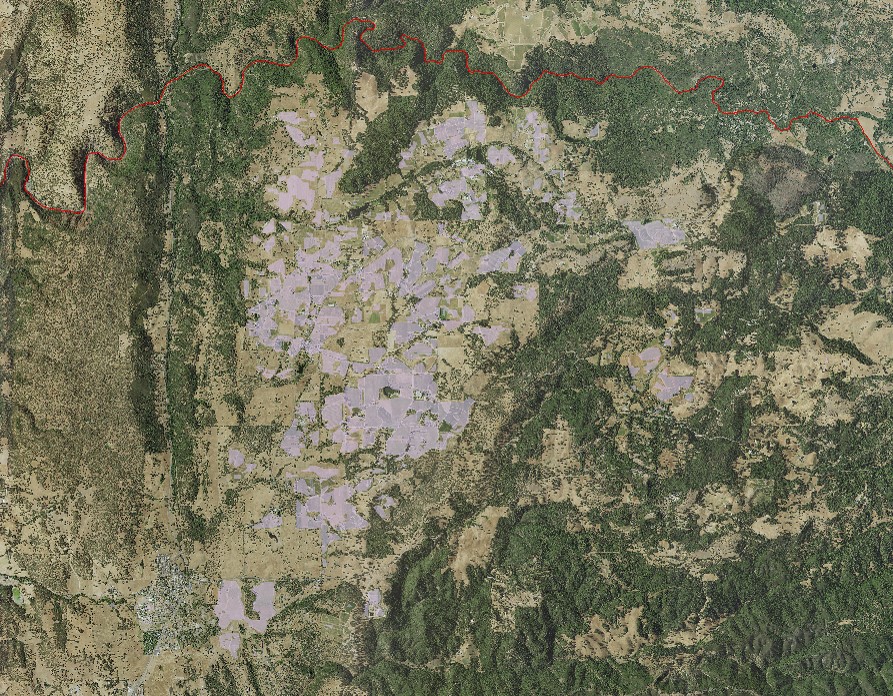 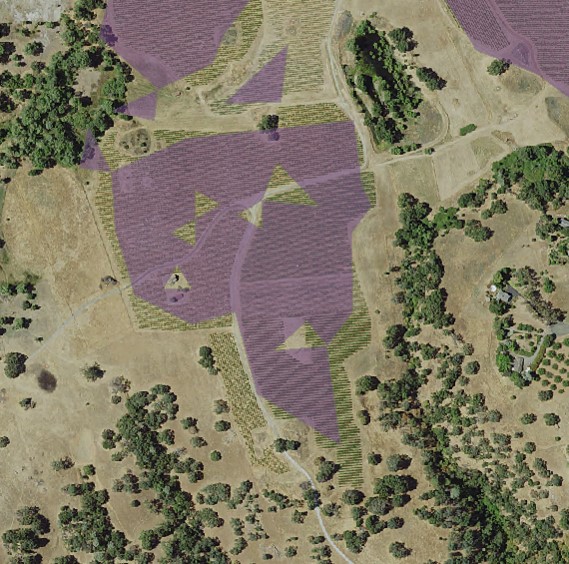
(Figures 1.2 and 1.3) By closely examining the extracted grapes layer to the imagery, it was clear that the data needed to be fixed to improve the accuracy of the data. The data was converted from raster to vector format using the "Raster to Polygon" tool to properly correct the errors in the data and correctly align the grapes data to actual vineyards by using heads-up digitization accompanied with aerial interpretation. In order to further improve the accuracy of the data, an on-site visitation of several vineyard locations was conducted. This was done by using an Online Vineyard Data Collector Web mapping application that I created in ArcGIS Online, depicted in Figures 1.4 and 1.5. 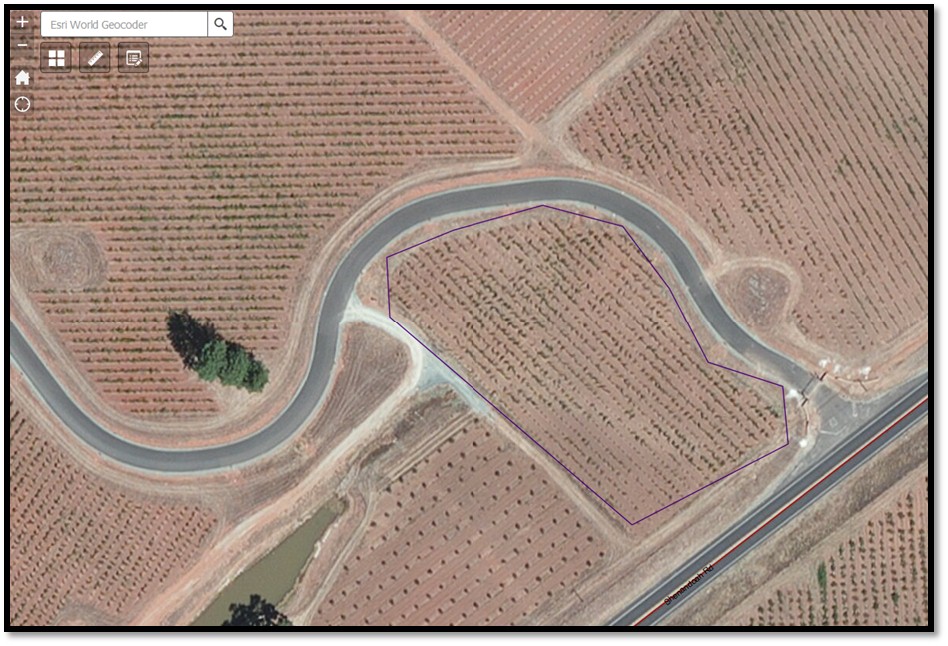 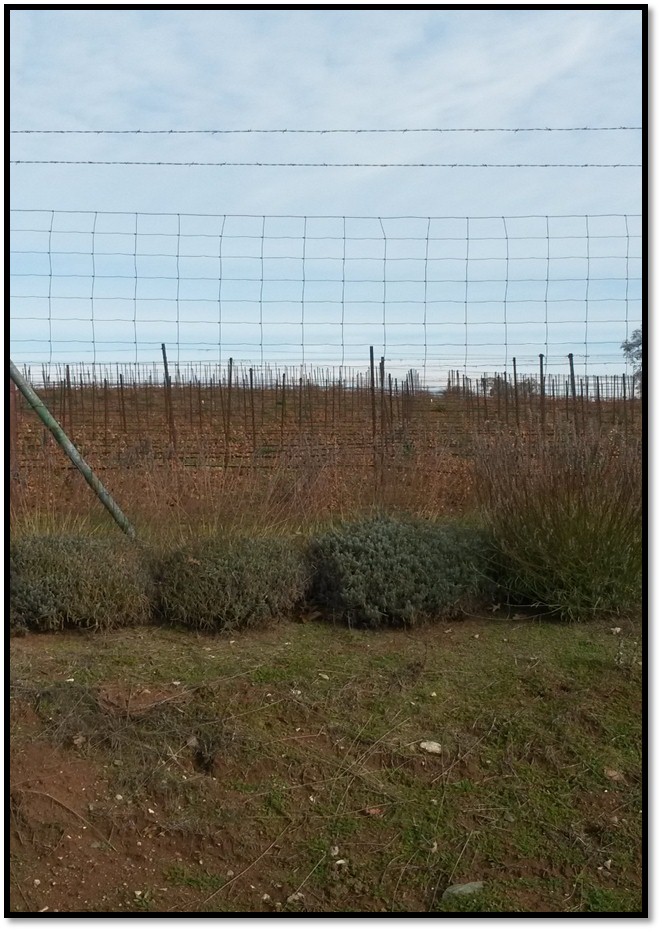
(Figures 1.4 and 1.5) Once the final vineyard vector layer was determined to be of suitable accuracy, it was ready to be used in the model as the data extraction feature class to determine the classification properties of the suitability model. An example of the corrected vineyard layer is shown in Figure 1.6. 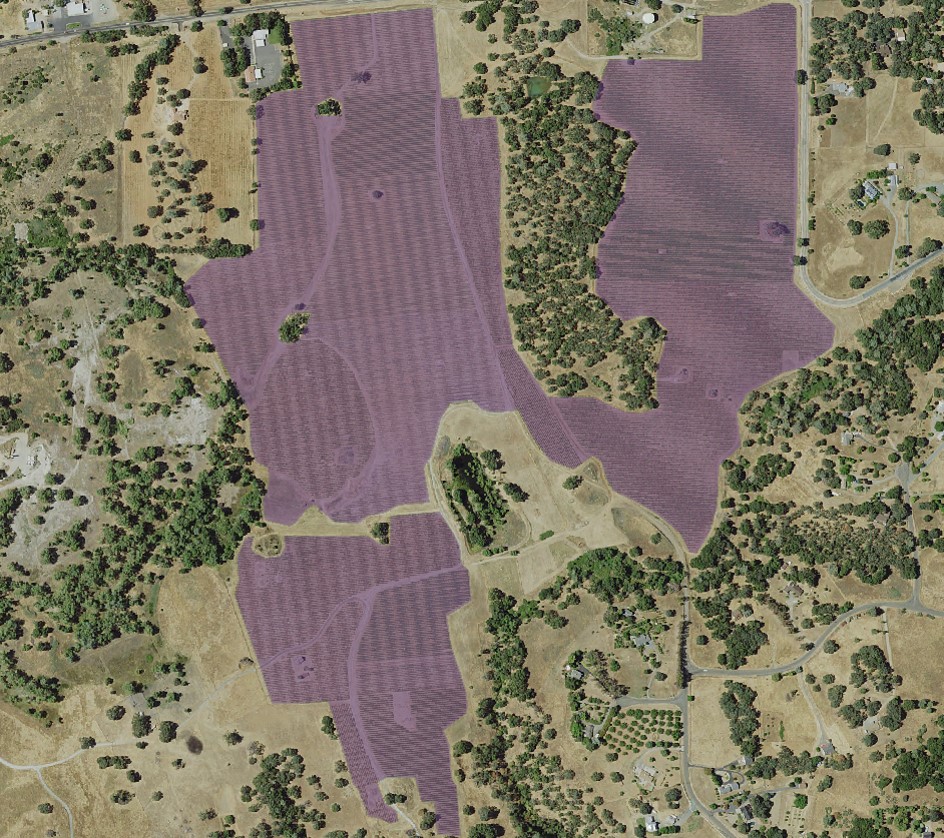 (Figure 1.6) Next, a Hydrography dataset was needed to determine the average distance of vineyards from a water source. Hydrography data for Amador County was downloaded from the USGS (United States Geological Survey) website, national map viewer. The data was then clipped to the Amador County boundary. The "Euclidean Distance" tool was used, with a maximum distance of 1000 meters. (Figures 1.7, 1.8, 1.9, 2.0)  
(Figures 1.7 and 1.8)  
(Figure 1.9 and 2.0)  
(Figures 2.1 and 2.2) For the remaining layers that would serve as input data for the suitability model (slope, aspect, elevation), the NED tile was used to generate these files using several tools in the "Spatial Analyst" toolbox. The data was extracted using a mask of Amador County. Figure 2.3 (Slope), Figure 2.4 (Aspect), Figure 2.5 (Elevation).  
(Figures 2.3 and 2.4)  (Figure 2.5) Now that all the data needed in order to perform the analysis was collected, the data then needed to be extracted by using the vineyard data layer as the mask and clip feature. By doing so, six output layers were generated with data from each layer pertaining only to pre-existing vineyard locations. For the raster layers (Elevation, Slope, and Euclidean Distance) suitable classifications were determined by examining the histogram in the layer properties. Using a manual classification method, class breaks were determined by the amount of pixels that were contained in each class. The higher the pixel count for each classification indicated which class breaks contained the majority of vineyard data. An ordered hierarchy was then established from a scale of 1 to 5. 5 meaning the "Most Suitable" because it contained the highest amount of pixel values, and 1 meaning the "Least Suitable", containing the least amount of pixel values. The figures below depict the histograms and output of the extracted data from vineyard locations. Figures 2.6 and 2.7 (Slope and Slope Histogram), Figures 2.8 and 2.9 (Elevation and Elevation Histogram), and Figures 3.0 and 3.1 (Euclidean Distance and Euclidean Distance Histogram).  
(Figures 2.6 and 2.7)  
(Figures 2.8 and 2.9)  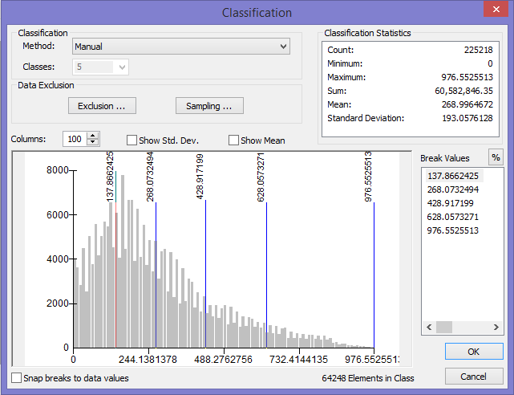
(Figures 3.0 and 3.1) To determine the suitable classification of the Aspect layer, a reclassification was performed to assign the range of degree values that represented Flat, North, Northwest, Northeast, South, Southeast, Southwest, East, and West to numerical values of 1-10. A field was added to the output reclassification file and then the field calculator was used to divide the pixel count for each value 1-10, by the total pixel count to determine the percentage of area occupied by each value. A scale of 5 to 1 was used to reclassify the final aspect suitability layer. 5 meaning the greatest percentage of area occupied, "Most Suitable", and 1 meaning the lowest percentage of area occupied, "Least Suitable". (Figures 3.2 and 3.3)  
(Figures 3.2 and 3.3) The suitable soils data classification was determined by examining the attributes of the soil data that pertained to pre-existing vineyard locations. In the attribute table of the soils data, two fields were of primary concern, "farmindcl" and "drclassdcd". The "farmindcl" field identifies soils that are best suitable for agriculture. The "drclasscd" field identifies how well the drainage of that particular soil is. Farmland of state wide and local performance with well-drained soil were given values of 5, prime farmland with well-drained soil a value of 4, and not prime farmland with well-drained soil a value of 3, and the remaining values of 1. This suitable classification was determined because the parameters of the soil data, listed above, given the values 5-3 were the parameters contained in the extracted soils data for vineyards. (Figures 3.4 and 3.5)  
(Figures 3.4 and 3.5) Suitable land use classifications were determined by examining the attributes of the clipped land use layer for vineyard locations. 8 different land use classifications existed for vineyard locations. These classes were then assorted in descending order by shape area, distinguishing the classes that made up the majority of vineyard locations. Again, the data was reclassified to a scale range of 5 to 1, 5 meaning "most suitable", and 1 meaning "least suitable". (Figures 3.6 and 3.7)  
(Figures 3.6 and 3.7) Each step that was used to determine the suitability classifications was outlined and used in a Model created in Model Builder. The model used to extract vineyard data to determine suitable vineyard classifications is shown in Figure 3.8. 
(Figure 3.8) Now that the data classification and parameters had been determined for suitable vineyards, the next step was to create a suitability model. By taking the determined suitability classifications and applying them to their respective data layers for the entirety of Amador County, I was able to generate 6 different layers that were classified as suitable for vineyard locations. Each data layer was reclassified to a scale of 1 to 5, 5="Most Suitable and 1="Least Suitable" Two methods were used to generate an overall suitability layer by combining all 6 six data layers. The first, was a "Fuzzy Overlay" approach. A fuzzy overlay was generated by using the Raster Calculator tool to add the classification values (5 to 1) for each data layer and then divided by 6 ("%suitable_slope%" + "%Suitable_aspct%" + "%suitable_elev%" + "%suitable_dist_fl%" + "%Soils_PolygonToRaster1%" + "%zoing_rc%") / 6. It is divided by 6 because there are 6 layers in the output. Meaning the highest possible sum of any area would be 30, then divided by 6 would give a total score of 5. The second method used was the "Weighted Overlay" approach. This meant that the 6 data sets were also added together, but in turn were multiplied by the percentage of importance of that layer. For example, for this particular analysis Slope was more important than Aspect. Slope was given the weight of 25%, meaning that the total sum would be multiplied by .25 and added to the sum, and Aspect 10%, meaning that the total sum would be multiplied by .1 and added to the sum. This was done for each layer. (Note: The vector layers were converted to raster to be used in both overlays) Figures 3.9 and 4.0 (Slope Suitability Layer/Table) Figures 4.1 and 4.2 (Aspect Suitability Layer/Table) Figures 4.3 and 4.4 (Elevation Suitability/Table) Figures 4.5 and 4.6 (Distance from Water Suitability Layer/Table) Figures 4.7 and 4.8 (Soils Suitability Layer/Table) and Figures 4.9 and 5.0 (Land use Suitability Layer/Table) and Figure 5.1 (Suitability Model).  
(Figures 3.9 and 4.0)  
(Figures 4.1 and 4.2)  
(Figures 4.3 and 4.4)  
(Figures 4.5 and 4.6)  
(Figures 4.7 and 4.8)  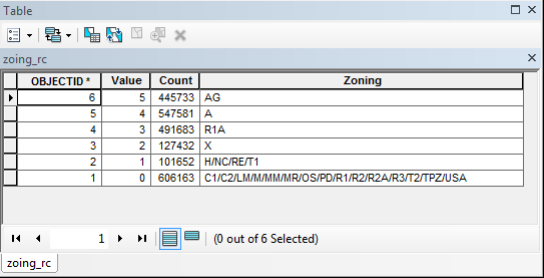
(Figures 4.9 and 5.0) 
(Figure 5.1)
|
Results
The final results of the analysis resulted in two output raster layers that depict areas in Amador County that are most
suitable for vineyard locations.(Figures 5.2 and 5.3). A raster format was chosen for the final output of the analysis
because the majority of the input layers were raster data. I also chose to create a model in Model Builder for each step of
the suitability analysis so that it may be used again in the future. Rather than doing every individual step for this analysis,
it can now be completed by running each of the models created, significantly reducing the production time.
Figure 5.2: Suitable Vineyard Locations (Weighted Overlay) 
Figure 5.3: Suitable Vineyard Locations (Fuzzy Overlay)
| Analysis Analyzing the
results showed a definitive difference between the weighted overlay and the
fuzzy overlay. The weighted overlay seems to be more accurate than the fuzzy overlay. Even
though there are less suitable locations for vineyards in the weighted overlay output, the
distinguishing of the importance of each layer by assigning weighted values seems to have made it more accurate. The
completed Models worked well and ran without any problems. However, creating the models
was a time consuming process in itself. The most difficult process of this analysis
was examining and understanding the data that was extracted from vineyard locations
and used to define suitability classifications for the Vineyard Site Suitability Model.
| Conclusions Overall, both models worked successfully and generated
a final output layer to be used in further analysis of the region. While I'm not an expert in viticulture,
I did use my own personal knowledge from working on a vineyard, located in the Shenandoah Valley region of Amador County,
to help aid in the decision making process of determining suitable classifications for the data. However, in order to determine the
validity of each model, further consultation with viticulture experts and vineyard owners in the region would
have to be conducted. This model should not be used as a definitive answer of where to plant a new vineyard
in Amador County. Rather, it serves as a guideline, and provides a foundation for further enhancements to the model
as more research is conducted.
| References Duff, A. and Jones, G. 2015. The Climate and Landscape Potential for Wine Production in the North Olympic Peninsula Region of Washington: http://home.sou.edu/~gjones/North%20Olympic%20Peninsula%20Report.pdf . Happ, J. 2015. Vineyard Site Suitability in Minnesota: http://www.gis.smumn.edu/GradProjects/HappJ.pdf . Mitchell, A. 2012. The ESRI Guide to GIS Analysis Vol.3.Modeling Suitability, Movement, and Interaction. Watkins, R.L. 1997. GeoJournal. Vineyard Site Suitability in Eastern California, 3(1):229-230. White, R. 2009. Oxford University Press, Inc. New York.Understanding Vineyard Soils
| |