Title
Sacramento Parks and Income Disparity
Author Information
Jason Finley
American River College, Geography 350: Data Acquisition in GIS; Fall 2015
Abstract
This is my summary there are many like it but this one is mine.
Introduction
The City of Sacramento maintains over 3,200 acres of park space ranging from
large sports complexes like Granite Regional Park to the smallest of urban
green spaces like Zapata Park just north of downtown. However, when looking at
different parks one sees a vast difference in the size and complexity of parks
in varying neighborhoods. Operating under the assumption that park space and
the maintenence involved indicates a level of civic
investment, this study will exam the relationship between family income, proximity
to parks, the size of parks in acres and the ratio of populations of families
to park space in an effort to explore if park space is an equal public
investment or a privledge of the privledged.
Background
In the Urban Parks Institute's 1997 publication Parks as Community Places,
author and UC Berkeley Associate Professor of Architecture, Galen Cranz defines 3 stages of the American park's evoltion. From 1850 to 1900 "The Please Grounds"
were typically parks for the wealthy characterized by "pastoral landscape
with buildings subordinate to the overall landscape." At the end of the
19th century, idealist planners pushed "The Small Park Movement,"
bringing parks to the tenement districts for the working class. In the 1930s
through the 1960s the concept of the park shifted to that of a recreational
facility. (Cranz 1997)
According to the National Institutes of Public Health, 43% of all park users
live within 0.25 miles and another 21% living within 0.25 to 0.5 miles.(Cohen and Mckenzie 1997)
Methods
For this study, I needed a Parks shapefile and a city
boundry file available on the City of Sacramento GIS
data page. Through the ESRI Data & Maps for ArcGIS, I used demographic
information in a blockgroups shapefile
and clipped it to a City of Sacramento boundary line. Within the blockgroups layer is information on Total Population in
Families and Average Household Incomes foryear 2013.
A buffer of 0.25 miles was created around all existing parks in the city and
the blockgroups were clipped so only data
representing what was inside the buffer-zone around the parks would be
available. I then used definition queries to show only blocks to create three
distinct income groups: Household incomes of <$40,000, Household incomes
between $40,001 and $80,000 and Household incomes of >$80,001. Each layer
was then symbolized to show Total Population in Families.
To find the Park acreage, each bufferzone
corresponded to a specific park. I summarized the acreage of the park and
collected all the sums for each income group. Using the same method I summed up
the family populations near parks and simply divided total park acreage by
total family population to find how many acres per family population member
there are. To make the data even more understandable, I will convert acres to
SQFT to show SQFT of parks/person.
Results
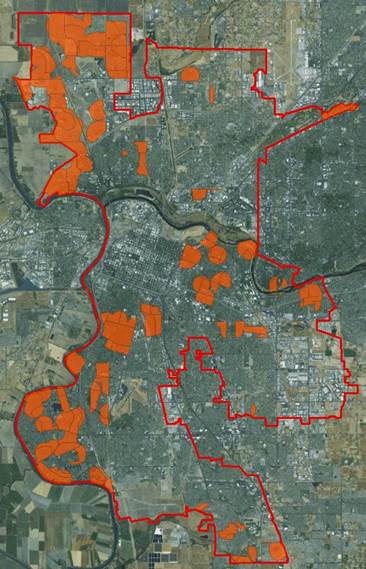
The results of the 1/4 buffer around Sacramento City Parks to select polygon blockgroups:
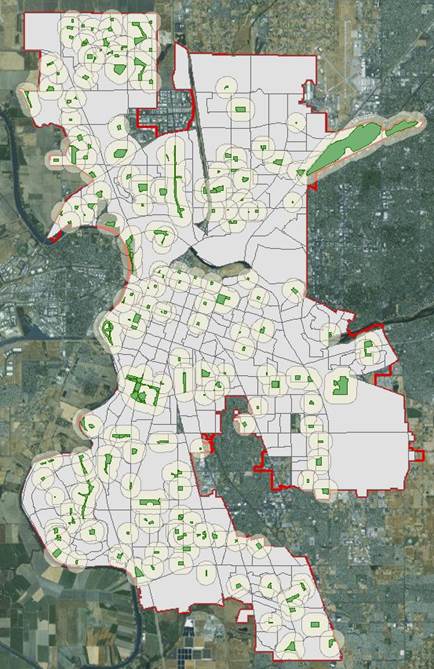
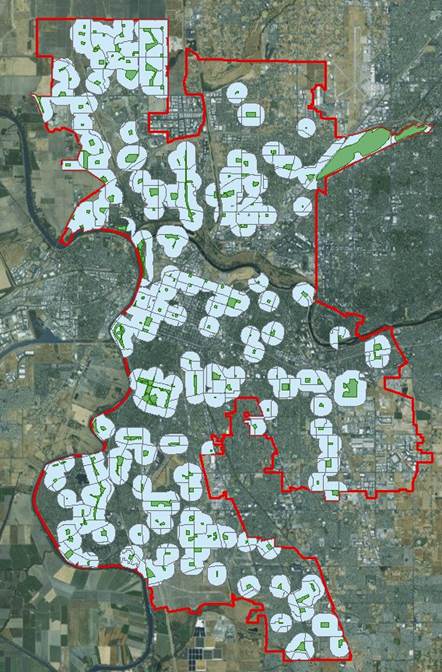
I then used three definition queries to extract Household income groups out of buffers: (Lower Income, Mid Income, and Upper Income)
Analysis
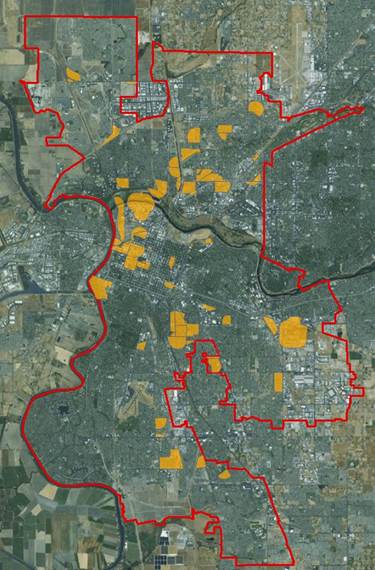
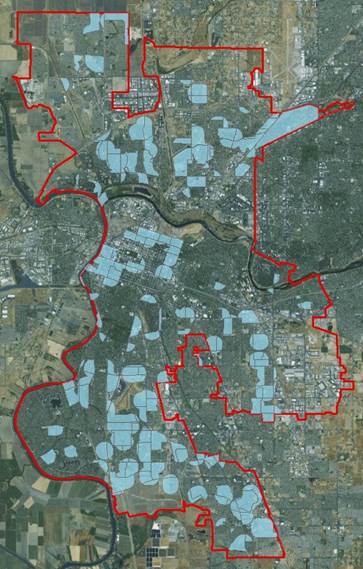
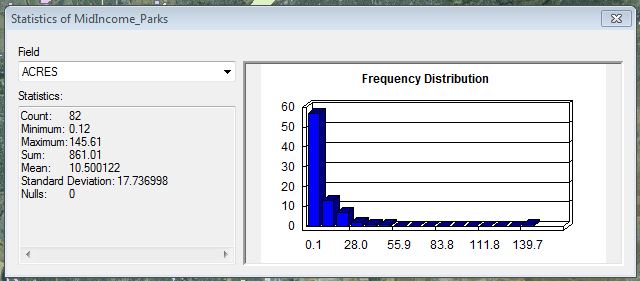
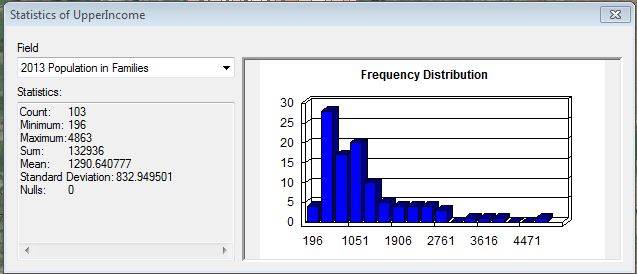
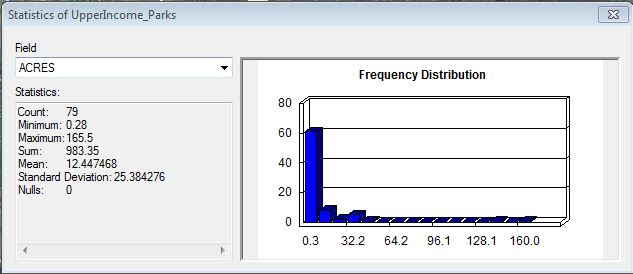
For each Income group I
looked at the statistics option for the “2013 Pop. In Families” and the total
acreage for the coresponding parks:
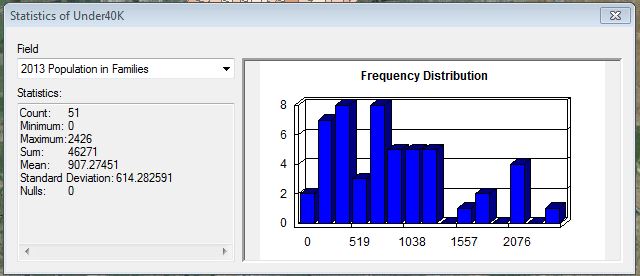
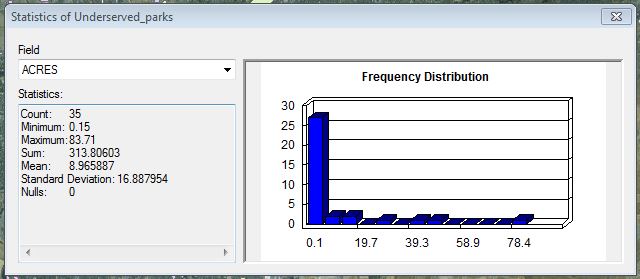
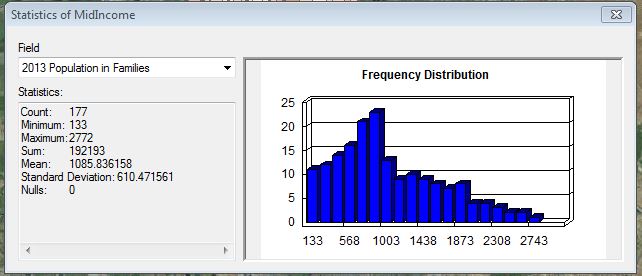
At this point it would seem
as though the statistics suggest that the park acreage is fairly equal. :
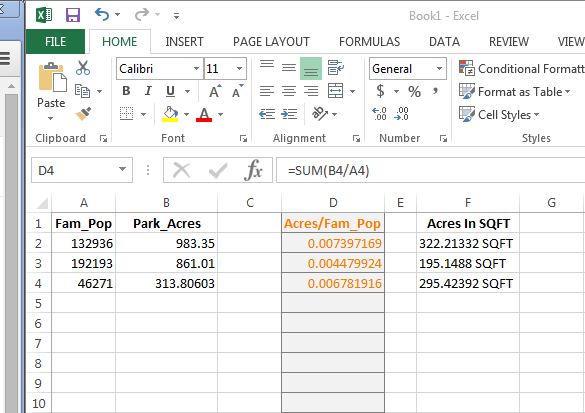
When converting acreage to SQFT, it would seem as
though the parks are evenly distributed among income classes. However there is a far more interesting
statistic that must be factored in before making this assumption. Although the National Institutes of Public
health stated that a majority of park useres live within a ¼ mile distance; I
wanted to see how many people outside that buffer zone there were and see who
has park access more.
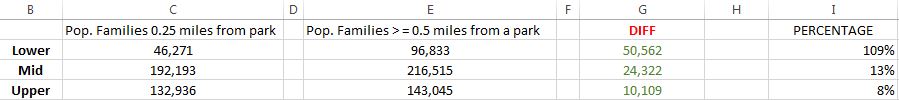
The trend did not shock me, as the idea that upper
income people would live closer to parks makes sense when you factor in the
effect of proximity to a park on home value.
I am however, shocked by the percentage group in those that don’t live
close to parks. The study appears to be
a success in that it answers the question based on 2013 standards . The raw data by itself suggests that parks are
a priviledge for those who can afford to live close to them.
Conclusion
In conclusion,
I believe I have acquired enough information to make the claim that parks are
almost certainly a luxury. What I was
unable to find was the construction dates of new parks. Some of the newest parks in the city are
located in southern Sacramento where the largest populations of low income and
immigrant families reside. This would
suggest that perhaps there is an effort to bring parks to the poor such as in
the early 1900s when idealist and humanist urban planners and landscape
architects brought green spaces to the working poor. This data shows that, at least in Sacramento,
we need to do more bring equal access to civic resources like parks, green and
open spaces to the new working poor.
Parks play not just a vital role in the health of a community but in the
social fabric of the community itself.
References
Crantz, Galen. Urban
Parks of the Past and Future , Project for Public Spaces http://www.pps.org/reference/futureparks/
Contribution of Public Parks to Physical Activity, National
Institutes of Public Health http://www.ncbi.nlm.nih.gov/pmc/articles/PMC1805017/
Data Sources
County of Sacramento GIS Data
Distribution Library
City of Sacramento GIS Portal