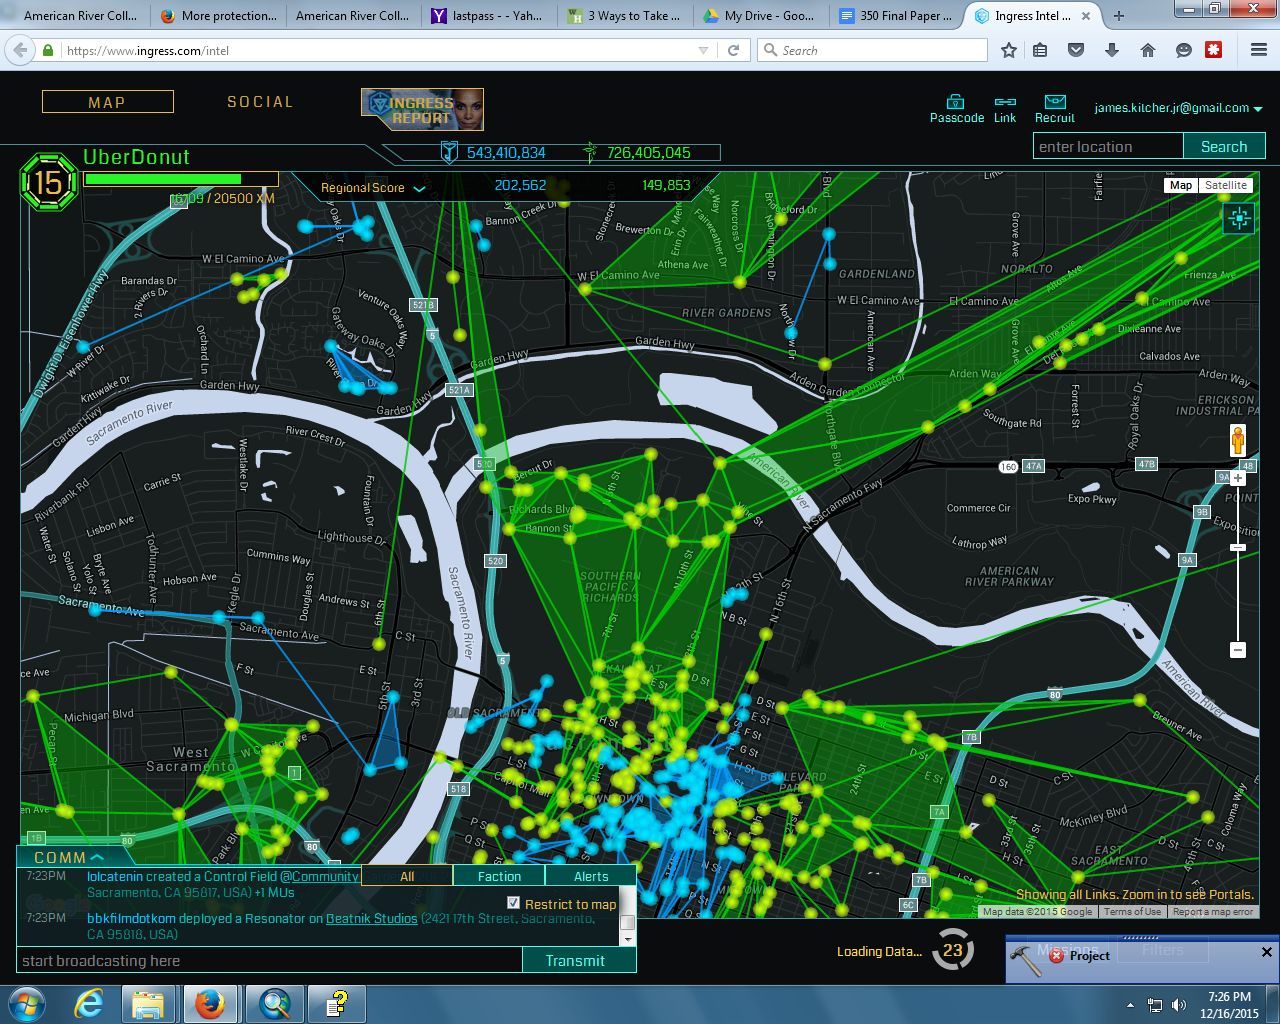
Ingress.com/intel screen.
Data on the exact whereabouts and numbers of homeless in the Sacramento area is minimal. Day in and day out, they’re present in our lives out and about in Sacramento. That said, they’re mostly unaccounted for, the exception being the HUD mandated bi-annual PIT survey for those organizations receiving funds. My recreational time spent biking around Sacramento while playing the augmented reality game, Ingress, has made me more aware of the presence of the homeless in our public spaces.
Introduction
Ingress.com/intel screen.
At the outset, my goal was to create a small scale, Sacramento / Natomas version of Hamlet and Pardue’s project: Informal Networks: Mapping Homeless Spatial Patterns and mash it up with coordinate data of “portals” from the game, Ingress. In concept, I understood / understand the tasks I’d have to complete. In practice, it’s been a whole different story and it’s been a lot of learning and effort with not a lot to show. What I’m sure are simple tasks have taken an inordinate amount of time.
As for the project idea, In order to replicate Hamlet’s work, I went about gathering datasets from the City of Sacramento, the County of Sacramento and the from the Sacramento Region. I was looking for data that would represent the the barriers the homeless in the Natomas area have to negotiate to get to services. To that end, I downloaded:
As for data on the homeless in Sacramento, I reached out to Manjit Kaur, HMIS Analyst for Sacramento Steps forward, with the hope that I could glean some spatial information from him. Unfortunately, November / December was a bad time for him to meet up so I had to move on and get my own data, especially given that any homeless information I could find, say from the Housing and Urban Development Dept., was strictly demographic. To that end, I began noting when and where I saw the homeless -- either in transit or encamped.
Identify the location of a few homeless services providers, georeference them and
Mapping Homeless Spatial Patterns (Hamlet and Pardue, 2015)
Background
This being my first semester in the GIS program at ARC, I knew this wasn’t going to be an academic research project so much as an experience. That said, I gleaned my idea for this project from:
Informal Networks: Mapping Homeless Spatial Patterns (Hamlet and Pardue, 2015)
Methods
Geocoded the addresses of several homeless service locations, created a feature class, symbolized them and created a ¼ and 1 mile buffer as a sphere of influence.. The homeless have the same travel proclivities as we do. It became readily apparent that the services were well beyond walking distance.
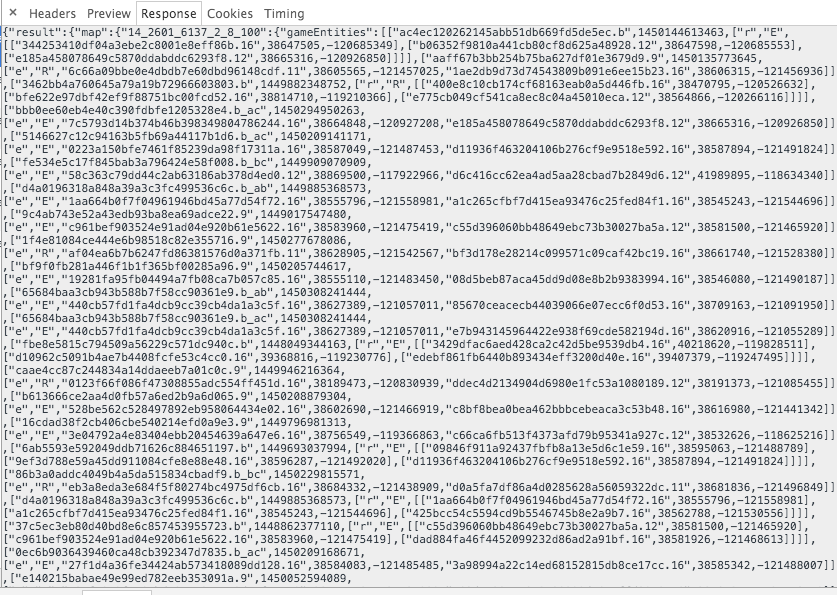
Researched the JSON data format (Javascript Object Notation) -- which is the format used by http://ingress.com/intel.
Took trips via foot and bike and noted presence of the homeless. As I built up data, it felt more and more like surveillance to me and that I wouldn’t want to be “put on a map”.
Results
Lots of great learning accompanied by great frustration. That said, the main services for the homeless are located more than a straight distance mile away from the encampments I saw or where I typically see the homeless. In Hamlet’s study, she used a quarter mile and mile buffers as the sphere of influence for the services and only spoke to walking as the means of transit. Observation has shown me that the Sacramento homeless are very, very mobile. It’s common to see bikes with one or more trailers.
Successfully scraped raw JSON data from the Ingress.com/intel site and transformed it into valid GeoJSON markup.
Raw JSON:
Translated to:
Example GeoJSON:
{ "type": "FeatureCollection",
"features": [
{ "type": "Feature",
"geometry": {"type": "Point", "coordinates": [38.587894,-121.491824]},
"properties": {"prop0": "value0"} ...snip
Attempts to get the GeoJSON data into ArcMap proved difficult at best. Later I learned that ESRI has three different formats in play. Apparently GeoJSON will only work with the ArcMap Javascript API. Ultimately, I wound up activating ArcMap’s Data Interoperability Management tool and succeeded in creating a point feature class.
Analysis
A vast majority of time for this project has been spent on getting my coordinate systems all to agree and play nicely with each other. My inexperience working in ArcMap solo, vs being told what do was definitely challenging. About the same vast amount of time was spent going about the steps of acquiring JSON portal data from Ingress.com/intel.
Conclusion
While a meaningful analysis wasn’t possible for this project, I feel that I have succeeded in producing a data rich environment to build on and leverage as I become more proficient with ArcMap.
Moving forward, the next steps would be to calculate the cost distance and least cost path for the homeless to services. This would be an iterative approach that would start with calculating the least cost path taking slope into consideration, and building upon that by building
References & Research
ArcGIS.com - Last Accessed 12/16/2015
http://help.arcgis.com/en/arcgisdesktop/10.0/pdf/spatial-analyst-tutorial.pdf
ArcMap.com - Last Accessed 12/16/2015
GeoJSON.org - Last Accessed 12/16/2015
Sacramento Steps Forward - Last Accessed 12/16.2015
http://sacramentostepsforward.org/wp-content/uploads/2013/08/Resource-Guide_1.pdf
Ingress.com/intel - Last Accessed 12/16/2015
YouTube - - Last Accessed 12/15/2015