Title
Spatial Distribution and Land Cover Changes for Coastal Tricolored Blackbird Populations
(Agelaius tricolor)
Author
Manuel Lopez
American River College, Geography 350: Data Acquisition in GIS. Fall 2015
mglopez88@gmail.com
Abstract
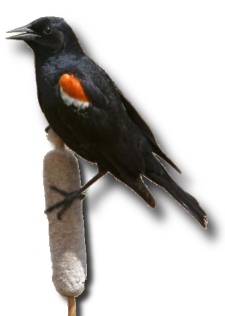 The tricolored blackbird (Agelaius tricolor) is a passerine that is almost completely endemic to California with over 90% of the population
occurring in the state. Over the last century its populations has been decreasing steadily with the lowest numbers ever recorded in 2014. Historically they
nested in large flocks in wetland habitat in the Central Valley and California coast. This study focuses on determining tricolored blackbird land use and
population changes within the coastal populations. This analysis looked at changes between two time periods of 3 years clusters; 1994-1996 and 2009-2011.
The tricolored blackbird (Agelaius tricolor) is a passerine that is almost completely endemic to California with over 90% of the population
occurring in the state. Over the last century its populations has been decreasing steadily with the lowest numbers ever recorded in 2014. Historically they
nested in large flocks in wetland habitat in the Central Valley and California coast. This study focuses on determining tricolored blackbird land use and
population changes within the coastal populations. This analysis looked at changes between two time periods of 3 years clusters; 1994-1996 and 2009-2011.
Introduction
The tricolored blackbird, despite ongoing trends in population reduction, currently has no state or federal protection. Breeding colonies for the species
can be fairly large with counts in the tens of thousands. Most colonies occur in the Central Valley, where conversion of wetlands to agriculture has
greatly reduced nesting habitat. The larger colonies are now mostly observed only within managed and protected reserves. While nesting colonies are still
reported in the Central Valley, little information exists on the colonies along the coast. This may be due partly because these colonies do not comprise a
large part of the tricolored blackbird population. The goal of this project is to use GIS land cover analysis to quantify changes in tricolored blackbird
land cover use and to determine any spatial changes over the last decade along the California coast populations.
Background
The tricolored blackbird has been the subject of much discussion in 2015. In December of 2015, 11 years after its initial petition for state and federal
listing by the Center for Biological Diversity, it received a Candidate status for state protection.
This bird forms some of the largest flocks in North America, with colonies historically numbering in the hundred thousands. It has often been compared to
the passenger pigeon, another North American bird that created flocks so large they would cover the sky. And similar to the now extinct passenger pigeon
the tricolored blackbird has steadily reduced with some populations only numbering less than a hundred individuals. Historically it nested in emergent
marsh habitat, but due to increasing agricultural practices and land modifications its habitat has been greatly destroyed. Its persistence today, however,
has been attributed to its ability to adapt to many agricultural practices, predominantly rice farming since this mimics a more natural habitat for the
birds. While this has prevented the species from going extinct, agricultural practices do not always coincide with the nesting season, and all too often
nests and their contents are mowed.
Most of what we know about the birds comes from data from the central valley. So I set out to see what trends the lesser studied coastal population
exhibit.
Methods
Point shapefiles for tricolored blackbirds were obtained from the UC Davis tricolored blackbird portal. This portal houses the vast majority of tricolored
blackbird observations both historic and current, with dates ranging back to the 1930’s. This data was obtained as part of my position at the California
Natural Diversity Database.
I obtained land cover data in raster format for coastal California and part of the Central Valley near the Sacramento area from the National Oceanic and
Atmospheric Administration’s (NOAA) C-CAP FTP Tool. I selected the two land cover years with the greatest range; 1996 and 2010.
I first clipped my blackbird data to the area covered by the land cover data. In order to include more data since there are variations in colony counts
each year, I decided to include blackbird data for one year prior and one year after the land cover data year. Two new feature classes were created: point
locations for blackbirds from 1995-1997 and locations from 2009-2011. This was done that land cover would not drastically change within one year of the pre
and post target years (1996 & 2010).
The final step would be compare both year groups. The first comparison is a visual comparison of spatial changes in colony locations. San Luis Obispo was
chosen as a dividing point between northern and southern coast populations. Because different amounts of colonies were observed in the 1996 & 2010
target years, a percentage was taken in order to normalize the data.
I also used the Zonal Statistics as Table tool to assign each colony an associated land cover type. Colony locations were buffered to 50 meters in order to
obtain a better land cover value for each colony. The land cover occurring the majority of the time within the 50 meter buffer was assigned to the colony.
Finally, I tabulated which land covers occurred the most for each of the two target years. Again, I calculated percentages in order to normalize the data
and reduce misinterpretations.
Results
The following graphs represent the over-all composition of the two sub-populations for the two year groups. The percent change in composition between years
is also displayed.
The bottom histogram represents the land cover use for both group years.
Analysis
The first graph show the over-all composition of the two year groups. Based on the two histograms, the assigned northern population significantly larger
than the southern population for both year groups. This is within the realm of what is expected since southern California has a greater human presence and
disturbance. The southern California habitat is also more xeric, so again, the southern blackbird population is not expected to be large.
However, looking at the percent change graph, it appears that the southern population doubled in size between the two year groups. The northern population
showed the inverse trend with a nearly 8 percent reduction in population size.
It is unclear as to why the southern population would double in size. One likely explanation is that as the tricolored blackbird has gained more attention
from biologist, policy makers, and the public, there has also been an increase in survey effort. This hypothesis is also reflected in the overall data from
the UC Davis portal. There has been much more survey effort in the last 9 years, with triennials statewide surveys being conducted. In any case, it is
interesting that the southern population showed such a shift.
The final histogram shows the land cover types for each group year. Using the zonal statics tool appeared to work fine and it is visible that the 2009-2011
group has more variety in land use. One peculiarity was the fact that deciduous forest dominated the 1995-1997 group with nearly half of the land cover.
This is very alarming because a deciduous forest is not an expected land cover type. This anomaly is likely the result of one or two things. First, the
land cover for 1995-1997 may not be as refined as more modern land cover sets. In general, the land cover data I used was not highly detailed. A supervised
classification of the area would likely be more suitable. Another explanation for the anomaly is that my buffer distances were too small. Perhaps expanding
my zonal statistics to 100 meters may have resulted in a better interpretation of the land cover analysis. That being said, the 2009-2011 group shows more
of what would be expected with grasslands, pastures, agricultural land, and wetlands being better represented.
Conclusions
My analysis in this report show a mixture of results. In some aspects the resulting histograms and charts show what we would expect. Tricolored blackbirds
are known to have adapted well to agriculture and often use pasture/grasslands for foraging. The southern California population also exhibits predicted
results with it being smaller both years.
There were, however, some instances that appeared odd at first. The southern California population nearly doubled. This goes against every notion we have
about tricolored blackbirds. Their population statewide has been decreasing steadily, yet the southern portion according to this analysis, is increasing.
As mentioned earlier, this change however, is likely due to the methodology used and the quality of the data obtained. Survey efforts have increased in the
last decade and this spike is likely due to better survey coverage.
The second point of interest was the unexpected land cover type for the 1995-1997 group. Deciduous forest comprised half of the land cover. This result is
also likely due to low quality data and insufficient zonal sampling.
Overall the methodology employed here provided measureable results and it would be useful to continue these types of analysis in the future to track not
only the statewide population trends but also to correlate them with land cover change. One definite improvement would be to acquire better data with
greater resolution.
References
C-CAP FTP Tool, National Oceanic and Atmospheric Administration: https://coast.noaa.gov/ccapftp
Center for Biological Diversity; http://www.biologicaldiversity.org/species/birds/
CNDDB. California Department of Fish and Wildlife, Biogeographic Data Branch. 2014. California Natural Diversity Database (CNDDB). Sacramento, CA. Data
downloaded December 2014.
Tricolored Blackbird Portal, UC Davis: http://tricolor.ice.ucdavis.edu/