| Title Using hand held GPS to map underwater features | |
|
Author Justin Quesada American River College Geography 350: Data Acquisition in GIS Fall 2015 | |
|
Abstract As a recreational diver, I have found the need to map features within the areas I dive. This has resulted in seeking out and putting into practice two cost effect methods to map underwater features. These two methods are to be employed in Sugar Pine Reservoir located in Placer County, California north east of Foresthill. The methods used will be to tow a float with a GPS receiver collecting track points, while logging observations with a time stamp on a dive slate and comparing the two to match the data to a track point. The second method will use the float and tow line but the diver will anchor the line to the feature underwater and surface to collect a way point. The tow method will be used to trace the boat ramp to its end and compare the depth with previously collected data from 2014. While both methods have their uses the towing method had less complications. I was able to obtain some meaningful data for what I was doing, but without an elevation reading on the reservoirs water level from May of 2014, I cannot make a proper assessment. The data collected in this outing will be used in the future to track the water level of Sugar Pine Reservoir. | |
|
Introduction The scope of this project is to test methods used for capturing data underwater. The ideal location to practice these methods would have calm waters and almost no boat traffic. After much deliberation, the area of interest for this project is Sugar Pine Reservoir in Placer County, California. I am familiar with this lake and have logs of underwater features and the depths they were found in for the previous year, 2014, and would like to compare some of the data. The methods to be explored are 1)to pull a surface bouy with a handheld gps unit tacking track points and logging information onto a dive slate collecting time, depth, and temperature. 2) finding an underwater feature while towing a bouy, anchoring the tow line on or near the feature and surfacing to take a waypoint. After the data is collected, DNRGPS would be used to download data from the GPS unit to be used in GIS softwar | |
|
Background As a recreational diver, I am interested in the ability to map areas with something that resemble accuracy. In web searches I have found many articles detail hypothetical instances of of dive computers with the ability to communicate with a surface receiver that has GPS capability and the ability to compute differential gps location based on signal reception from the dive computer. An example of this idea was the Navimate dive computer. This was to be an instrument that would be affordable to the diving community, unfortunately the development ceased and information as to why has yet to be found. There are many solutions available that required a do it yourself approach for which I do not have the technical expertise for or carry a price tag that I cannot begin meet. After more searching I happened upon a site called WadesPage.com, in which the author details the use of a hand held GPS device and mapping underwater features. This is perfect for the low budget diver/college student! | |
|
|
|
|
|
| |
|
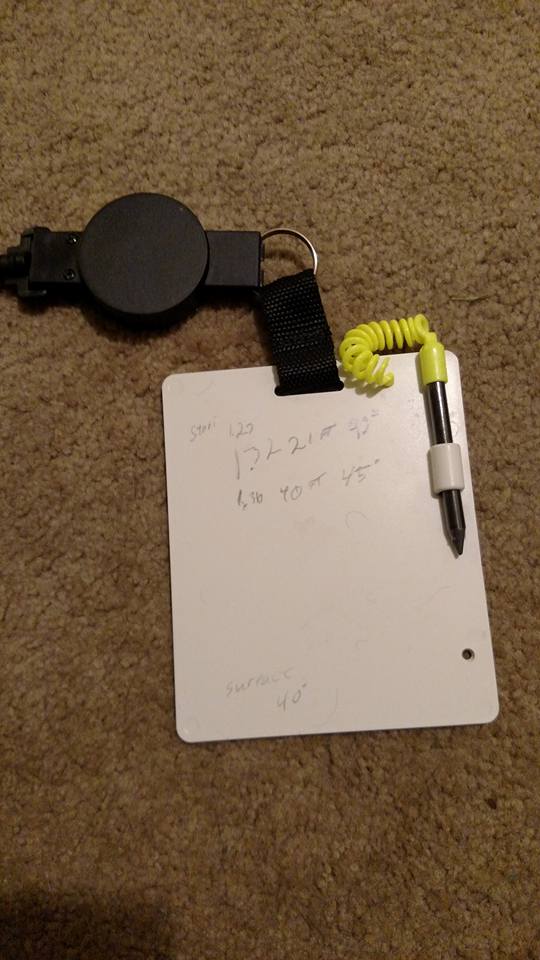
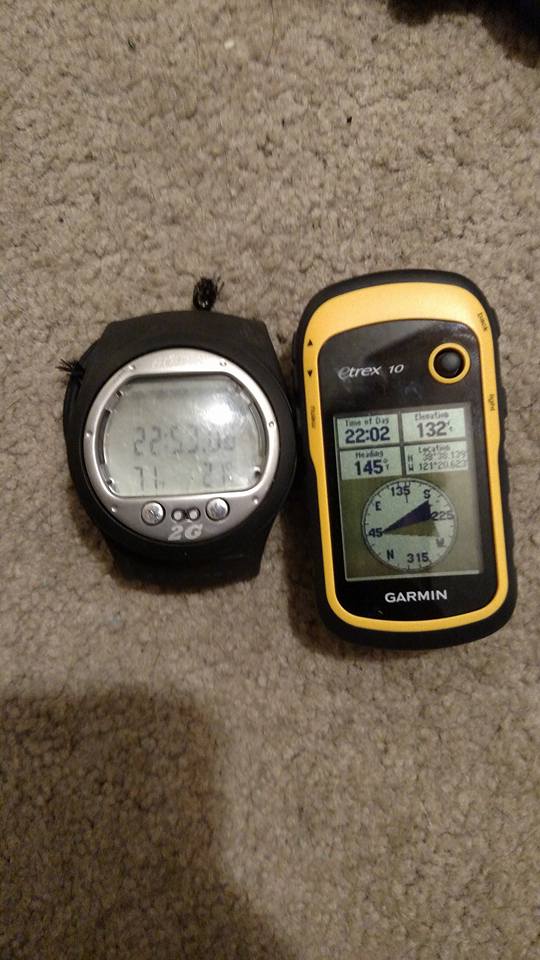
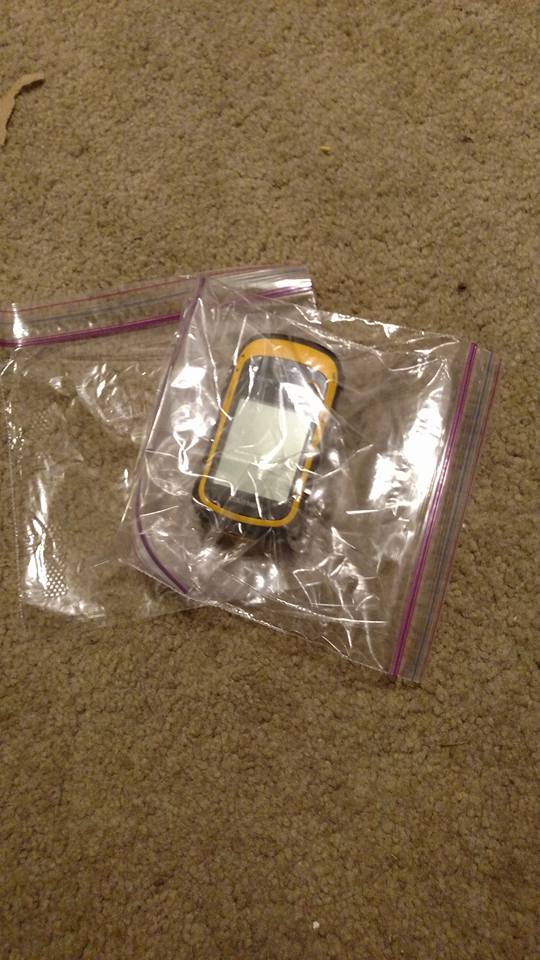
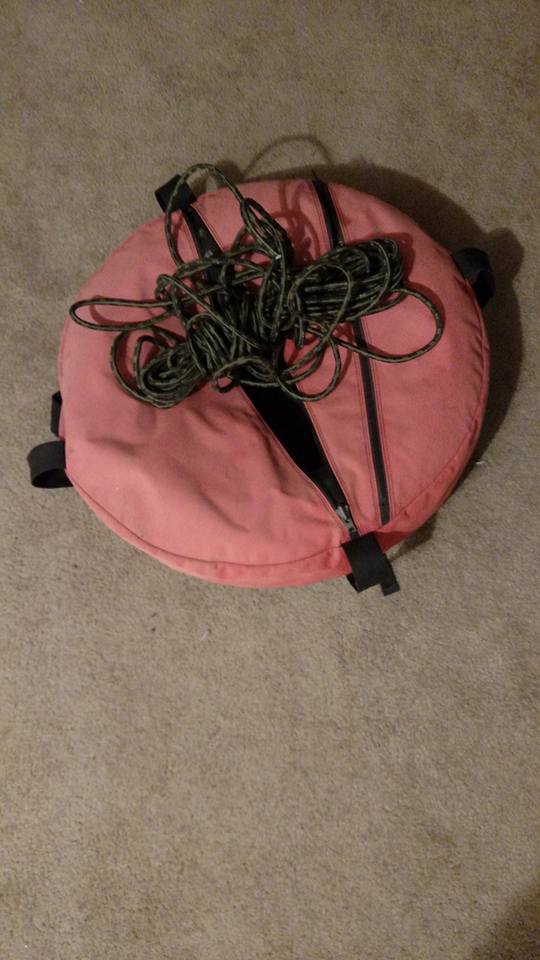
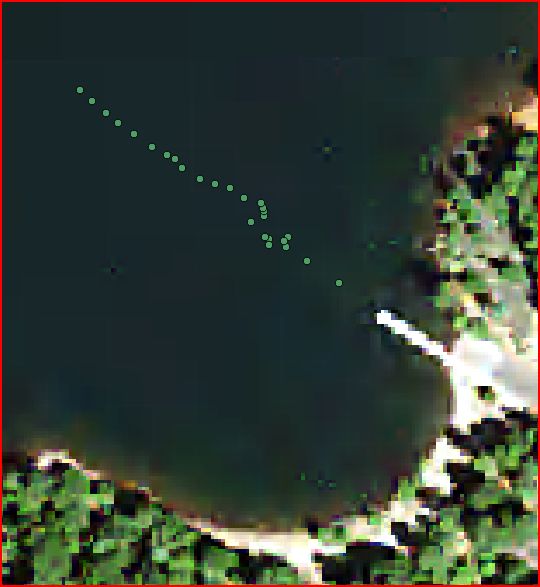
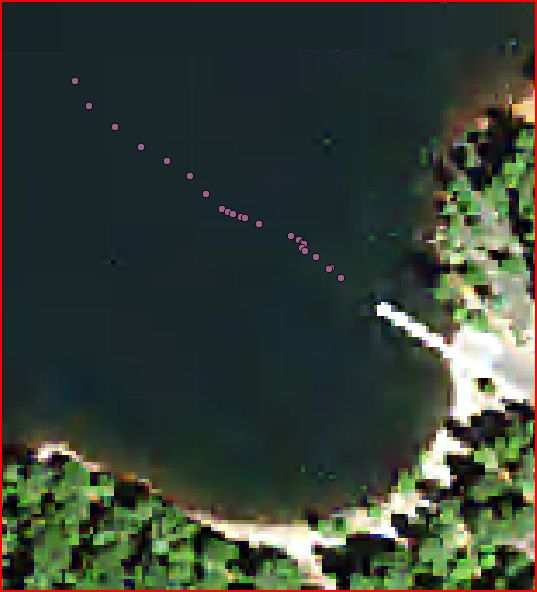
Methods As a recreational diver, I am interested in the ability to map areas with something that resemble accuracy. In web searches I have found many articles detail hypothetical instances of of dive computers with the ability to communicate with a surface receiver that has GPS capability and the ability to compute differential gps location based on signal reception from the dive computer. An example of this idea was the Navimate dive computer. This was to be an instrument that would be affordable to the diving community, unfortunately the development ceased and information as to why has yet to be found. There are many solutions available that required a do it yourself approach for which I do not have the technical expertise for or carry a price tag that I cannot begin meet. After more searching I happened upon a site called WadesPage.com, in which the author details the use of a hand held GPS device and mapping underwater features. This is perfect for the low budget diver/college student! Methods Having decided on my location to practice underwater feature capture, I would need some general reference data. Using USGS Earth Explorer, I was able to obtain imagery of Sugar Pine Reservoir from October 1st 2014. Next I searched the Placer County GIS website to look for more data. Shape files for Lakes and the County boundary were collected. In order to collect the data I would need a few items: A float, line (nylon cord), a hand help GPS unit (Garmin E-terx 10), a way to measure depth, a method of waterproofing the GPS unit, and a medium to take notes on. A nylon rope would be used to tow an abalone float transporting the GPS unit. To keep track of the features underwater, the time on the GPS and the dive computer were synched. This made it possible to log data with a time stamp and later reference the most appropriate track point with the corresponding time stamp. To waterproof the GPS unit a very low tech method was used, Two ziplock bags. This allowed the operator to turn the GPS on with ease during the beginning and at the end of the dive to prevent more track points than were necessary from being created. With the dive computer I would be able to tell time, depth, and temperature. The medium by which to record data underwater is called a diving slate. This slate is a piece of compressed pvc that can be written on with a pencil. The first method that I practiced was pulling the float while taking track points. At the beginning of the dive, I turned on the GPS unit and stored it within the dive float. Then recorded the time of start and the surface temperature of the water. The objective of this exercise was to follow the boat ramp which continues underwater to observe where the trail ends. In the previous year the concrete sidings of the ramp disappeared at 63 feet. The stops to be made to collect data were to be made in 20 foot intervals until the end of the trail was reached. The first stop was made at 20 feet, water temperature of 48 degrees Fahrenheit was recorded. The second stop was made when the end of the trail was reached at a depth of 40 feet. The temperature recorded for this depth was 45 degrees Fahrenheit. I then turned around to return to the shore. The second method that I practiced was to tow the float to a known feature and to anchor the float, surface, and then take a waypoint with the GPS. I had made my way to a tree stump that was located at 23 feet, 2015 depth. The tow line was pulled to reduce the offset angle between te float and feature, then the rope was tied to a root protruding from the tree stump. I surfaced and collected the waypoint of the tree stump. In order to display the data collected, I would need to download the track points and way point from the GPS unit to a format that was readable by GIS software. I used DNRGPS to process the track points. There were several other track points from other uses of the GPS unit, bu I was able to locate the ones I need by their time stamp. The track points were selected and exported as an ESRI Shapefile. The way point was exported as the same. The shape file for the track points was loaded into ArcMap for further processing. New fields were added to the shapefile for Depth and Temperature. The data for depth and temperature was then entered for each track point whose time stamp corresponded with the time stamp notated on the dive slate. An ariel image was then added to ArcMap for use as a reference. The tracks were then selected by out going tracks and incoming tracks, tracks coming back to shore. Two shape files were created by selecting tracks by time stamp and geographic reference and exported as separate files. |
|
|
|
|
| |
|
Analysis The method of towing the float and collecting track points proves to be the least problematic of the two methods. The first issue had was keeping a hold of the rope while logging data. This problem could be solved by using a dive reel that is equipped with a trigger release to hold the line or release line. The second issue was the problem with the offset of my actual position underwater and the float in tow. This problem is described by Wade on his website. He suggests having a way to measure the amount of line being used by the float and comparing that with the depth to account for the measure of offset. There may be a dive reel that has a line counter or I will have to think of a method accomplish this.
The second method of anchoring the line on, at, or near the underwater feature is fairly impractical. For one, if there is no way to tie the line off to the feature then something would have to be carried down to be used as an anchor. I am not a fan of carrying extra weight underwater if it is not necessary, this can be dangerous. In the ocean this method also seems to not hold merit, the float would be bouncing around to some degree and an anchor that is too light would be shifted. | |
|
Conclusions
The method for towing the float was the most efficient method used. This method may prove to be better when diving with a partner who can log the data while I am holding onto the tow line or vice versa. The accuracy of the tracks could be said to be suspect with the offset of line between the float and the diver. A method for measuring the tow line needs to be explored to improve this process. Additional data that could have been used would be a map or plans that showed the boat ramp, which used to be a service road, during the construction of the damn so that it could be digitized and some level of reference could be used against the track points. This is definitely a method of data collection that has uses and I will be exploring other methods or refinements to current methods to make better use of them. I cannot wait to collect shoreline data for next year and at what depth the end of the boat ramp resides at to make a comparison between 2015 and 2016.
| |
|
References Wade Pemberton: http://www.wadespage.com/D800DS07RF00.shtml | |