Mapping Native Heritage Oaks at American River College
- Author
- Daniel P. Walsh
- American River College GEOG 350: Data Acquisition in GIS, Fall 2015
- w1455786@losrios.edu
Abstract
The purpose of this project is to great a map that will illustrate the Native Oak trees on American River Colleges Campus that can be used by the public. With this we as a community should have a better view of the nature that surrounds us and was here before us and will be here after.
Introduction
American River College (ARC) sits on 153 acres of land in Sacramento, California. Once the weekend get-away ranch for a wealthy attorney, today ARC, part of the Los Rios Community College District, serves over 40,000 (CCC, 2015) students and has in its possession Oak trees that are older than the United States of America. The Oak tree is a prominent symbol at ARC and its campus is dotted with many Oaks, some are put on pedestals where they may be admired, others are off to the side and only known by those who seek them out.
Protected Oaks are Oak trees who are exemplary and stand out according to Sacramento County, California, Municipal Code § 19.12.040.This status is granted to trees that are very old and are in good health. Many are quite tall, some can be short or even appear younger than they actually are. Some can grow in groves many are solitary and in some parts of Sacramento they even grow in the middle of streets.
My purpose for this project is to illustrate how to use imagery, geographic data, and ESRI's ARC Map program to create an accurate and useful map of Heritage Oaks on American River College's Campus.
Background
Growing up my father worked for the Sacramento Department of Transformation (SACDOT) and I remember him telling me stories about the amount of time and money the county would spend to help to preserve the health of oak trees that were either growing near road ways or walking trails. From this I gathered that these trees were important and from looking into the matter and the number of them that are found all across Sacramento I came to see them as a map of the past and living relics of the distant past. This was made clear to me when the age of an oak tree at my high School was put into relative terms by my teacher. "This oak tree was a sapling when the now famous political cartoon America-divided snake "Join or Die" was being written to parchment and the first steam engine was fired up in England."
Methods
Data Collection
- GPS
-
To collect the location, a Garmin etrex Venture HC was used on loan from Los Rios. Way points were recorded with WAAS/EGNOS enabled, data formatted to UTM UPS using the WGS 84 datum. Elevation was recorded in US feet.
Garmin etrex Venture HC

- Way point Data
- A total of fifteen way points were recorded and were recorded at the base of every tree. Way point data was extracted from the GPS using DNRGPS from the Minnesota Department of Natural Resources. The copy used was provided by P. Veisze during GEOG 350 class at American River College. The extracted data was exported to a comma-separated values (CSV) file and to a 2D Arc Map Shape File for analysis.
- Photographic Data
- For each way point two photos were taken, a single shot of the tree and a panorama picture of the trees immediate environment. Both images were taken using an iPhone with a 12mp camera. The single image of the tree was not altered in anyway; however, the panorama image was stitched together using the built in iOS panorama feature.
- Specimen Data
-
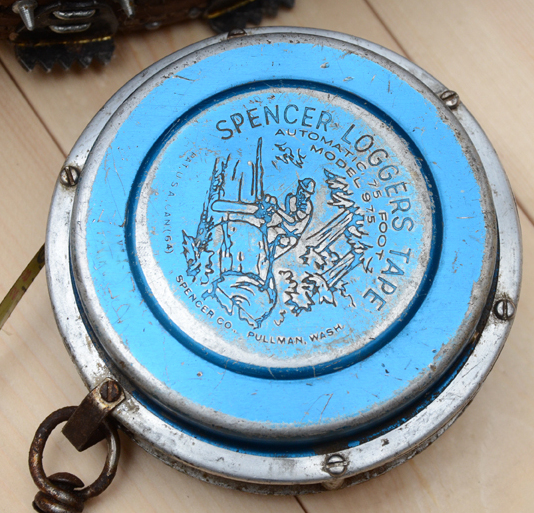
To collect other important data, a chart was created to hold: way point id, approximate time, circumference, diameter (DBH Tape), Notes, and Leaf Type. The way point id and time were generated by the GPS. Circumference and diameter were measured using Spencers Original Logger's Diameter Tape (DBH Tape). Both diameter and circumference were measured at "four and one-half feet above the ground while standing on the high side of the tree" Sacramento County, California, Municipal Code § 19.12.040. Leaf samples were taken to assist in the age estimation of the tree, sample was assigned an alphabetic id.
Spencers Original Logger's Diameter Tape (DBH Tape)
Data Analysis
- Raw GPS Data
- A single row of data extracted using DNRGPS.
type ident Latitude Longitude y_proj x_proj comment display symbol dist proximity color altitude depth temp time wpt_class sub_class attrib link state country city address zip facility crossroad ete dtype model filename ltime magvar geoidheight desc fix sat hdop vdop pdop ageofdgpsdata dgpsid dir WAYPOINT 1 38.64531828 -121.3502872 38.64531828 -121.3502872 11/11/2015 8:22 Residence 0 26.56 0 0 11/11/2015 8:22 garmin eTrex Ventur 11/11/2015 0:22 0 11/11/2015 8:22 0 0 0 - Specimen Data
- Digitized table of Handwritten field chart.
unique_id approx_time circumference diameter_dbh leaf_style observations 1 11/11/15 08:22:57 164 51.2 A No added irrigation; growing apart from other trees; 4 11/11/15 08:33:45 120 36.4 B Added irrigation from surrounding shrub ; 5 11/11/15 08:38:17 128 39.7 C Added irrigation from surrounding shrubs; tree is growing in a grove of other alike trees; 6 11/11/15 08:40:37 125 38.5 C Added irrigation from surrounding shrubs; tree is growing in a grove of other alike trees; 7 11/11/15 08:42:02 101 31.1 C Added irrigation from surrounding shrubs; tree is growing in a grove of other alike trees; 8 11/11/15 08:43:28 75 22.6 C Added irrigation from surrounding shrubs; tree is growing in a grove of other alike trees; 9 11/11/15 08:44:31 99 30.1 C Added irrigation from surrounding shrubs; tree is growing in a grove of other alike trees; 10 11/11/15 08:45:41 139 43.2 C Added irrigation from surrounding shrubs;tree is growing away from grove; 11 11/11/15 09:00:25 81 24.7 B Added irrigation from lawn and shrub beds; 12 11/11/15 09:04:41 67 20.2 D Added irrigation from surrounding ground cover irrigation; 13 11/11/15 09:24:48 73 21.7 D Added irrigation from surrounding shrubs; tree is growing in a grove of other alike trees; 14 11/11/15 09:24:55 52 15 D Added irrigation from surrounding shrubs; tree is growing in a grove of other alike trees; 15 11/11/15 09:25:05 52.5 15.4 D Added irrigation from surrounding shrubs; tree is growing in a grove of other alike trees; - Tree Identification
- To identify the type of oak, I used the leaf sample and the photo. Initially I took all of the leaf samples and looked up the type from examples provided in Ornamental Plants: their Care & Use & Propagation & Identification (Wait, 1986). Then I brought the samples to an Arborist who looked over my classifications and helped reclassify any that were done incorrectly.
- Tree Age Estimate
- Part of what protects a tree under this municipal code is a tree of great age, significance, and being a California Native Tree. The gathering of the circumference and identifying the type of oak will allow me to calculate an estimated age of the tree. First we need to take the circumference and calculate the diameter. To calculate the diameter of the trees, I used the circumference from the DBH tape and put it into the following formula:
The traditional way of calculating diameter is to use the mathematical constant

 however the Sacramento County, California, Municipal Code § 19.12.040 calls for the use of 3.142 instead, this is the same reason I am also ignoring the DBH diameter measurements taken from the tape measure. Once we have the diameter we need to multiply it by the growth rate of the tree. Oak growth rates are broken up into two different categories according to the Forestry Commission of England:
- 4.0: Black Oaks (coastal, live, central, etc.)
- 5.0: White Oaks (valley, blue, pin, etc.)

Results
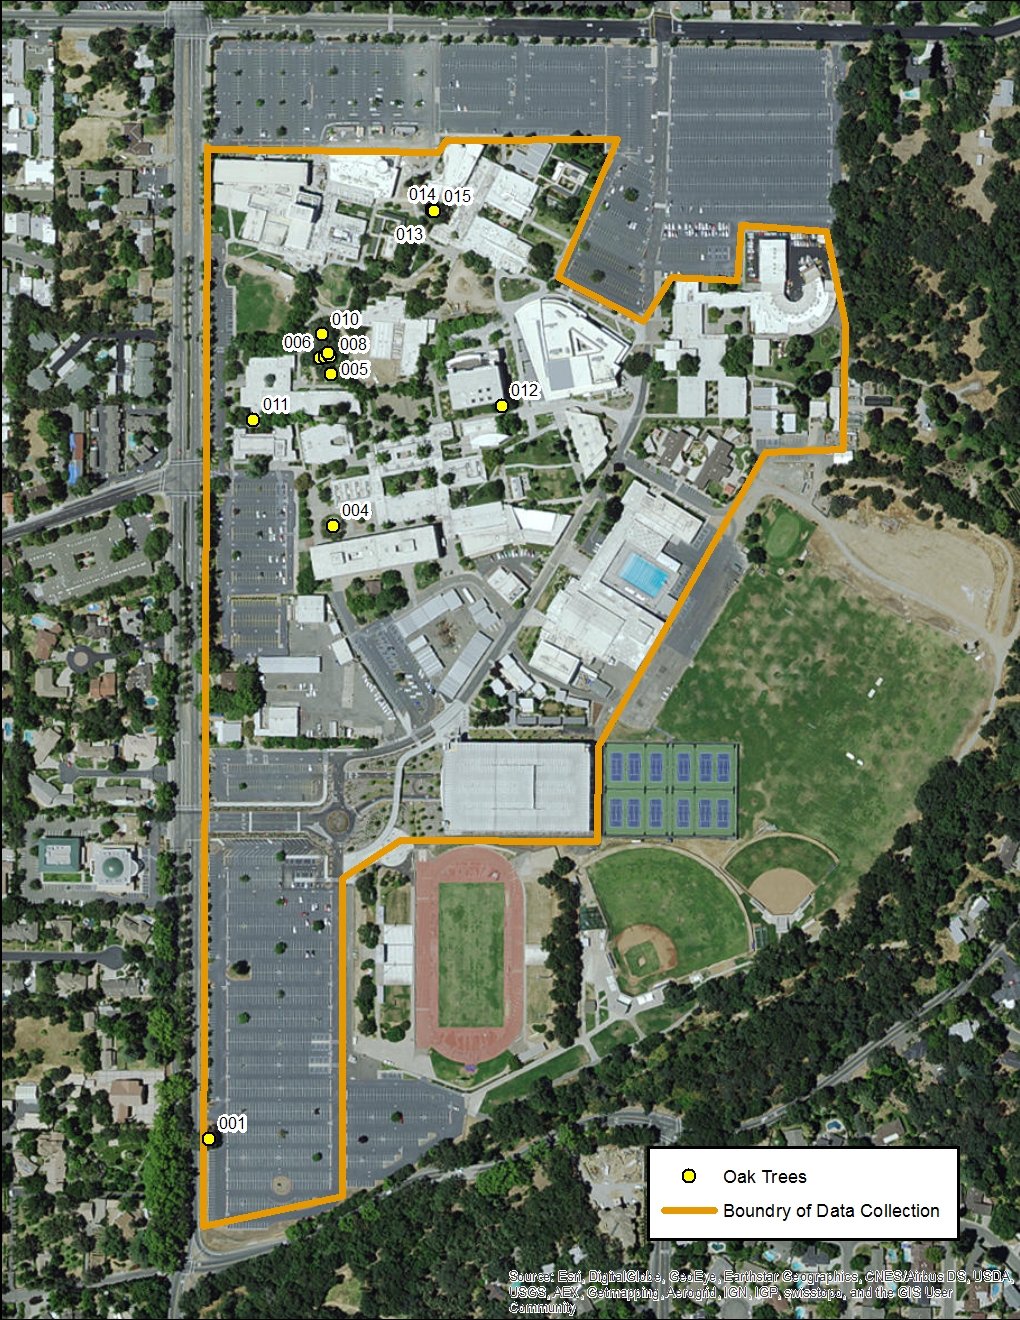
- Completed Map
-
Click the points below to open individual tree details or scroll under the map to see information.
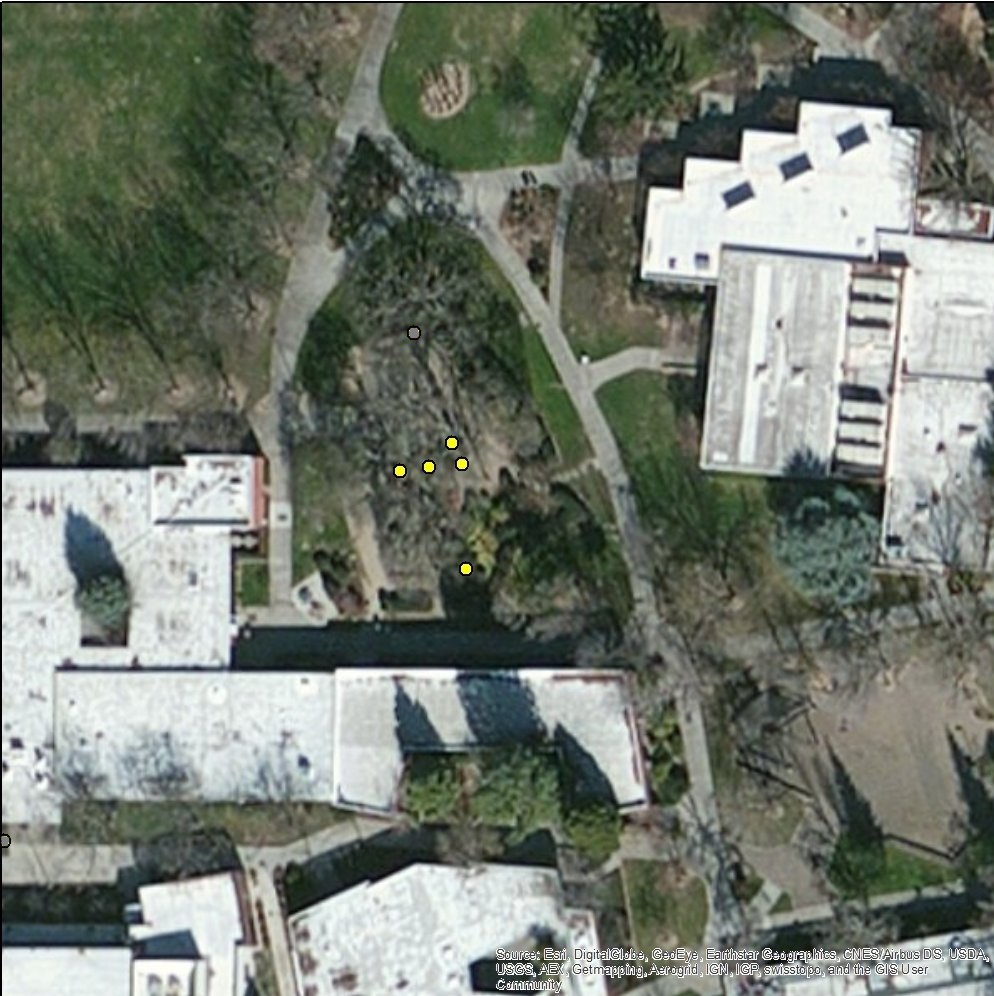
Oak Trees #5-9
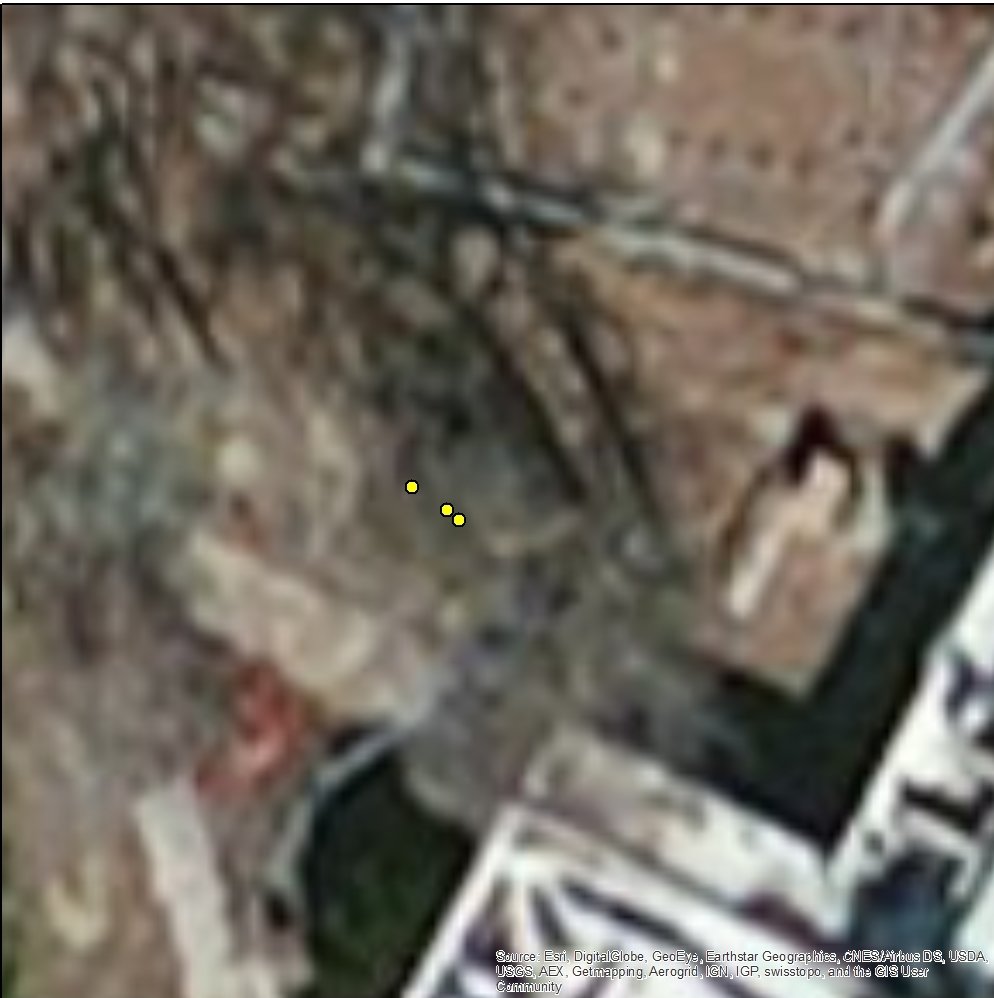
Oak Trees #13-15
- Completed Table
-
unique_id approx_time Latitude Longitude diameter circum_dbh circum_calc leaf_style approx_age observations picture pan_picture 1 11/11/15 08:22:57 AM 38.64531828 -121.3502872 164 51.2 52.20 A 261 No added irrigation; growing apart from other trees; 4 11/11/15 08:33:45 AM 38.64989958 -121.3491095 120 36.4 38.19 B 191 Added irrigation from surrounding shrubs; 5 11/11/15 08:38:17 AM 38.6510334 -121.3491282 128 39.7 40.74 C 204 Added irrigation from surrounding shrubs; tree is growing in a grove of other alike trees; 6 11/11/15 08:40:37 AM 38.65115619 -121.3492332 125 38.5 39.78 C 199 Added irrigation from surrounding shrubs; tree is growing in a grove of other alike trees; 7 11/11/15 08:42:02 AM 38.65116139 -121.3491867 101 31.1 32.15 C 161 Added irrigation from surrounding shrubs; tree is growing in a grove of other alike trees; 8 11/11/15 08:43:28 AM 38.65116516 -121.3491347 75 22.6 23.87 C 119 Added irrigation from surrounding shrubs; tree is growing in a grove of other alike trees; 9 11/11/15 08:44:31 AM 38.65119224 -121.3491493 99 30.1 31.51 C 158 Added irrigation from surrounding shrubs; tree is growing in a grove of other alike trees; 10 11/11/15 08:45:41 AM 38.65132978 -121.3492117 139 43.2 44.24 C 221 Added irrigation from surrounding shrubs;tree is growing away from grove; 11 11/11/15 09:00:25 AM 38.65069284 -121.3498688 81 24.7 25.78 B 129 Added irrigation from lawn and shrub beds; 12 11/11/15 09:04:41 AM 38.65079686 -121.3474936 67 20.2 21.32 D 107 Added irrigation from surrounding ground cover irrigation; 13 11/11/15 09:24:48 AM 38.65225129 -121.3481447 73 21.7 23.23 B 116 Added irrigation from surrounding shrubs; tree is growing in a grove of other alike trees; 14 11/11/15 09:24:55 AM 38.65225816 -121.3481585 52 15 16.55 B 83 Added irrigation from surrounding shrubs; tree is growing in a grove of other alike trees; 15 11/11/15 09:25:05 AM 38.65224836 -121.3481402 52.5 15.4 16.71 B 84 Added irrigation from surrounding shrubs; tree is growing in a grove of other alike trees;
Analysis
Two Oak Planks, Same Size Very Diffrent Growth Rings
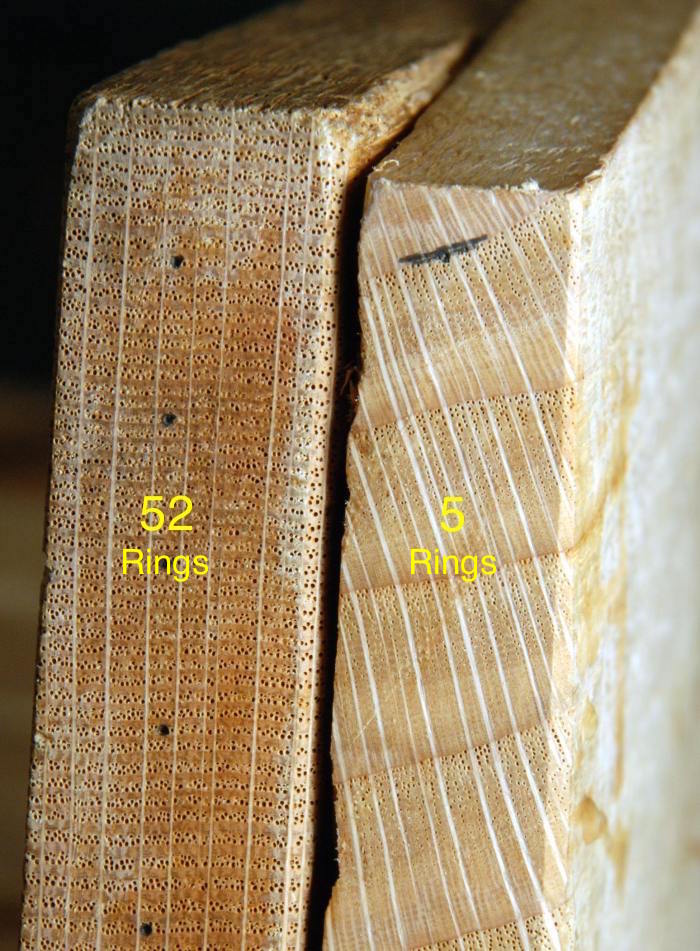
From the data collected I found a total of fifteen oak trees on the college campus. While I am confident in my recording of the tree location and the classification of each tree the calculation of age is flawed. While the formula used gives a good estimation of tree age is does not take into account the location of trees and its environment. This is clear when examining the data from tree #12. Located at the base of the Library building, built in 1970, the formula gives an approximate age of 107 years old. This is inaccurate because the building the tree is up against is only 45 years old and because of the trees location it could have not survived the building of the library in the 1970's. Tree #12 is located on fertile ground and surrounded by ground cover that receives water on a weekly basis. Because of this the tree is able to grow exponentially and has the size of an oak tree that would have taken over 100 years to grow if it did not have the access to the same amount of water and nutrients. The same error can be seen with tree #1. Located in the south west corner of the stadium parking lot the formula gives an approximate age of 261 years old. However with this tree the error is not over estimating the age but is most likely underestimating it. This oak has most likely never has access to added water and is subject to the natural droughts that are common in California. For this reason it's growth has been stunted. Even today the tree has access to little water because of the asphalt parking lot and road that surround it. For this reason is is highly likely that tree #1 is well over three hundred years old but only has the diameter of a two hundred year old tree. An example of this can be seen in the image above, two identical species of tree from very different environments which produce very different speeds of growth in the same size pieces of wood. It is for this reason that the age data that was calculated should be taken with a grain of salt. While it is not accurate it does give an idea of the size of the each tree.
Even with the errors illustrated above this project still did illustrate the number of "older" native oak trees that can be found at ARC and has provided a usable map to find them as well as details about them.
Conclusion
A part of any good project in any field is to look back on what you have produced and look at how you could have improved and been more efficient with time and resources. When looking back on this project I see allot of ways that I could improve if I were to try again. Having another person with me whole taking measurements and locations would have helped. Because of the large trunk sizes of these trees it was difficult to ensure that all measurements were taken at the required four and one half feet level. I would have liked to have made my collection area larger to create a more comprehensive map.
As far as analysis is concerned I am happy with what was done. However having a domain expert with me while in field would have allowed for a better estimated age of the trees based on there environment. From this project I feel as though I have accomplished most of my goals with the biggest problem being age estimation and at the and of the day I am very happy to see my hard work visualized into a usable map that can be useful to others.
References
- Pavlik, Bruce and Muick, Pamela and Johnson, Sharon and Popper, Marjorie, 1991. Oaks of California, The Diversity of California Oaks:3-50
- Wait, D. Dwight, 1986. Ornimantal Plants: their Care & Use & Propagation & Identification, Quercus:452-455
Web References
- California Community College (CCC), 2015. Student Success Score Crad. http://scorecard.cccco.edu/scorecardrates.aspx?CollegeID=231 Last accessed 2015.11.15
- Forestry Commission of England, 1998,. Estimating the Age of Large and Veteran Trees in Britain. http://www.forestry.gov.uk/pdf/fcin12.pdf/$FILE/fcin12.pdf; Last accessed 2015.11.15
- Griffin, Jim and University of California Hastings Reserve, 1987,. Hastings Reservation Oaks. http://www.hastingsreserve.org/oakstory/OaksAtHastingsNames.htm; Last accessed 2015.11.10