| A Do It Yourself Image
Acquisition System | |
|
Author
Steve Barton Geography 350: Data Acquisition in GIS (Paul Veisze) American River College, Fall 2016 | |
|
Abstract The “Bigshot” educational digital camera kit was assembled and tested for image quality metrics including resolution limits and color capture ability. Comparisons were made with a consumer-grade camera in similar test scenarios. Additional evaluations were made with regard to the four GIS “mantras” shared in the Geography 350 class: 1) Unique Identifiers, Coordinates (x,y,z,t), DataMetadata; 2) Power, Signal, Data; 3) Instrument Cross-check, Instrument interpretation, System Control; 4) People, Data, Tools. | |
|
Introduction “Bigshot” is an educational digital camera kit that was designed by a Columbia University professor (Shree Nayar) to teach people about the science and engineering aspects in a modern digital camera. The slogan for Bigshot is “Build, Learn, Use”, and this project examined these three topics with the camera. There were on-line learning modules that were reviewed with the various construction steps. The construction steps and learning modules included sections on the power generator (a hand crank dynamo), the imaging lens, the imaging sensor (Charge Coupled Device/CCD), the poly-optic wheel (with regular, panoramic, and 3-D prism lenses), the viewfinder for the eye (as a separate optical system), the LED (Light Emitting Diode) flash, the LCD (Liquid Crystal Display) display, the electronics, and image processing. Upon successful construction, objective and subjective and objective tests were made with the camera to determine its quality and utility. Objective tests included the field of view, focal length, resolution (Modulation Transfer Function/MTF), and color reproduction ability. Subjective tests compared the camera to a consumer-grade digital camera (18 Mega-Pixel/MP Nikon Coolpix P520). Additional evaluations were made based on the GIS “mantras” shared in class. This project was intended to build upon the camera exercises done early in the semester in the Geog 350 class. | |
|
Background (Camera Assembly and Tutorials)
The Bigshot camera was purchased and assembled. Part of the learning experience are several on-line tutorials that explain the science and technology of the different parts of the camera as it is constructed. There are tutorial sections on: power generator (battery, hand-crank dynamo), imaging lens (aperture, focal length), image sensor (Charge-Coupled Device), poly-optic wheel (40 degree Field of View/FoV, 80 degree (panoramic) FoV, and a 3-D bi-prism), view finder and the human eye (a separate optical system in the camera), LED flash, LCD display, camera electronics, and image processing.  The un-assembled parts of the Bigshot camera (www.bigshot.com). | |
|
Background (Literature Review)
Most of the literature review focused on image quality metrics. Wikipedia has a good introductory article on “Image Quality”. Three general factors contribute to image quality with a digital camera: how the image formation process deviates from the pinhole camera model, the quality of the image measurement process, and the (JPEG or similar) coding artifacts that are introduced in the image produced by the camera. These sources are not always able to be separated, and there are several specific image quality factors that can be assessed including: sharpness (resolution), noise, dynamic range, tone reproduction, contrast, color accuracy, distortion, vignetting, exposure accuracy, lateral chromatic aberration, lens flare, color moire’ (color banding), and artifacts (JPEG, lossy compression artifacts). Norman Koren has an educational website on image quality that was also reviewed. He identifies four major factors that contribute to digital camera image quality: resolution, noise/grain, dynamic range, and color quality. Most of these image quality factors need sophisticated laboratory bench equipment to be tested, but resolution and color quality tests seemed feasible. Resolution is measured by contrast. Contrast is a better metric than intensity as the human visual system is more sensitive to contrast than absolute intensity. Contrast is defined as the difference between the maximum and minimum intensity of an image divided by the sum. Nominally maximum intensity will have Digital Number (DN) value of 255 (white) for an 8-bit value and a minimum intensity value of 0 (black). This corresponds to a contrast value of 1. When the maximum and minimum intensity values are equal, the contrast value is 0. The pinhole cameral model was also researched for another starting point to evaluate the Bigshot camera. This is well-documented in the Bigshot documentation, the book “Programming Computer Vision with Python” by Solem, and also a Wikipedia article. The model describes (with basic geometry) how a 3D scene is mapped to a 2D image (on the focal plane of a camera). Another basic camera model is the “thin lens diagram”. From this diagram, the focal length can be measured based on the law of similar triangles. 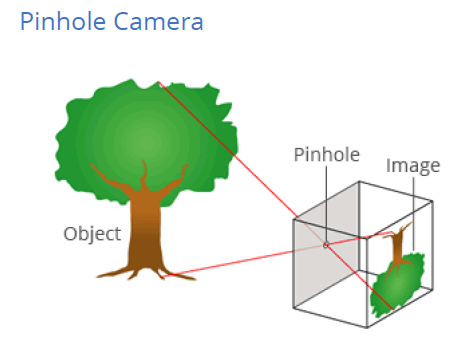 The pinhole camera model (www.bigshot.com). 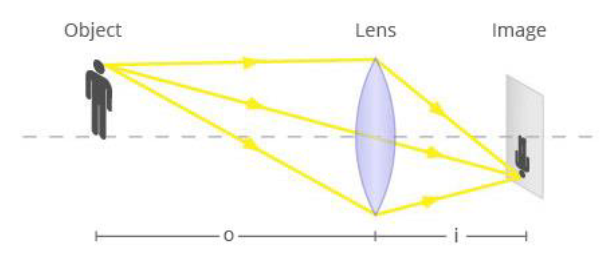 Thin lens diagram (www.bigshot.com). Resolution is measured by the the Modulation Transfer Function (MTF). A good introductory article on how this is measured is in the article by the Optikos Corporation, “How to Measure MTF and other Properties of Lenses”. MTF determines the amount of image contrast as a function of spatial frequency, normalized to 100% (or 1). The larger the spatial frequency value where MTF becomes zero (cut-off frequency), the better resolution of the camera. MTF measures the ability of an optical system to transfer various levels of detail from an object to an image.  Sample Modulation Transfer Function (MTF) curves (www.quickmtf.com). The 1951 Air Force Resolution Test Chart is the most established MTF test. Patterns of bars of are arranged in a pattern of increasing density (and increasing spatial frequency). The pattern where the distinction between bars cannot be determined (no contrast) corresponds to a “line pair/millimeter (lp/mm)” resolution limit. The chart is designed to be printed so that the largest block element is 10 mm wide, so that the first (coarsest) resolution value is 0.25 lp/mm. This “raw” value is to be multiplied by the magnification factor of the camera that is defined by the ratio of the scene width to the image sensor width. 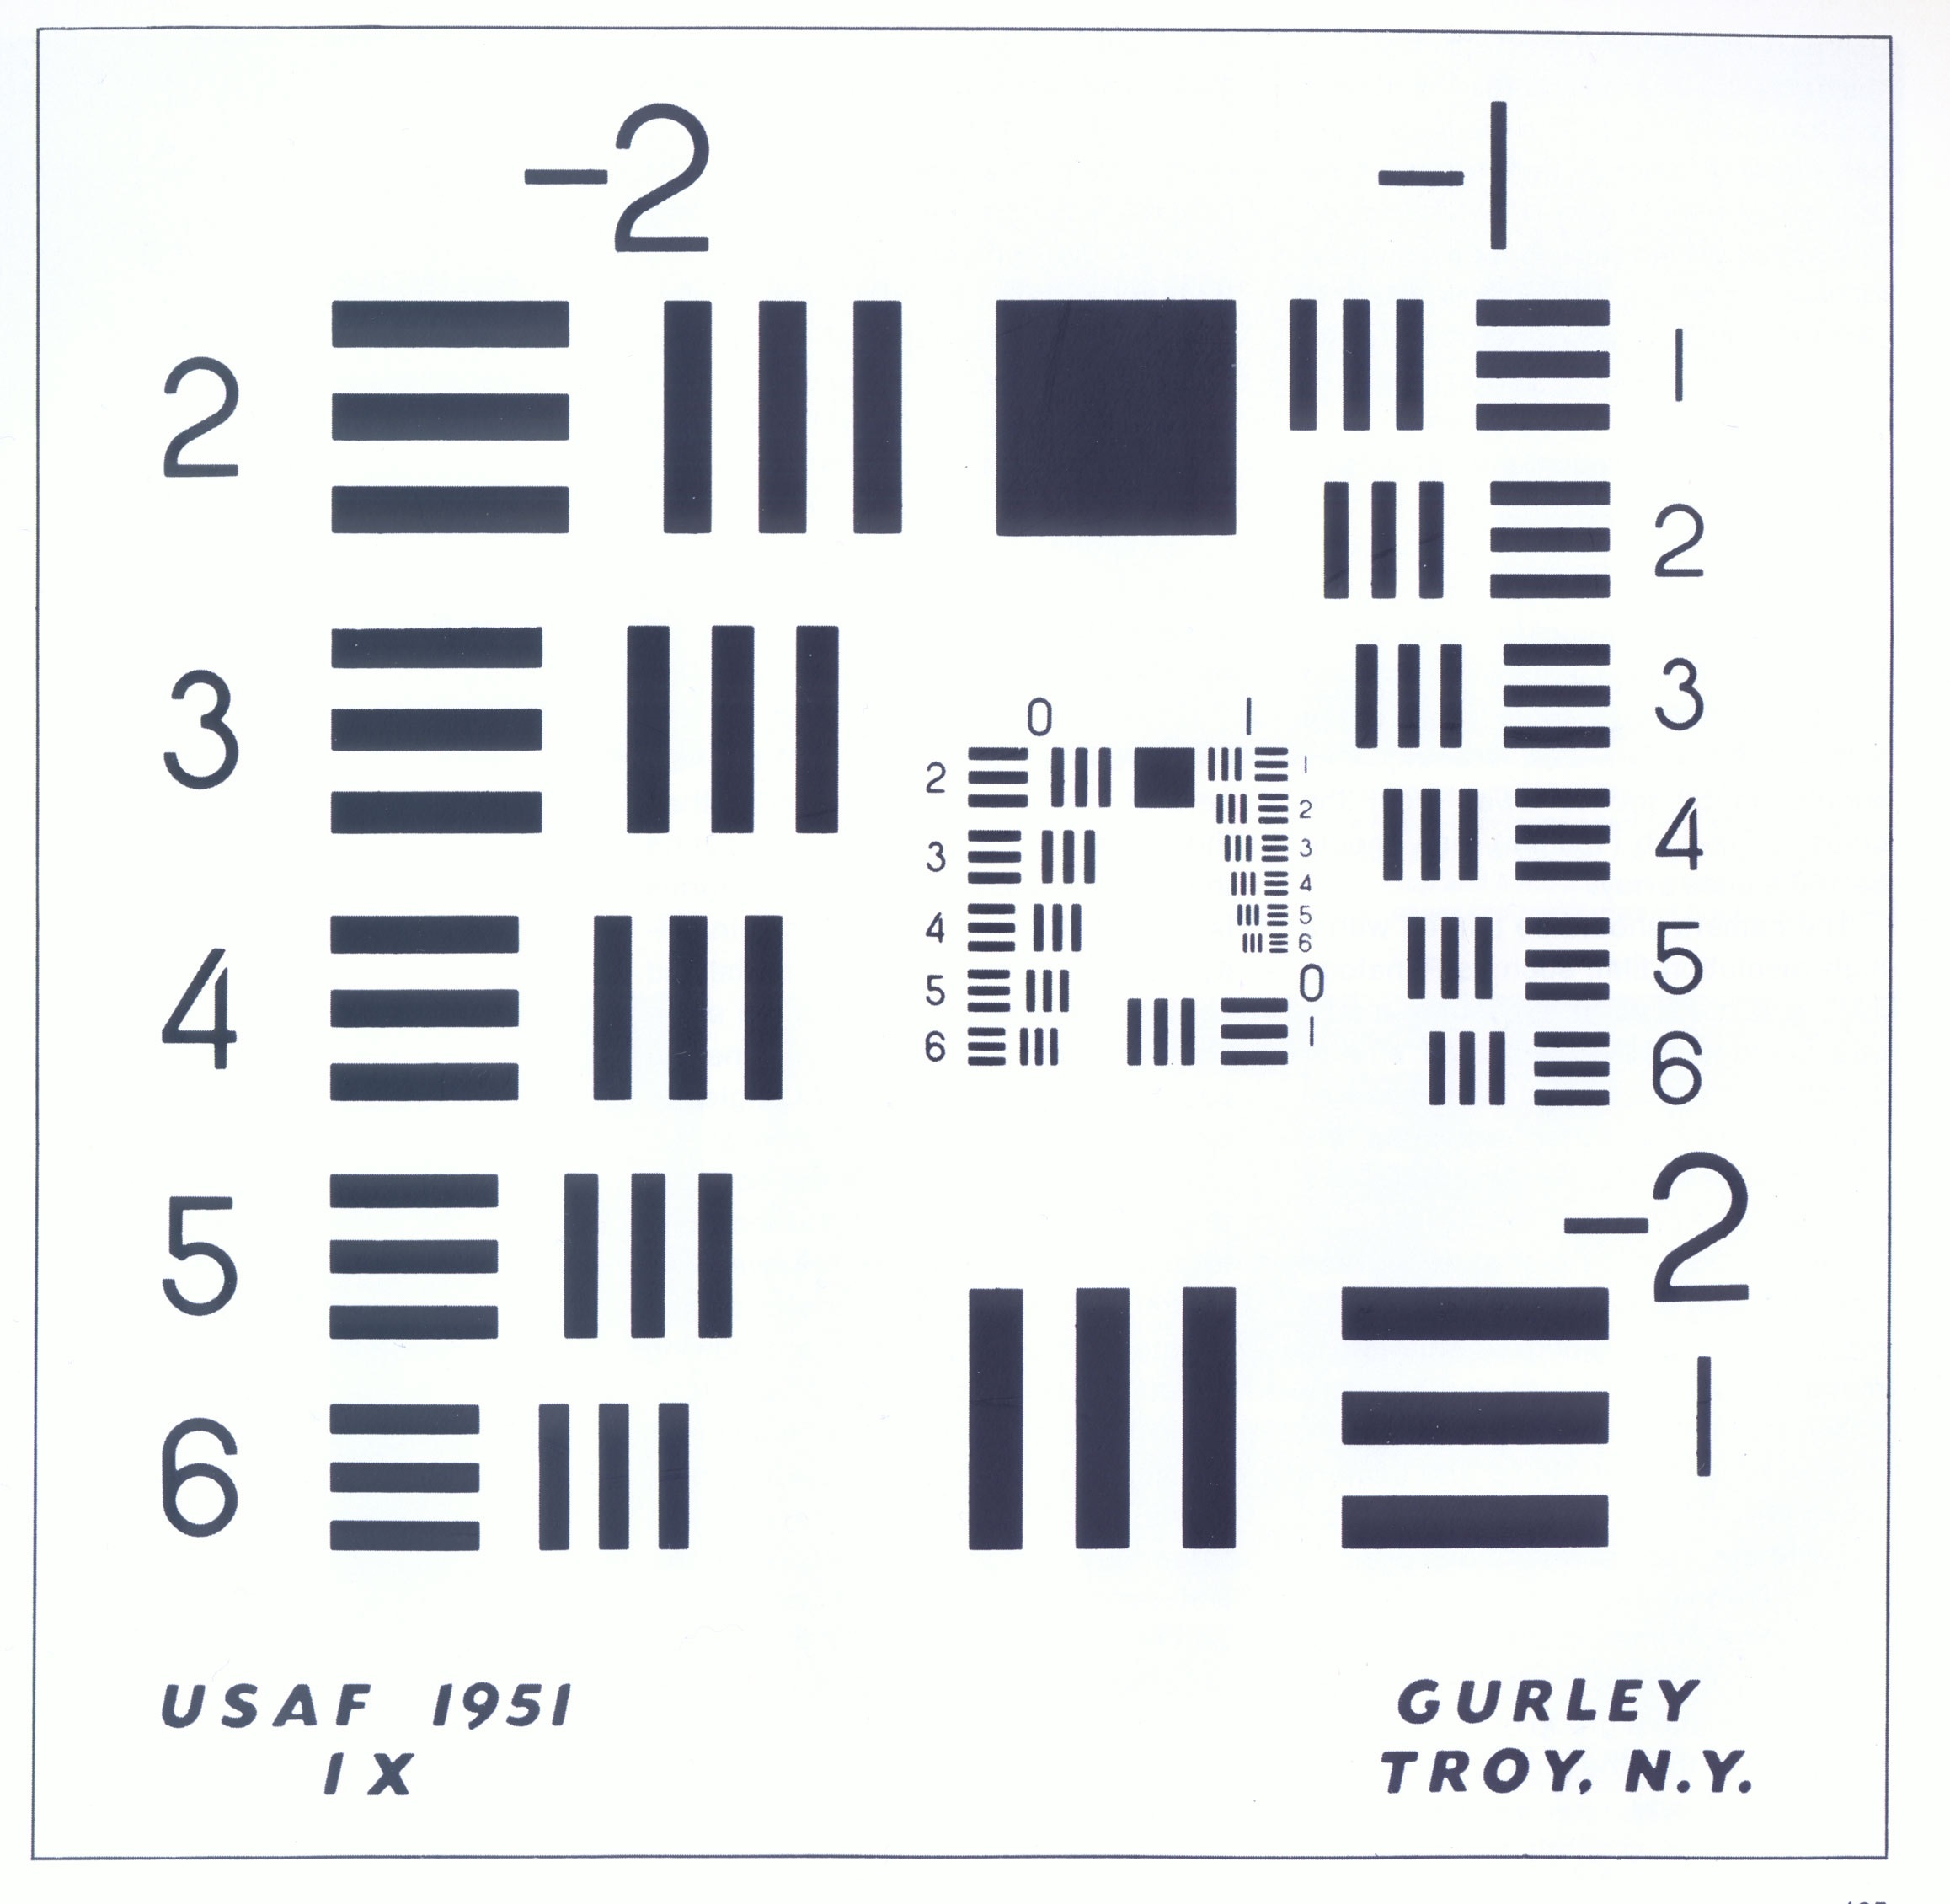 The 1951 USAF resolution test chart (https://en.wikipedia.org/wiki/1951_USAF_resolution_test_chart). Norman Koren has an educational website with several discussions on image quality metrics including alternate methods to test resolution by the Modulation Transfer Function (MTF). This website makes reference to a commercial software tool (also developed by Norman Koren) to analyze MTF called “Imatest” (Image Test). Koren introduces the idea of a test chart with progressively narrow line pairs based on sine waves versus discrete black and white bars (a pulse train signal) in the 1951 USAF chart that can produce a better MTF curve of contrast versus spatial frequency. In addition to the cut-off frequency (where MTF = 0), a couple of key metrics are MTF50 (MTF = 50%) and MTF10 (MTF = 10%) The Imatest website has a selection of test charts and software for purchase to implement the test scenarios that are discussed on the educational website. 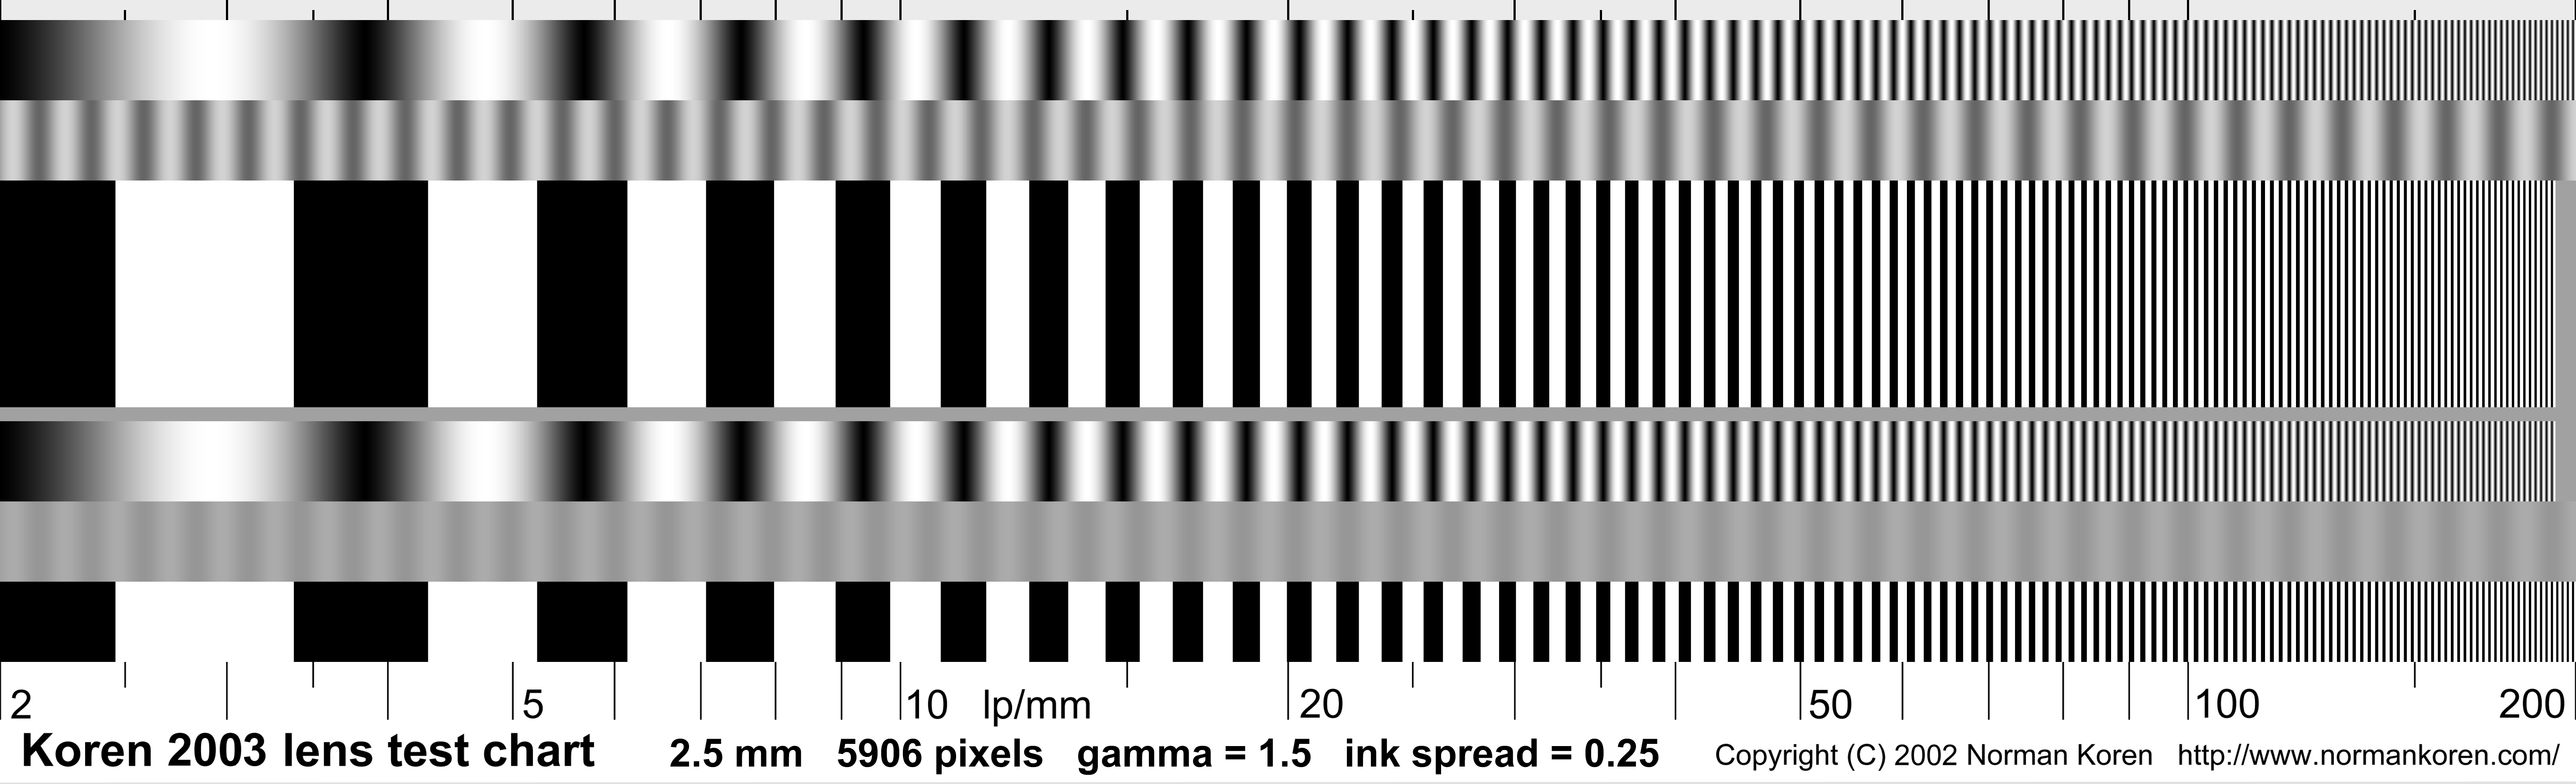 Norman Koren progressive resolution test chart (www.normankoren.com). Another (more sophisticated) test of MTF is based on an ISO 12233 test chart that includes a variety of patterns with slanted edges. A software tool called “Quick MTF” was found (with a free trial version) to analyze camera images of this test chart. MTF curves can be plotted (against spatial frequency) and the response can be compared between two cameras.  The ISO 12233 test chart (http://www.graphics.cornell.edu/~westin/misc/res-chart.html). | |
|
Methods
The Field of View (FoV) was measured by placing a tape measure horizontally and vertically in a test image and determined with basic geometry. The focal length was also determined by basic geometry (the law of similar triangles) according to the thin lens diagram in the previous section. The (square) pixel dimension was listed as 1.75 um in the Bigshot documentation. The size of the object in the image (in pixels) was converted to linear dimensions. The size of the object was measured along with the distance from the camera. These three values allowed the focal length to be calculated. The 1951 USAF test chart was imaged with the Bigshot camera as well as the Nikon camera. The resolution limit was determined visually on the chart as a “raw” value. This value was multiplied by the magnification factor of the camera to get a calculated value for a resolution limit. The Norman Koren test chart was imaged with the Bigshot camera and the Nikon camera. The open-source, freeware ImageJ (aka NIH Image software) was used on the test images with a Plot Profile feature that allows a line to be drawn across the bar pattern to determine the contrast of each line pair in the pattern. The contrast degrades with narrower bars (and increasing values of lp/mm). The cut-off frequency was identified on the plot. The ISO 12233 chart was imaged with the Bigshot camera and the Nikon camera. The QuickMTF software was used to analyze one of the patterns in the test chart with a slanted edge. This produced an MTF curve, as well as MTF50 and MTF10 values. The color quality was compared between the Big Shot camera and a consumer camera (Nikon Coolpix P520) with a color test chart that was downloaded from the Beale corner website. This test pattern has 24 colors (including six gray tones) with the Red, Green, Blue (RGB) values known. This test was done in ArcMap by zooming into each panel and getting the panel Area Of Interest (AOI) statistics from the current extent. The mean values of R, G, and B were obtained and entered into a spreadsheet. This produced 72 data values (a Red, Green, and Blue value for each panel for 24 panels) for color comparisons between the Bigshot camera and the Nikon camera.  Color test pattern (www.bealecorner.com). Subjective tests were made with ten test images with the Bigshot camera and the Nikon camera. The Nikon was set to 2272 x 1704 pixels (4 MB) as the setting closest to the Big Shot pixel dimensions (2408 x 1536 pixels). These test images are provided in the slide deck. | |
|
Results
Results are considered in the context of the four GIS “Mantras” shared in class: 1) Unique Identifiers, Coordinates (x,y,z,t), DataMetadata; 2) Power, Signal, Data; 3) Instrument Cross-check, Instrument interpretation, System Control; 4) People, Data, Tools. Mantra 1: Unique Identifiers, Coordinates, DataMetadata Unique identifiers: The JPEG images from the Bigshot camera are saved with a unique identifier that includes a date and timestamp:IMG_0001_20161023_221932.JPG. Coordinates: No position information is recorded by the Bigshot camera, and this needs to be recorded separately with a hand-held GPS receiver and a log. DataMetadata: The Bigshot JPEG metadata is nominal, and it can be accessed with the image properties in Windows explorer. 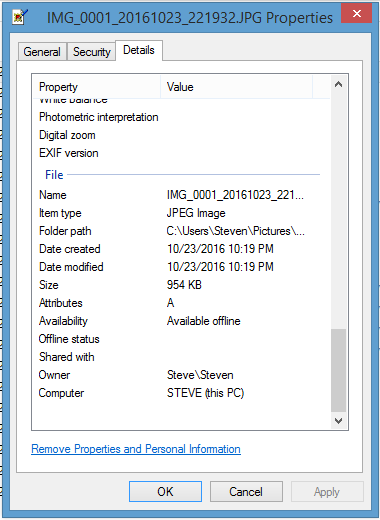 Bigshot JPEG metadata in Windows explorer. Mantra 2: Power, Signal, Data Power: Power is supplied by a combination of the battery and the hand-crank dynamo. Signal: The sensor array is a Charge-Coupled Device (CCD) with array elements in 1,536 rows by 2,048 columns (listed as 3 MP; 3:4 ratio). The array uses a Bayer pattern as discussed in class. Images are automatically saved on the camera in JPEG format with no other format choices (RAW, TIF, etc.). The Bigshot documentation lists a pixel element size of 1.75 um; this corresponds to a CCD array sensor size of 3.58 mm x 2.69 mm. This value is considered notional as it was given in the tutorial material and not in direct reference to the camera. In comparison, a typical compact digital camera has a sensor with a diagonal dimension of 5 – 11 mm. The Nikon Coolpix P530 camera has a CMOS sensor with a size listed as 1/2.3”. This corresponds to 6.17 mm x 4.56 mm. 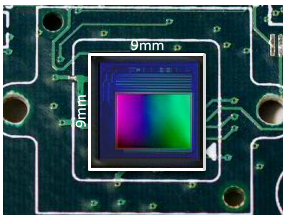 The Bigshot image sensor. Data: The camera can hold approximately 120 images in memory according to the documentation. The image size of the JPEG files on the camera prior to download ranged from 341 kB to 906 kB. No memory size limit for the camera (in MB) could be determined. Mantra 3: Instrument Cross-check, Instrument interpretation, System Control Instrument Cross-check: The Bigshot camera was compared with a consumer grade Nikon Coolpix P520 camera. The Nikon is rated as an 18 MP camera with an image sensor of 4896 x 3672 pixels. This setting can be reduced to a setting of 2272 x 1704 pixels (~4 MP) that is close to the Bigshot pixel dimensions. Instrument interpretation: This is a basic “point-and-shoot” camera with nominal instrument interpretation. System Control: The Bigshot system controls are adequately described in the documentation. There are two front and back views of the camera and controls.  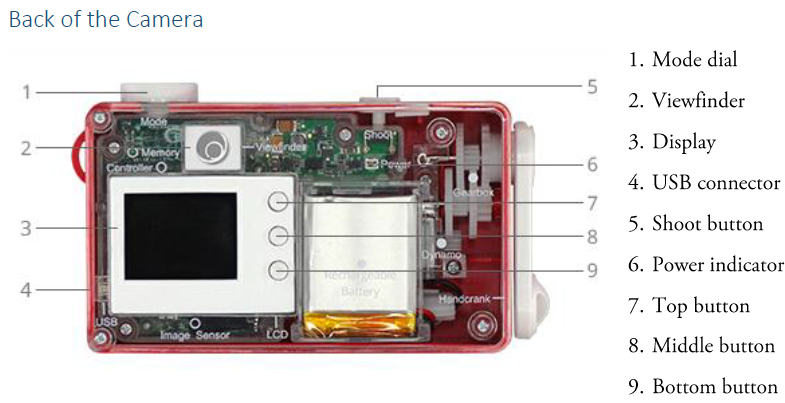 Bigshot camera controls front and rear (www.bigshot.com). Mantra 4: People, Data, Tools The Bigshot software was downloaded from the website and installed on a PC. As photos are downloaded from the camera (via a USB connection), they are processed by the software. The software detects the image format (Regular, Panoramic, and Stereo/3D) and applies an automatic enhancement to them. The panoramic images are corrected for “barrel” distortion and other wide-angle effects. The 3D images are processed into anaglyphs to be viewed with 3D glasses. The processed images (JPEG format) have slightly different memory sizes than when on the camera. This is designed to be a basic “point and shoot” camera, and the camera interfaces between people, data, and tools are nominal. | |
|
Analysis
The Field of View (FoV) was measured with a tape measure and compared with the listed value of 40 degrees (horizontal). The horizontal FOV was measured to be 41.0 degrees, and the vertical FOV was measured to be 30.8 degrees. The focal length was determined to be ~5 mm according the set up described in the Methods section and based on the thin lens diagram. Unfortunately no aperture size was provided in the documentation, so the F-stop (f/#) could not be determined. The vendor was contacted without a reply on this and other questions. Three different MTF tests were attempted for the 1951 USAF Resolution test chart, the Norman Koren test chart, and the ISO 12233 test chart. 1951 USAF Resolution Chart tests: Four images were collected for comparison. 1) The Bigshot had a “raw” resolution (before magnification) value of 0.89 lp/mm from a direct reading of the chart (where the line pairs could not be distinguished). The calculated resolution (after magnification) was 71 lp/mm. 2) The Nikon Coolpix P520 at the same position (and 4 MP setting) had a “raw” resolution (before magnification) of 1.78 lp/mm from a direct reading of the chart. (No calculated resolution was determined as the scene width was wider than the measured target background to determine the magnification.) 3) The Nikon Coolpix P520 was moved to a closer position to the chart (at a 4 MP setting) where the scene width was at the measured target background in image 1), and it had a “raw” resolution of 1.59 lm/mm, and a calculated resolution (after magnification) of 189 lp/mm. 4) The Nikon Coolpix P520 at the same position to the chart in 3) was set to 18 MP (from 4 MP), and it had a “raw” resolution of 2.24 lp/mm, and a calculated resolution of 267 lp/mm. The resolution values seemed high to typical values found in the literature review (~30 lp/mm), so there may have been an error on the camera position in relation to the chart or the use of the magnification factor applied to the raw values from the chart. Koren Chart tests: The Norman Koren test chart and the ImageJ Plot Profile tool are shown in the figure below. 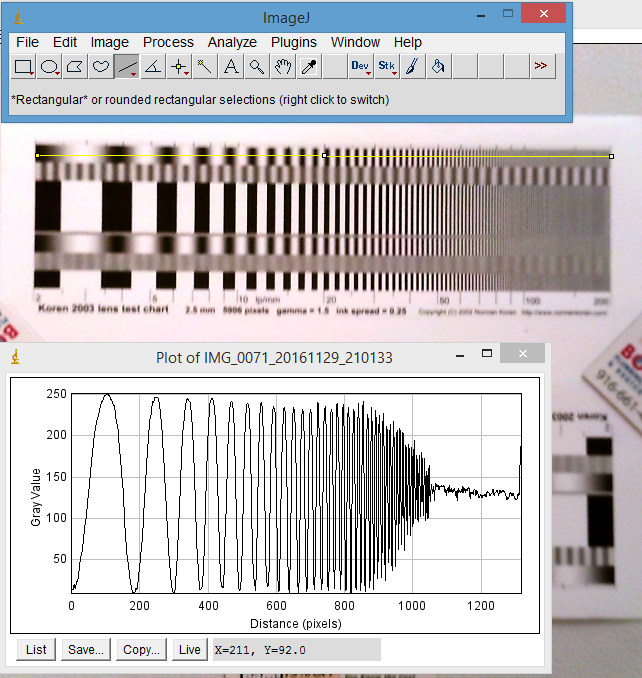 ImageJ software with Plot Profile tool on Norman Koren chart and MTF profile. The MTF plot for the Bigshot camera reached 0 at approximately 80% of the chart width. This corresponds to a resolution of 80 lp/mm on the Koren chart. The MTF plot for the Nikon Coolpix P520 camera (at 4 MP) reached 0 at approximately 89% of the chart width. This corresponds to a resolution of 120 lp/mm on the Koren chart. The MTF plot for the Nikon Coolpix P520 camera (at 18 MP) reached 0 at approximately 92% of the chart width. This corresponds to a resolution of 140 lp/mm on the Koren chart. These resolution values also seemed high to typical values found in the literature review (~30 lp/mm), so there may have been an error on the camera position in relation to the chart or the printed size of the chart or a magnification factor for the camera. QuickMTF tests on the ISO 12233 chart Only one slanted edge of the ISO 12233 test chart was tested for the Bigshot camera, the Nikon at 4 MP, and the Nikon at 18 MP. The MTF curves are shown in the figures below.  QuickMTF software plot of MTF curve (Bigshot camera). 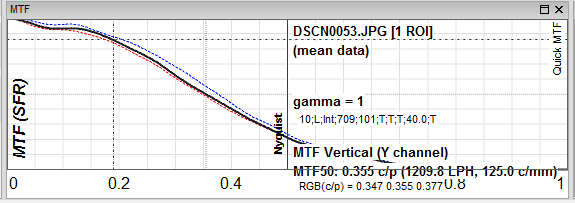 QuickMTF software plot of MTF curve (Nikon, 4 MP). 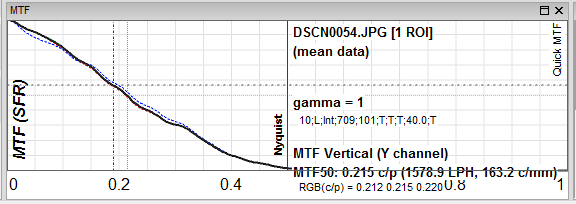 QuickMTF software plot of MTF curve (Nikon, 18 MP). The QuickMTF software gives MTF values in cycles/pixel (c/p). Bigshot: MTF50 = 0.165 c/p; MTF10 = 0.275 c/p Nikon (4 MP): MTF50 = 0.355 c/p; MTF10 0.605 c/p Nikon (18 MP): MTF50 = 0.215 c/p; MTF10 = 0.402 c/p This lower value for the Nikon 18 MP versus 4 MP was unexpected. It may be due to “aliasing” or under-sampling a basic slanted edge in the test pattern. The RGB color values in the test chart as imaged by the Bigshot camera were compared with the Nikon as described in the Methods section. The Root Mean Squared Error was 30 for an 8-bit value (0-255) for 72 measurements. | |
|
Conclusion
The “Build, Learn, Use” slogan for the Bigshot camera was successfully put to the test. The camera was constructed; the online tutorials added to the learning experience to explain the construction steps; the camera was used in the field and in the lab. Lab tests the measured the Field of View, the focal length, the resolution ability (by three different tests), and the color capture ability. Additional evaluations were made on the four GIS “mantras” shared in class. The consumer grade Nikon camera generally performed better than the Bigshot camera in side-by-side comparisons (as expected). As a stand-alone “point and shoot” camera it performed adequately and made for a fun educational experience. | |
|
References
Beale Corner website, www.bealecorner.com Big Shot camera home page, www.bigshot.com Imatest Software website (Norman Koren commercial software), www.imatest.com Norman Koren website (general information in image quality measurements), www.normankoren.com Optikos Corporation, 1999. How to Measure Modulation Transfer Function and other Properties of Lenses. http://www.optikos.com/wp-content/uploads/2013/11/How-to-Measure-MTF.pdf; 2016.10.26 Quick MTF (commercial software) homepage, www.quickmtf.com Solem, Jan Erik, 2012. Programming Computer Vision with Python. O’Reilly Media Inc., Sebastopol, CA. Wikipedia article on the 1951 USAF Resolution Test Chart, https://en.wikipedia.org/wiki/1951_USAF_resolution_test_chart Wikipedia article on Contrast, https://en.wikipedia.org/wiki/Contrast _(vision) Wikipedia article on Image Quality, https://en.wikipedia.org/wiki/Image_quality Wikipedia article on the Pinhole Camera Model, https://en.wikipedia.org/wiki/Pinhole_camera_model |