Rancho Cordova Land Cover | ||||||||||||||||
|
Andrea Ferrer w1279935@apps.losrios.edu American River College, Geography 350: Data Acquisition in GIS; Fall 2016 | ||||||||||||||||
|
Abstract Rancho Cordova became an independent city in 2003. Housing developments started expanding out to the area south of US 50. I wanted to create land cover maps to show this urbanization. Using the unsupervised classification method, I created two land cover maps, one for 2003 and the other for 2016. My results showed that the increase in urban areas was only 0.1% but the decrease in bare land was 12.6%. A more in depth land cover needs to be done to fix these errors. | ||||||||||||||||
|
Introduction The purpose of this project is to determine the land cover of the City of Rancho Cordova. I chose this city because I’ve lived in the area since they first started building the new neighborhoods. The city became independent in 2003, which was around the time this expansion started. This project will show the change from the years 2003 and 2016. I will also calculate statistics to show the percentage change. | ||||||||||||||||
|
Background In 1983, the people of Rancho Cordova started an incorporation committee. They raised funds to show that Rancho Corova had enough revenue to become an independent city. Over the next twenty years, there were many obstacles preventing cityhood. Finally in November 2002, cityhood passed on the ballot. Rancho Cordova became an independent city in July 2003. (Rancho Cordova) | ||||||||||||||||
|
Methods NAIP imagery for Sacramento County was obtained from the Geospatial Data Gateway. The imagery was from 2003 and 2016. For the following images, 2003 is on the left and 2016 is on the right. 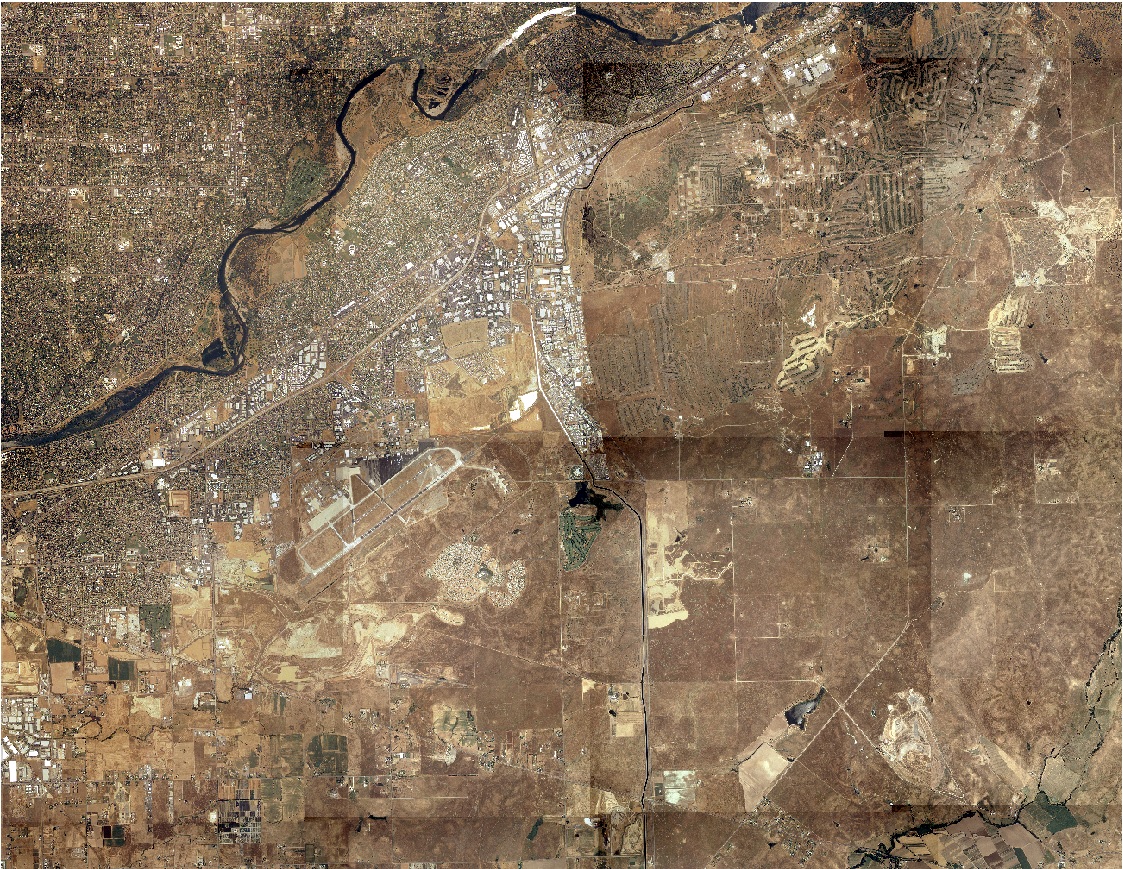 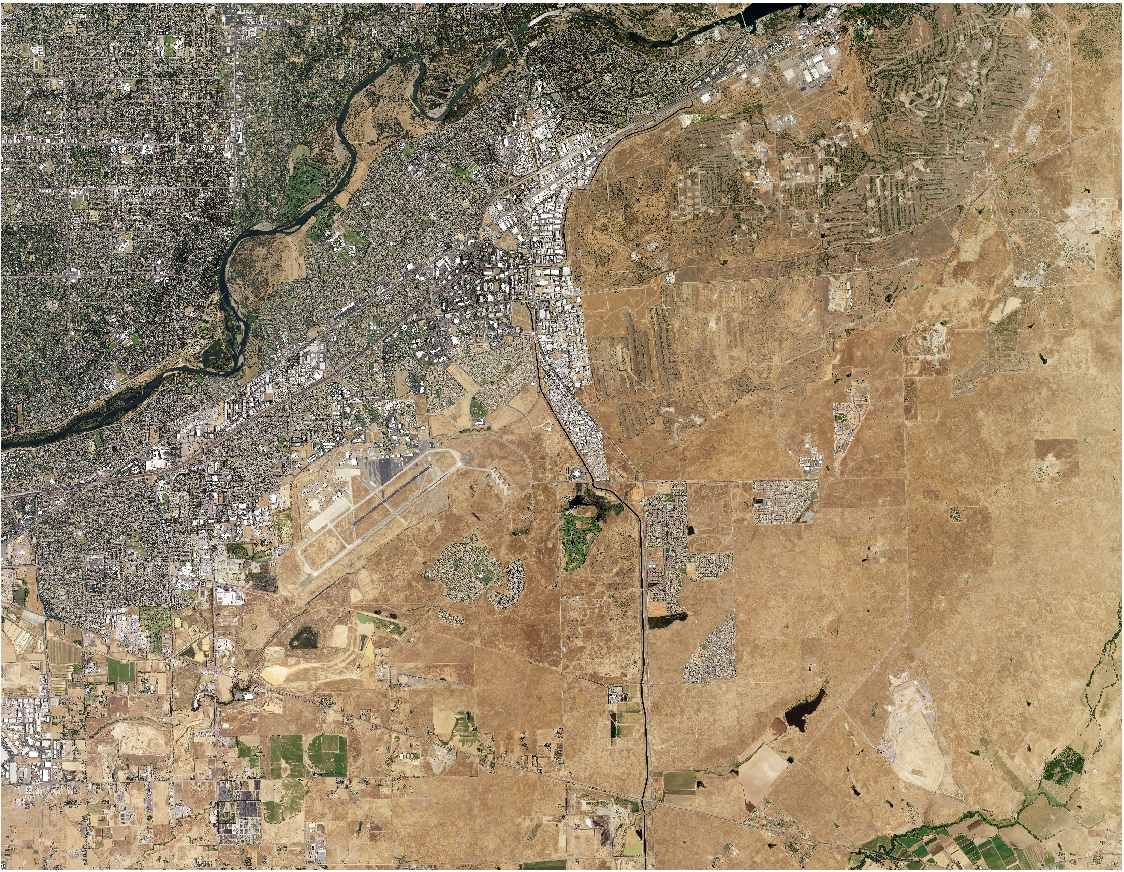
A city boundary map was obtained from the Rancho Cordova website. 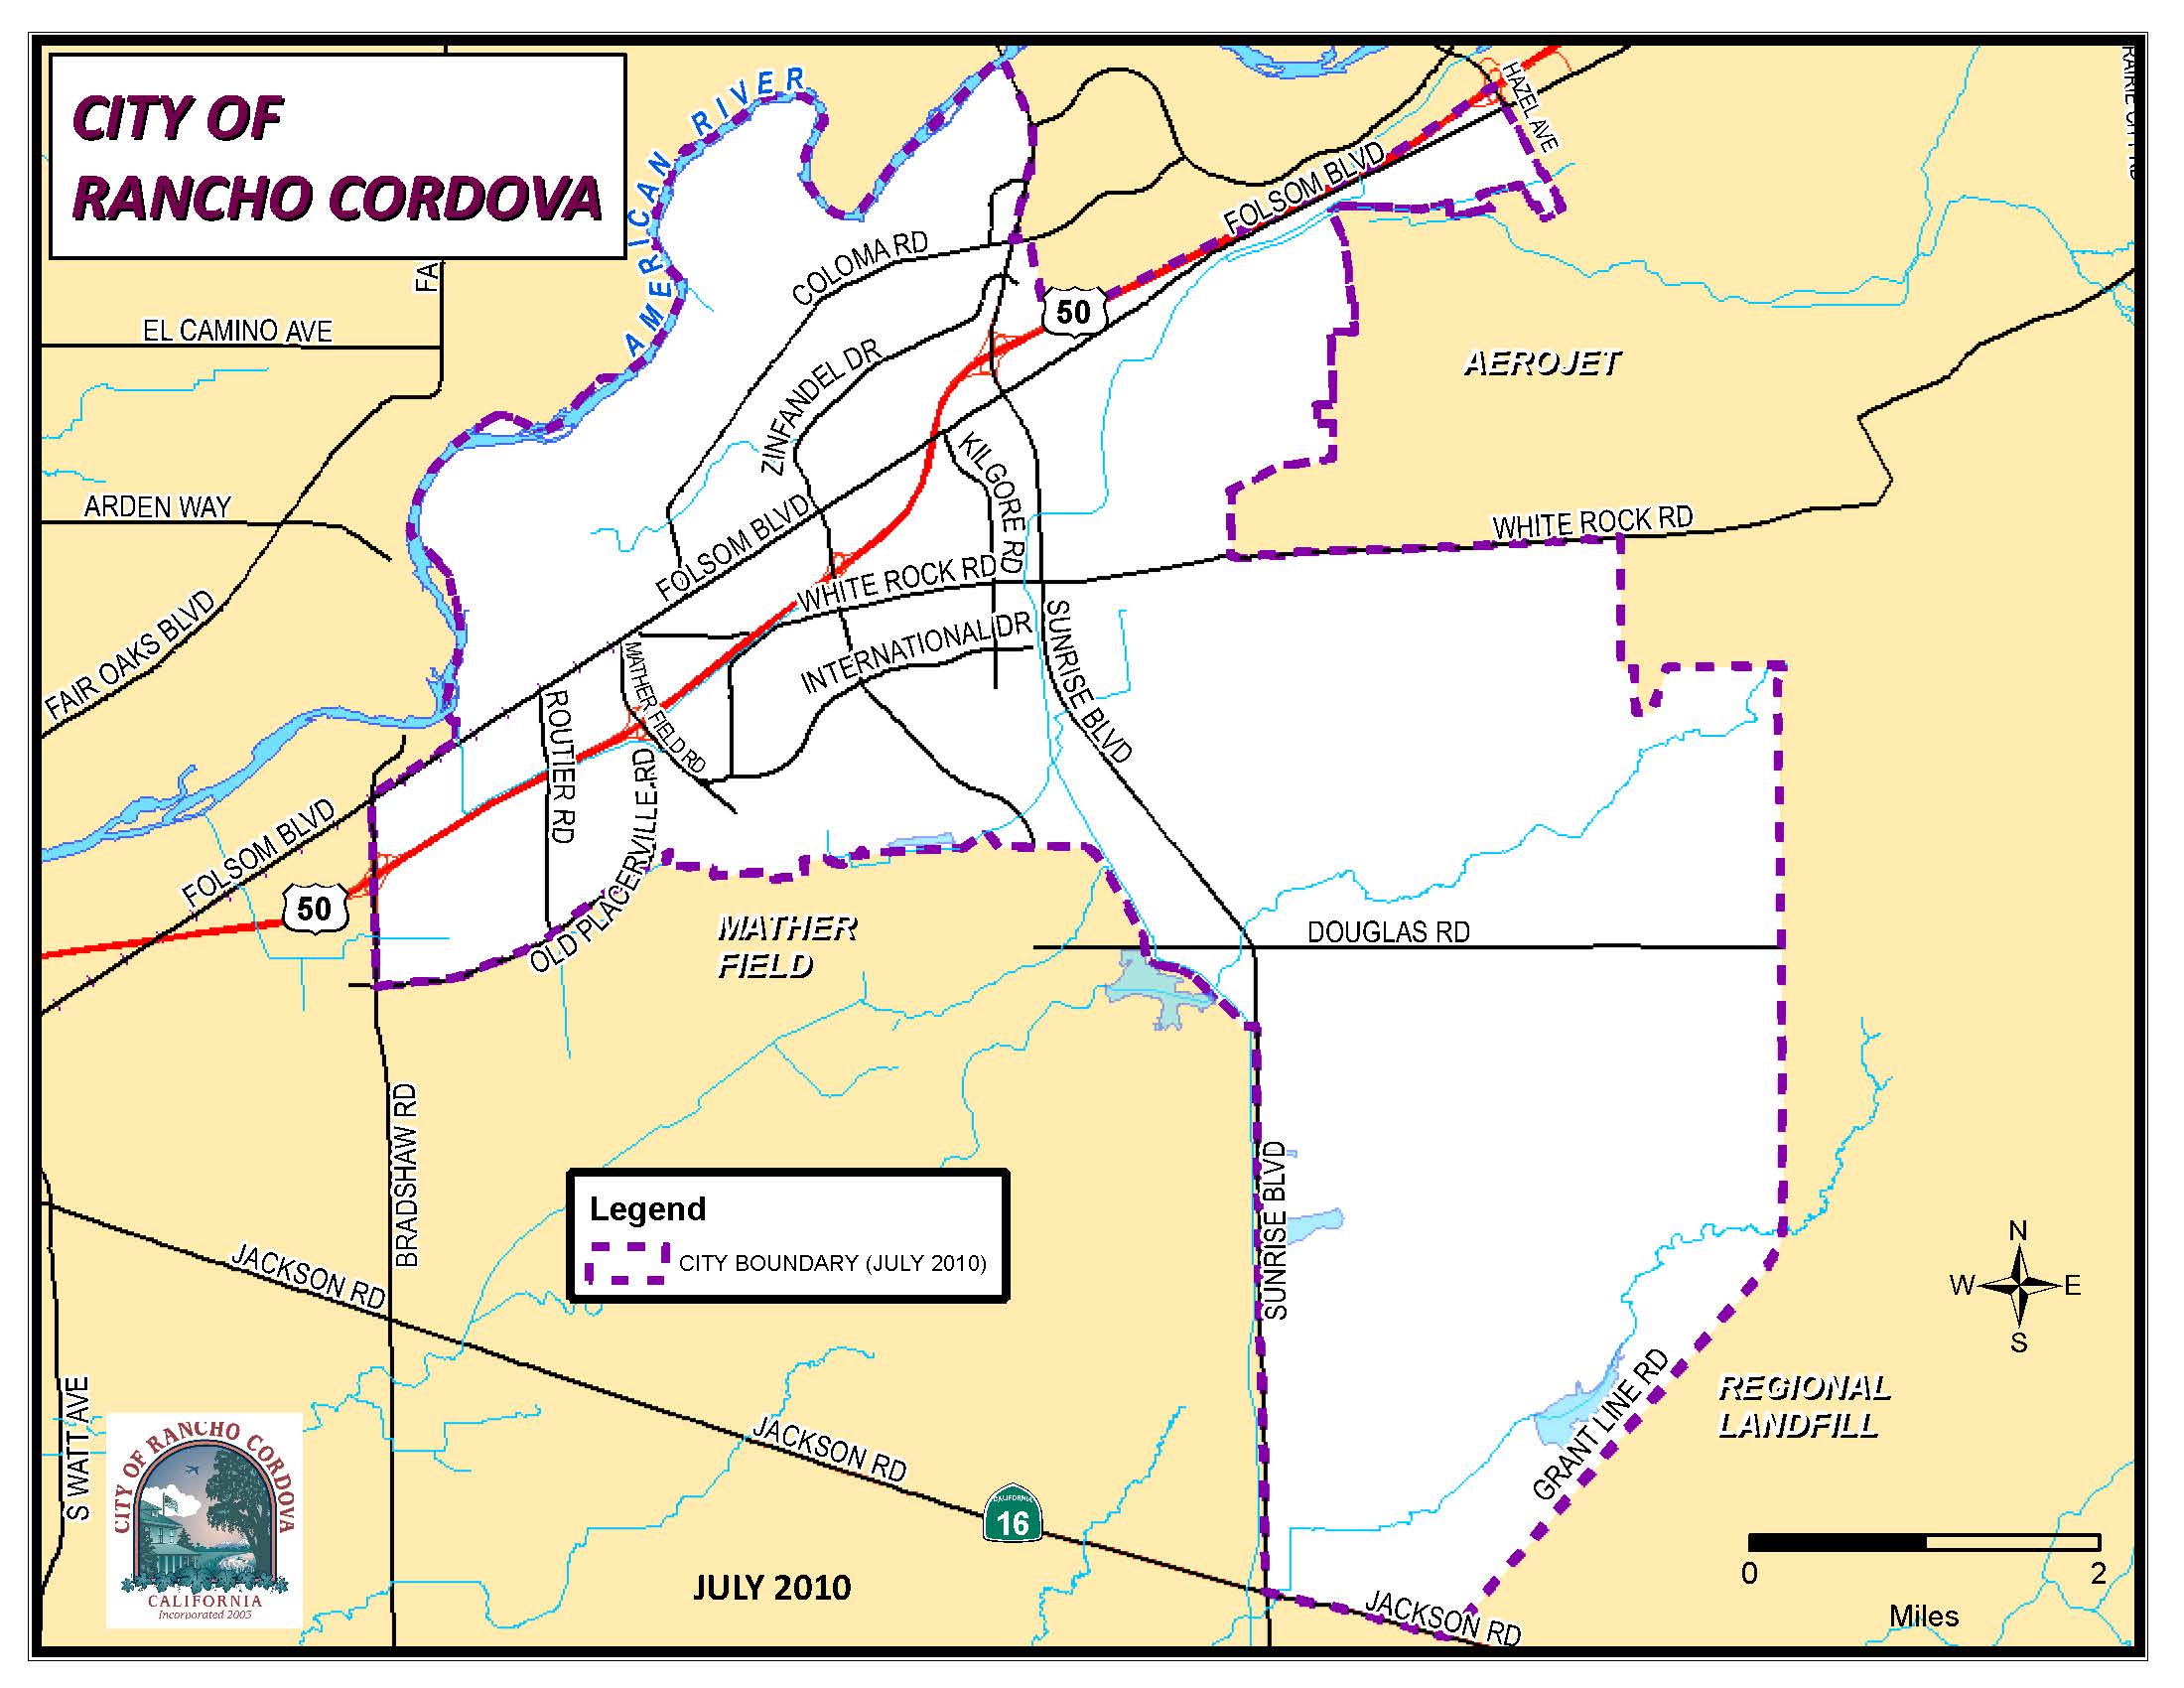 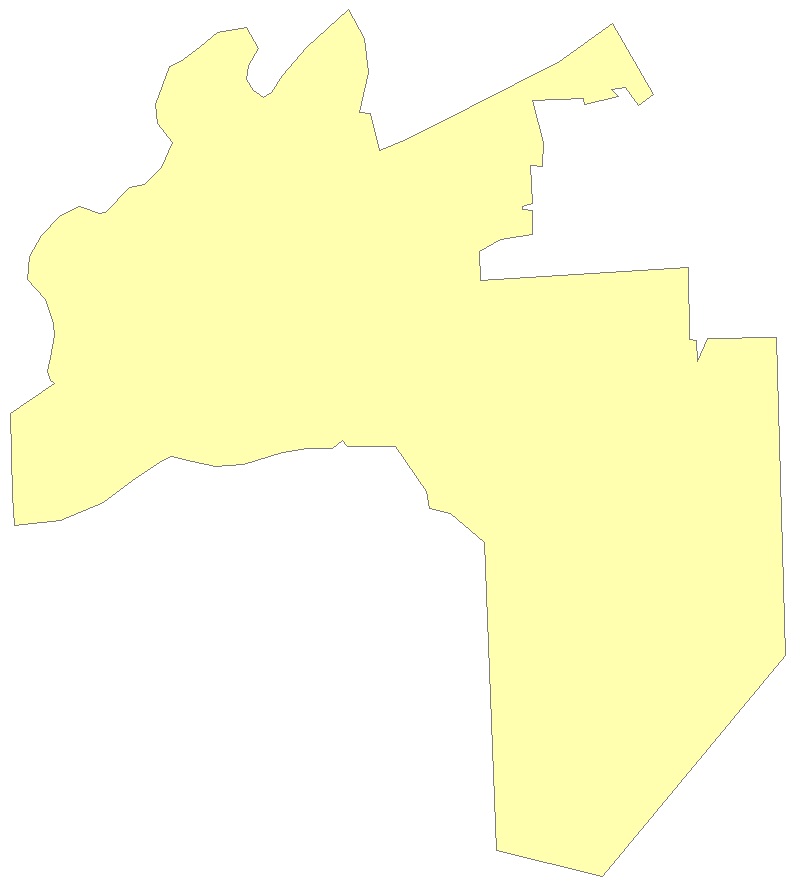
I georeferenced the boundary image to both maps. Then I used the Draw tool to create a polygon of the city boundary. I used the Raster Clip tool to clip the desired area of interest. This resulted in two images—a map of Rancho Cordova in 2003 and a map of Rancho Cordova in 2016. 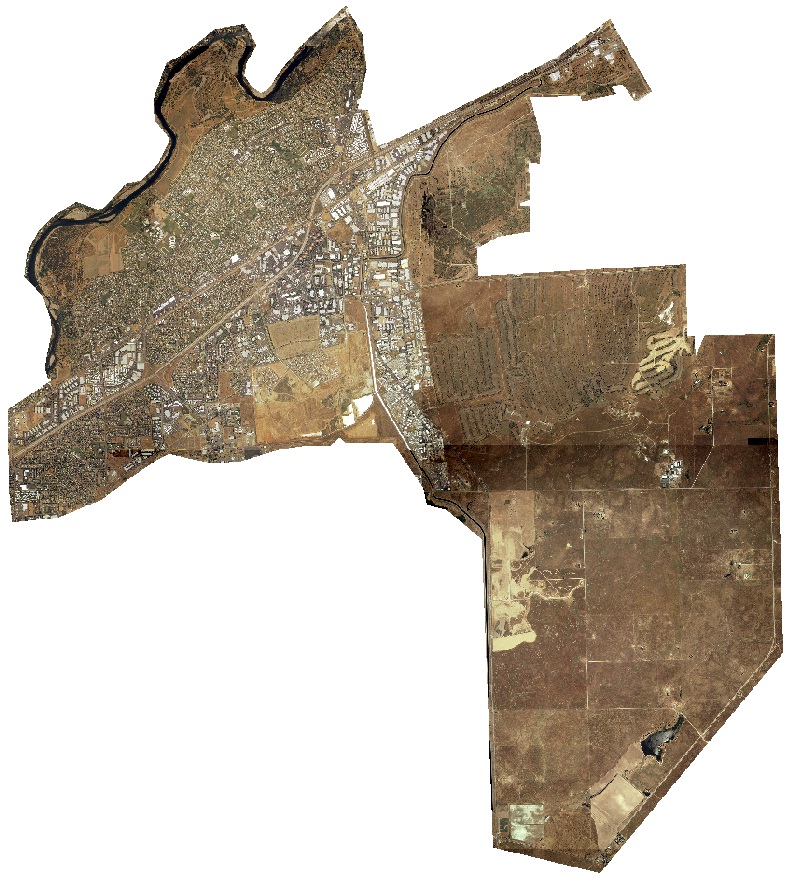 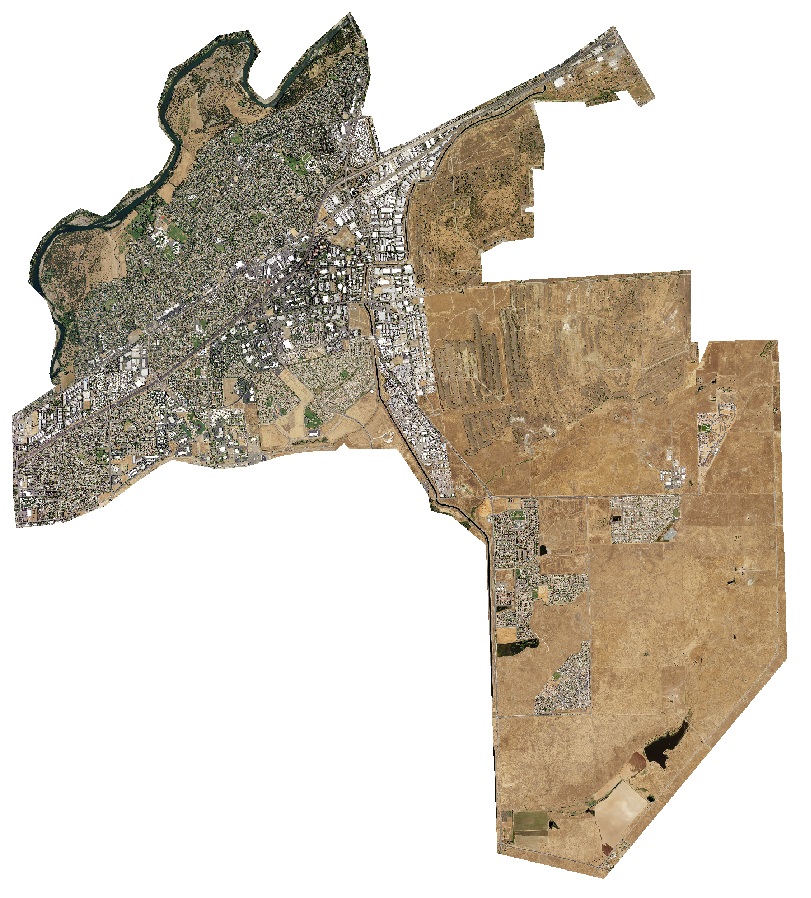
I used the unsupervised classification method with 20 classes. I looked at each class one at a time and renamed them by land cover type (urban, bare, forest, water). 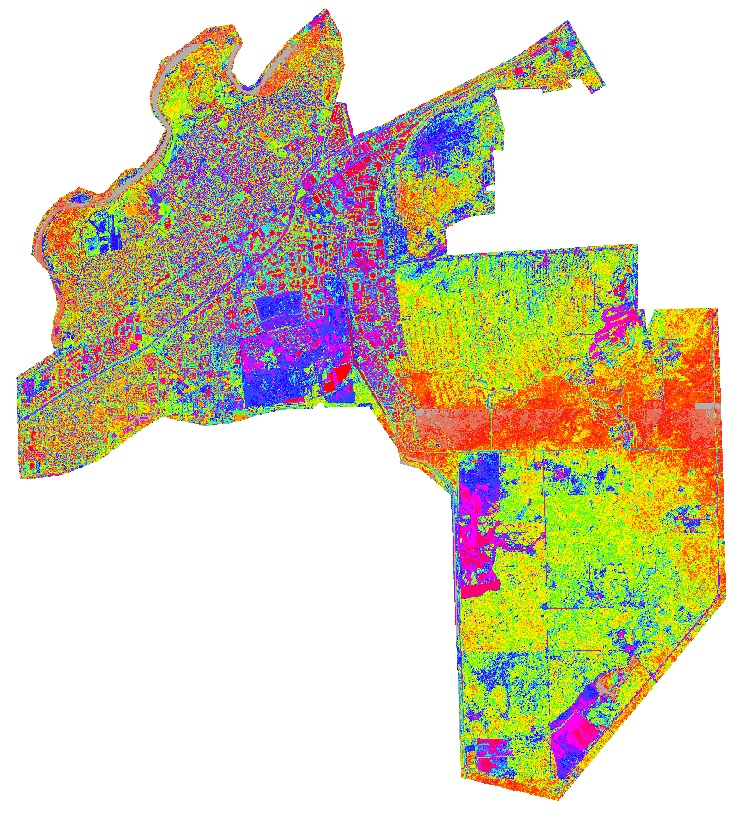 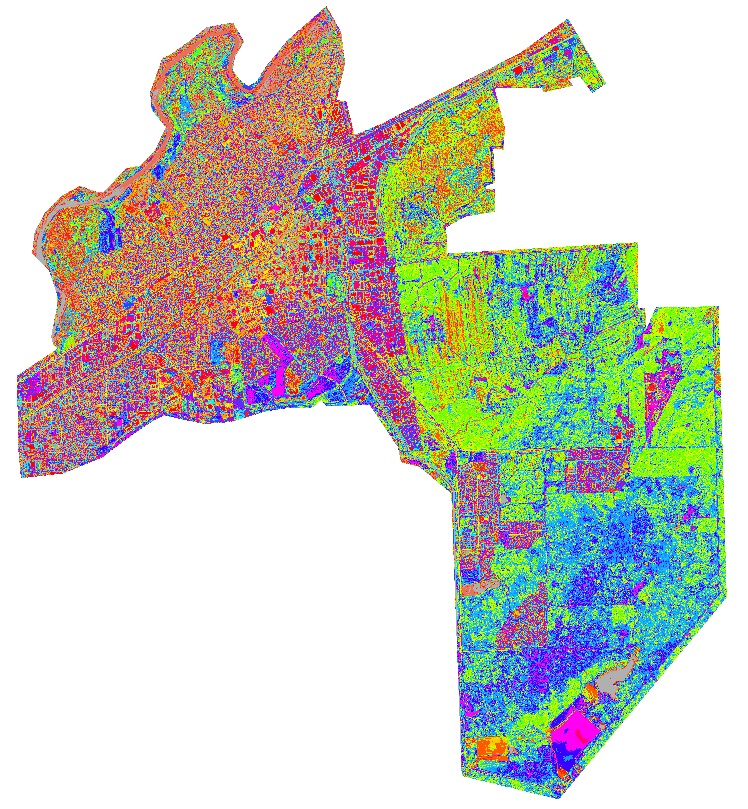
I reclassified both to obtain the final land cover image. Using the pixel count in the attribute table, I calculated the percentages of each land cover type. 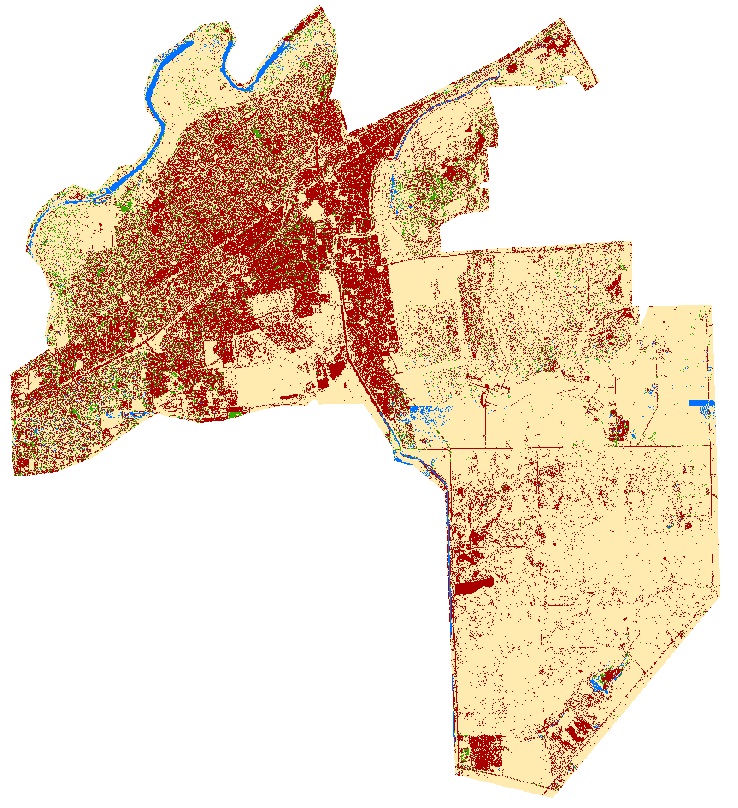 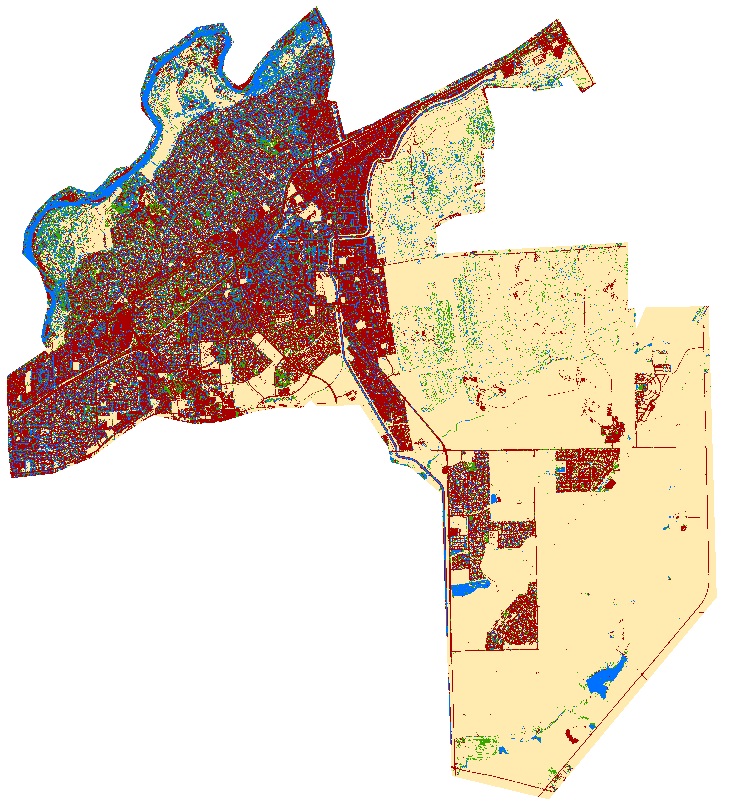
| ||||||||||||||||
|
Results The table shows the increase and/or decrease in each land cover type. The graphic helps illustrate the changes between the two years. | ||||||||||||||||
|
| |||||||||||||||
|
Analysis The results showed that the urban area only increased 0.1%. When comparing the maps itself, it’s clear that increase in urban area is more than a fraction of a percent. The bare land decreased by 12.6%, which sounds more reasonable. Shown below is one of the issues that occurred. The 2016 image wasn’t a true ortho image so there were shadows around the buildings and trees. The dark shadows ended up in the same classes as the water. The shadows in the 2016 image are why there was an 8.7% increase in water. If the issue with the shadows didn’t occur, the increase in urban area would more closely correlate with the decrease in bare land. 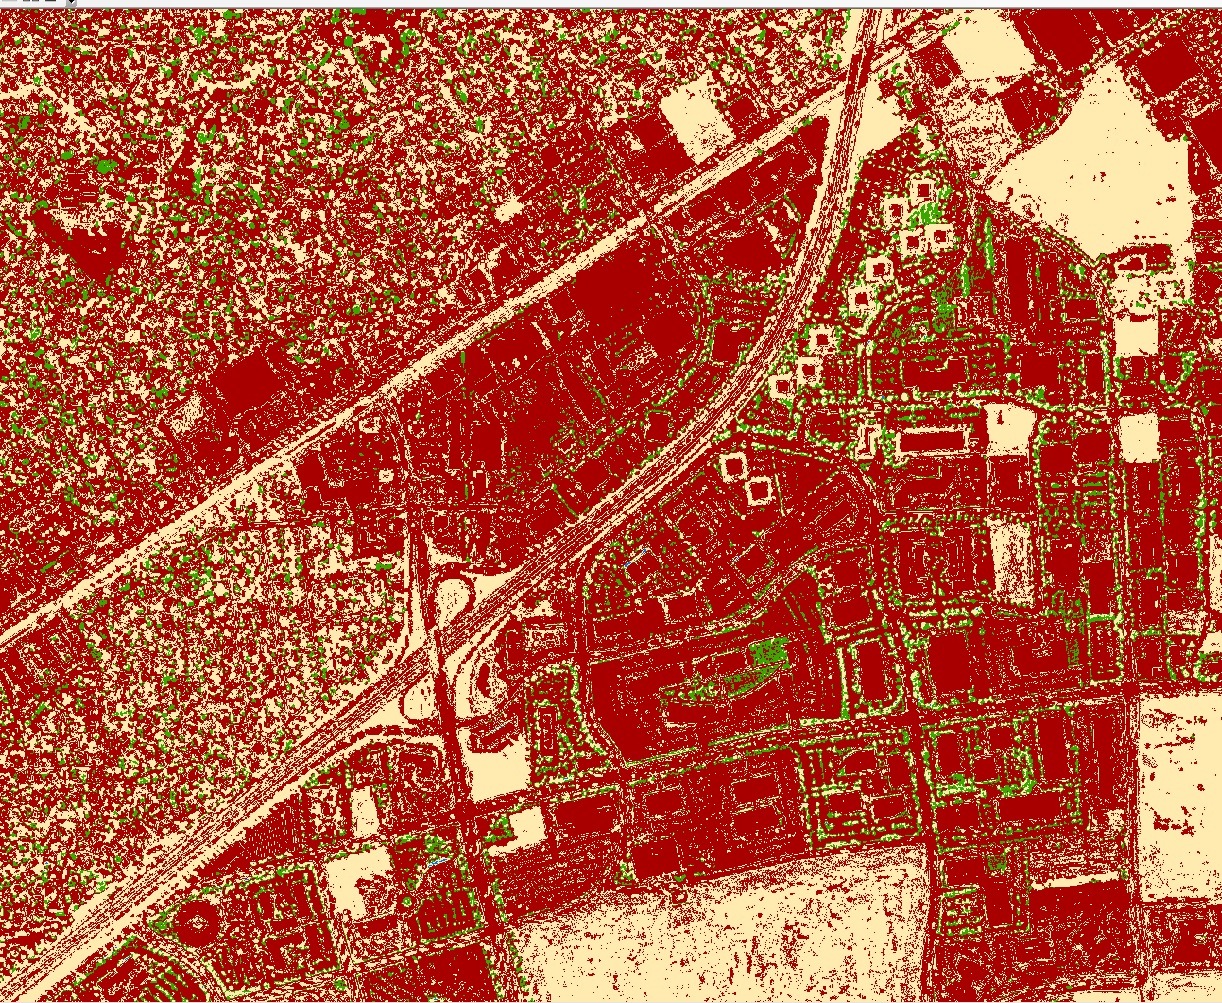 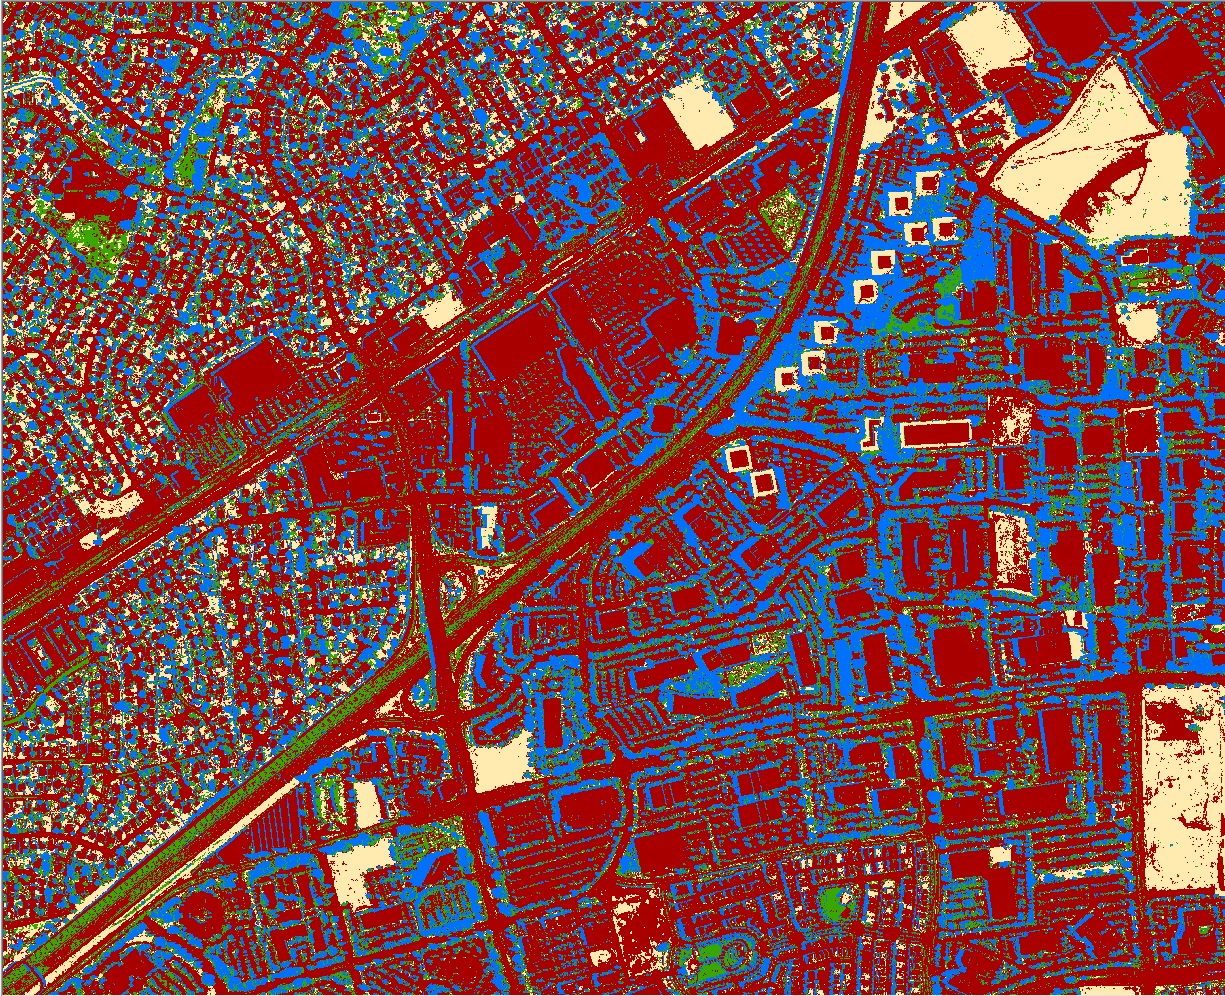
| ||||||||||||||||
|
Conclusions If I were to repeat this project, I would choose a smaller area. The area north of US 50 didn’t change so I could have cropped that area out. The smaller area would cut down room for error in classification. I also would look for true ortho imagery so shadows wouldn’t affect my land cover. If I had more time, I would do a supervised classification which could result in better samples. I did not get the results I wanted, but the images did show some of the change that I was expecting. | ||||||||||||||||
|
References "Geospatial Data Gateway."USDA. 2016. gdg.sc.egov.usda.gov/. "Rancho Cordova: City Maps." Rancho Cordova California. 2016. www.cityofranchocordova.org/residents/city-maps. "The History of Our Incorporation." Rancho Cordova California. 2016. www.cityofranchocordova.org/home/showdocument?id=9470. | ||||||||||||||||