Remote Sensing of Submersed Aquatic Invasive Vegetation (SAV) using BioBase
Sonar Imagery and Hyperspectral Imagery
Author Information
Ralph Jaggi
American River College, Geography 350: Data Acquisition in GIS
W1545578@apps.losrios.edu
Abstract
This paper documents two ways to obtain remote sensing of Submersed Aquatic Vegetation, (SAV). One is a SONAR, Bio Base system we have been using for years. The other is Hyperspectral data, which is relatively new. I will show you examples of each.
Introduction
I work for the CA State Parks, Division of Boating and Waterways, Aquatic Invasive Species. My name is Ralph Jaggi, age 63, currently a student Intern.
Let’s take a tour, a tour of what we do, where we do it, and the importance of what I do. Our job is to control Invasive weeds growing in the Delta. We know we cannot eradicate them, they are too established, and if we actually did that, it would have severe, dire, and collateral consequences to the environment, animals, and us. We wage a war on the excess growth of invasive weeds, while preserving the native plants, all the while, keeping our water safe to use and drink.
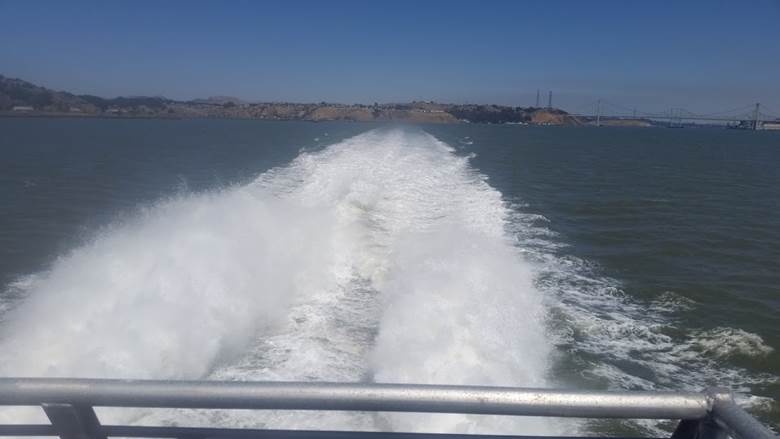
We do NOT use this boat.
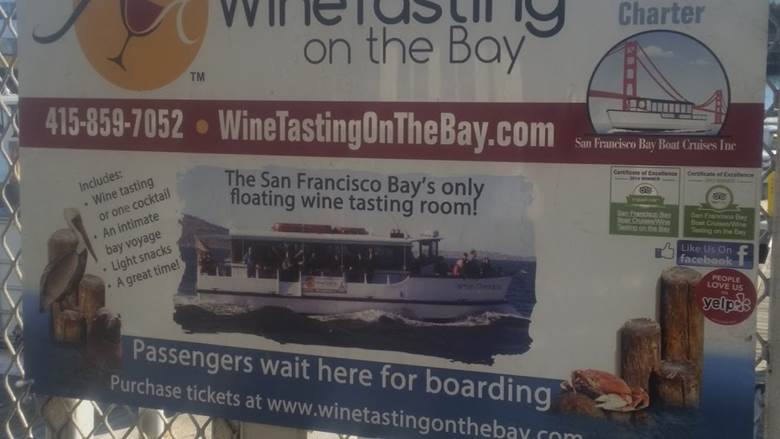
And definitely not this boat
We are heavily regulated to make sure we kill specific weeds, and do not disrupt the environment in doing so. Towards that end, we are the only organization that has a toxicologist on site, and his job to also to insure we are placing the correct chemical, where we need to maximize efficacy, while minimizing issues.
Where do we treat - The California Delta
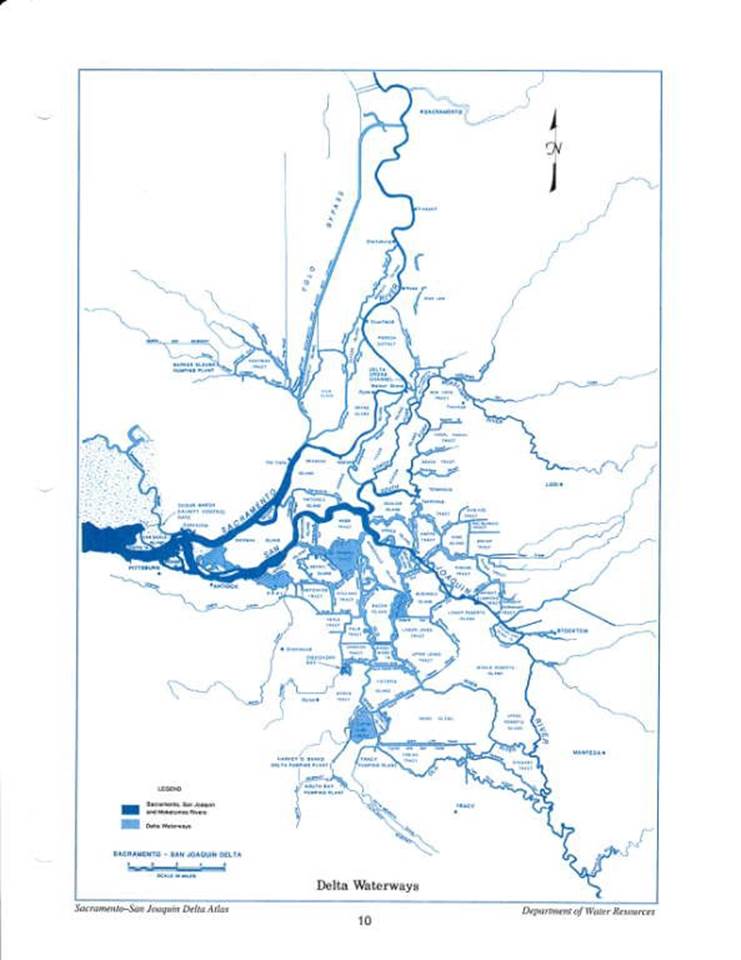
We treat an area that is Huge! Its size is a 740,000-acre brackish inland sea.
So what do we use to treat the Delta, regular boats,

And 600 HP Counter Rotating propeller Airboats !

Background – Literature Review
My Project is to learn about Remote Sensing of Submersed Aquatic Invasive Vegetation (SAV) using Hyperspectral Imagery, and compare it with Bio Base.
Both papers, even in their titles have a word that should be modified. Submerged, vs. Submersed. My supervisor has made it clear to me the differences of the two words and the more appropriate, Submersed for SAV, is denoting or characteristic of a plant growing entirely under water, vs. Submerge is to sink out of sight, like a submarine.
My goal is to learn, ascertain and discern the most effective use of Hyperspectral energy and existing imagery, (extra credit to get some imagery myself with a drone), to detect submersed aquatic invasive vegetation.
My overall goal is to find relevant examples of SAV Biovolume. To correlate the SAV Biovolume found by remote sensing with what we have found using Hydro Acoustic (sonar) methods.
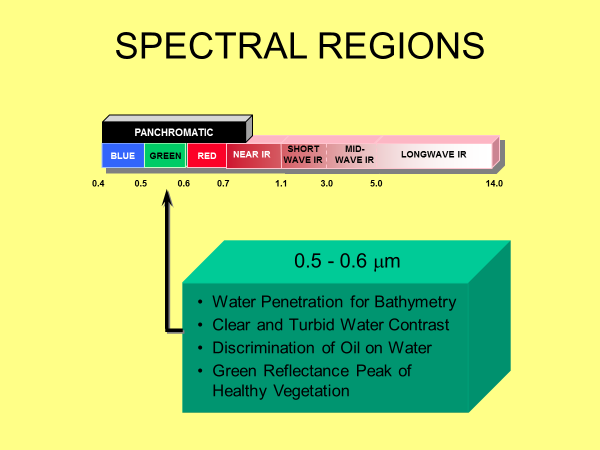
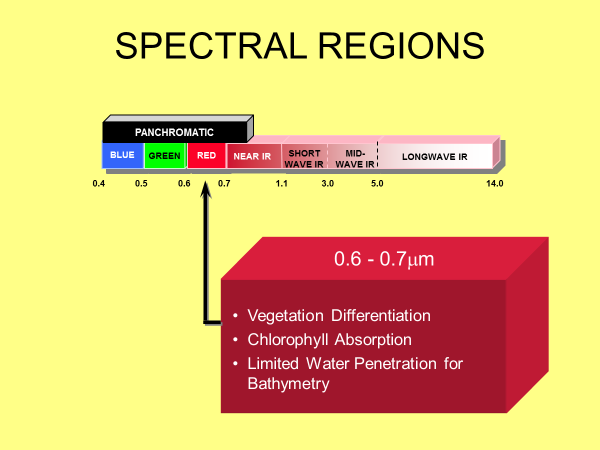
The first referenced paper gives you a general background in satellite Hyperspectral Bands, and the reasons why certain bands are most appropriate to discerning plant pigments, and spongy mesophyll structures. These include blue band of 450 nanometers, and red band of 670 nanometers, as well as Near-Infrared band from 700 to 1300 Nanometers. It does give examples, but really provides more of the theory how to do something, vs. what to do.
The second paper is more about the mechanics of a particular place with a particular SAV problem, using airborne remote sensing, not satellite sensors in the first paper
Methods
So what do I do? I am not the guys and gals in the boats who spray the chemicals, that kill the weeds.
Ed Spraying Hyacinth
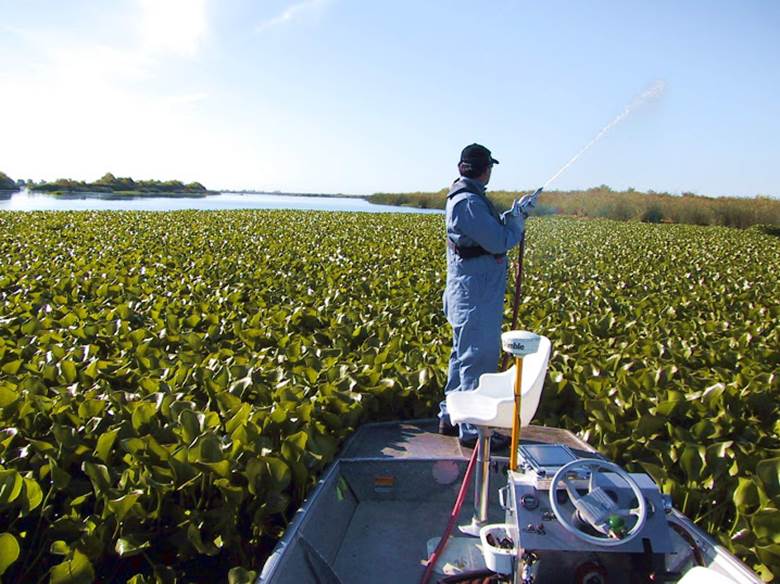
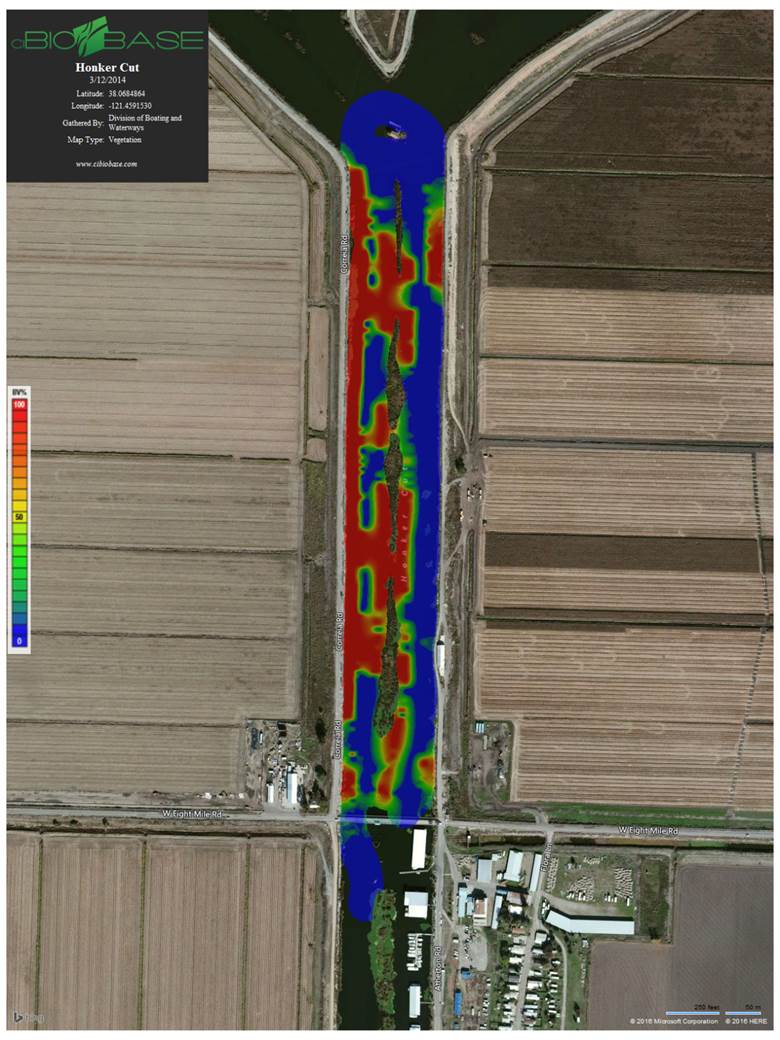
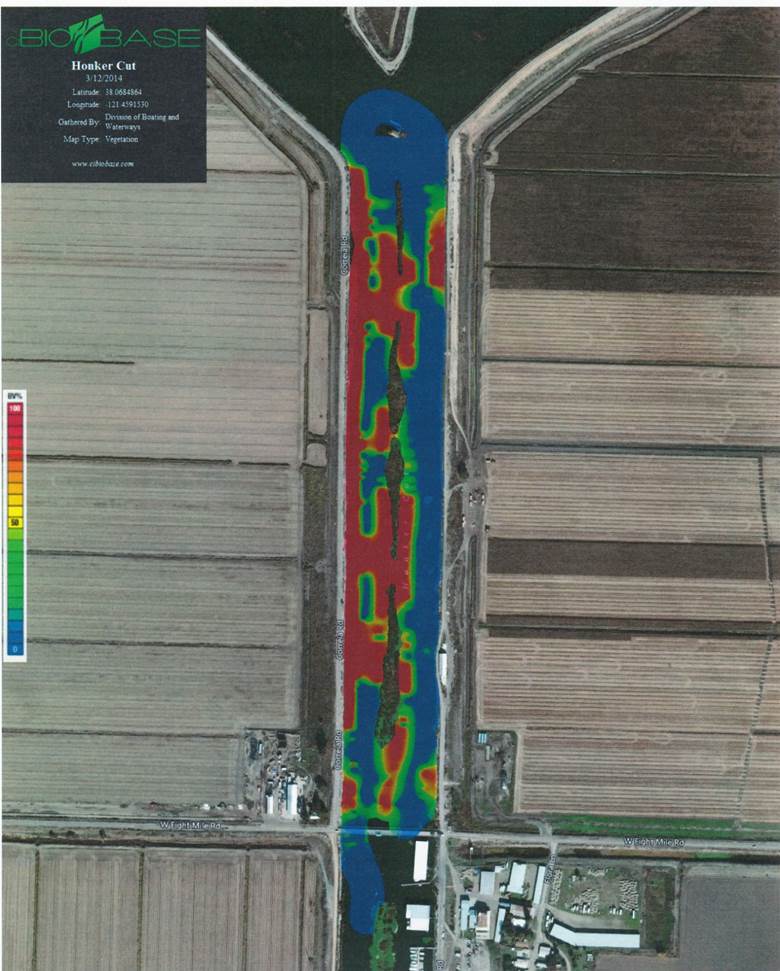
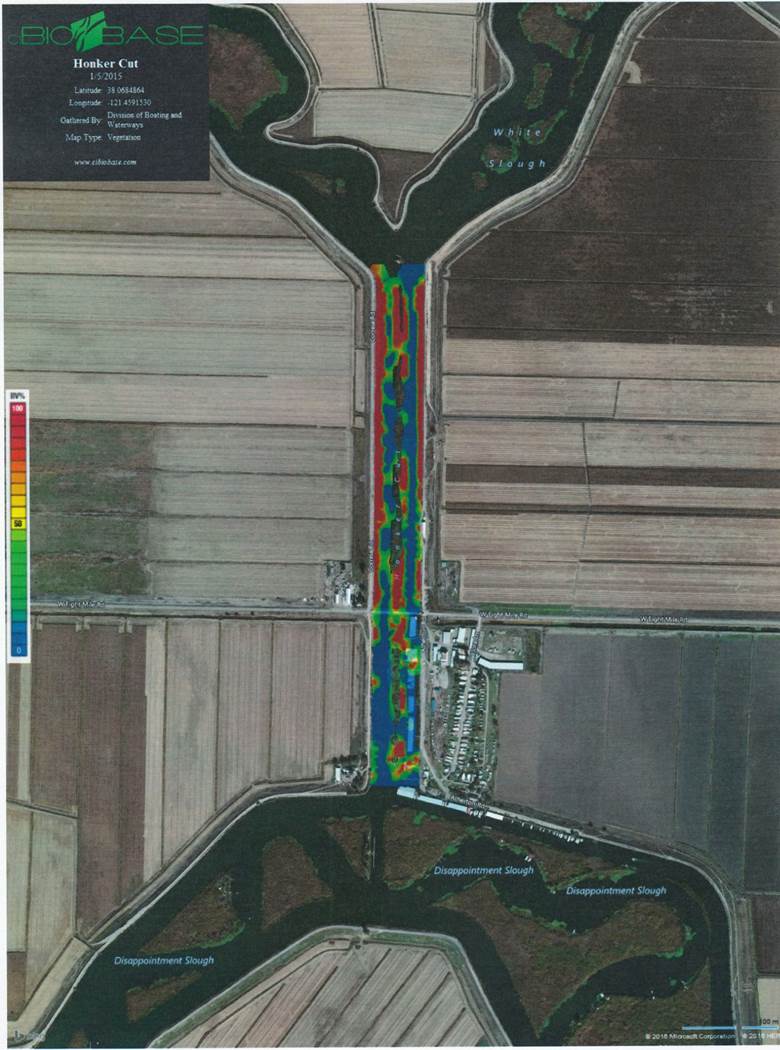
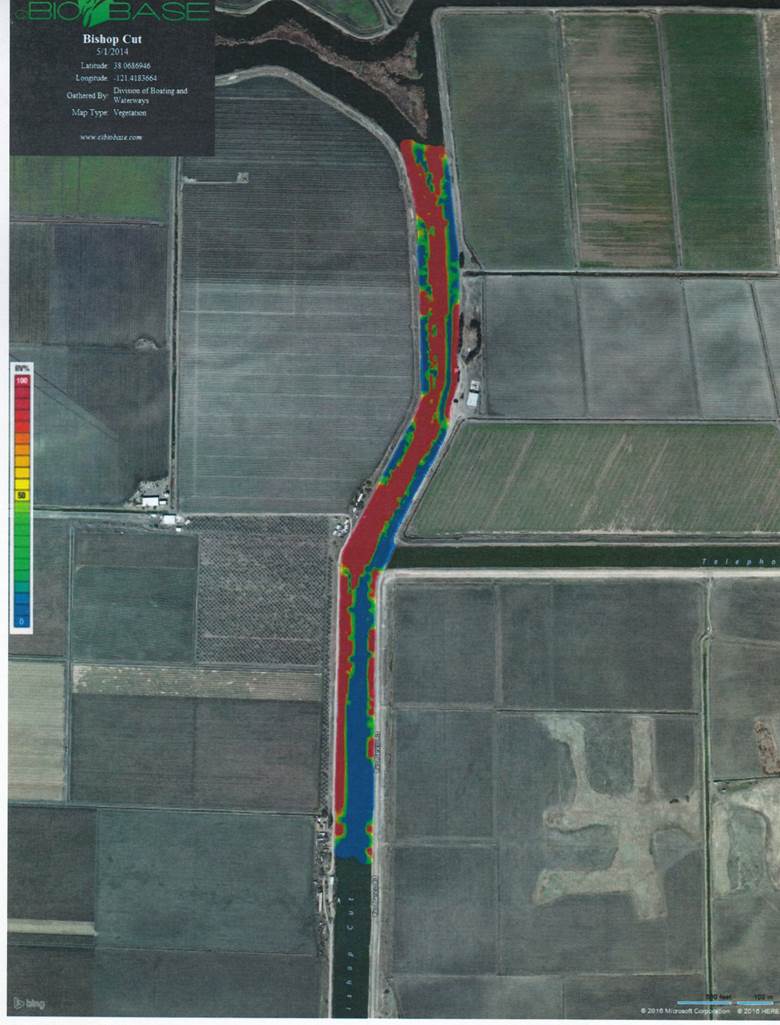
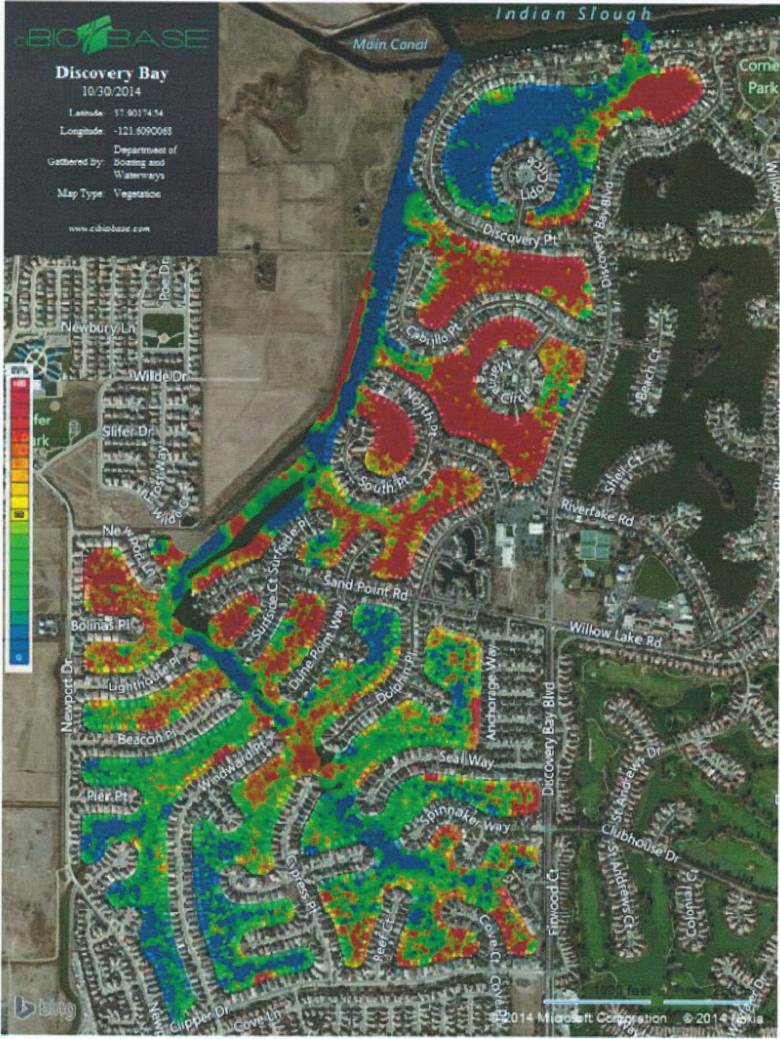
I am the one that maps out where the spraying is to occur. Today, that is done by a boater swath that travels above suspected submerged aquatic vegetation, (SAV) on the bottom of the river, or slough. What we have when the boater is finished is a georeferenced color map showing the intensity of the SAV.
See Bio Base Map of Franks Tract
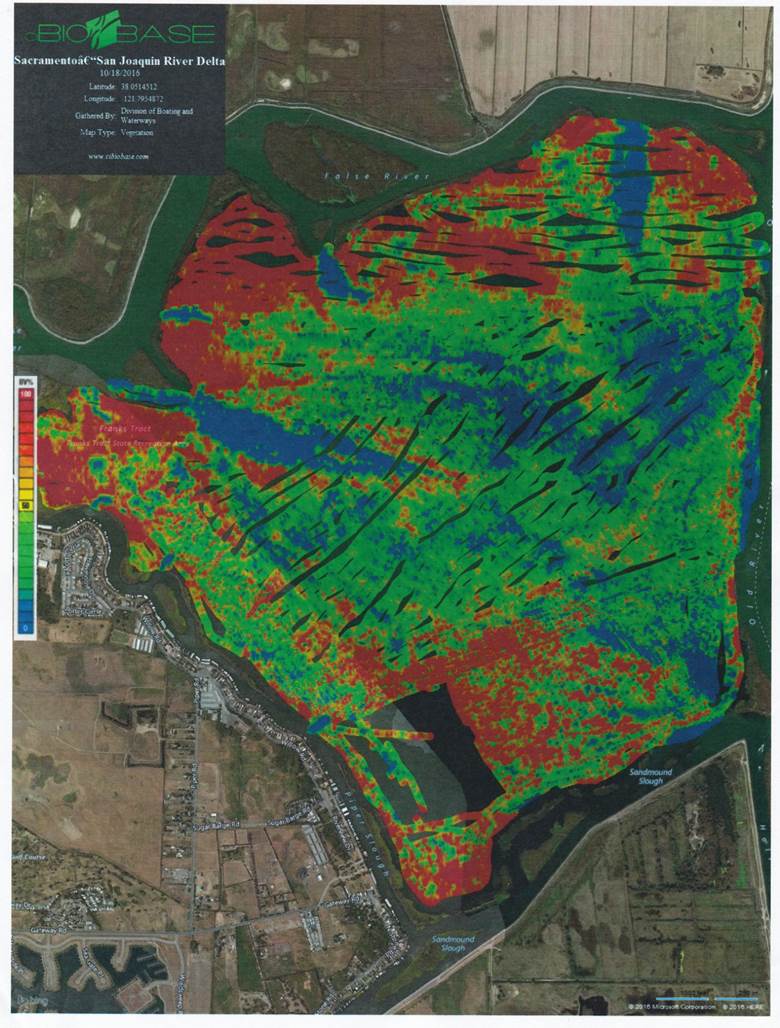
What are the limitations of this technique, you have to boat out every bit of the area you wish to treat, this yields a map, and that has to be analyzed into actual spray lines for treatment. One thing for a slough, a whole larger problem on a huge volumetric area like the complete Delta, or a large lake like area like Franks Tract, which is taking 60 plus maps, and counting to completely cover it.
Ok, so how can this be changed to be even more through, efficient, and faster. Fly above the Delta monthly, in a fixed wing airplane, taking Hyperspectral Images that come in directly to us. That’s is our plan in early 2017, maybe even as soon as January. And to do certain other large areas like Franks Tract to use a programmed, autonomous submersible.
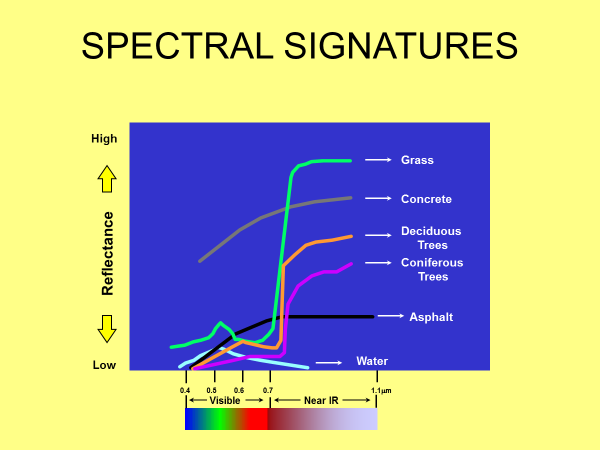
Sounds neat, doesn’t it. So, what is Hyperspectral, and what makes it unique, powerful, and so useful, and expensive, and so hard to get. Basic imaging is generally a few bands, like Red, Green and Blue, and you can do a lot with those 3. However, to differentiate SAV – in the water, and one SAV from another SAV, from Floating Aquatic Vegetation, FAV like Hyacinth, floating - on top of the water, you need the unique spectral signature of that vegetation.
And Hyperspectral is hundreds of individual spectral frequencies. In the background section, we saw some of the many spectral frequencies for vegetation. As Dr. Howard at American River College showed us in his one period Remote Sensing class, vegetation has a very distinct spectral signature. We can use that for classifying SAV frequencies.


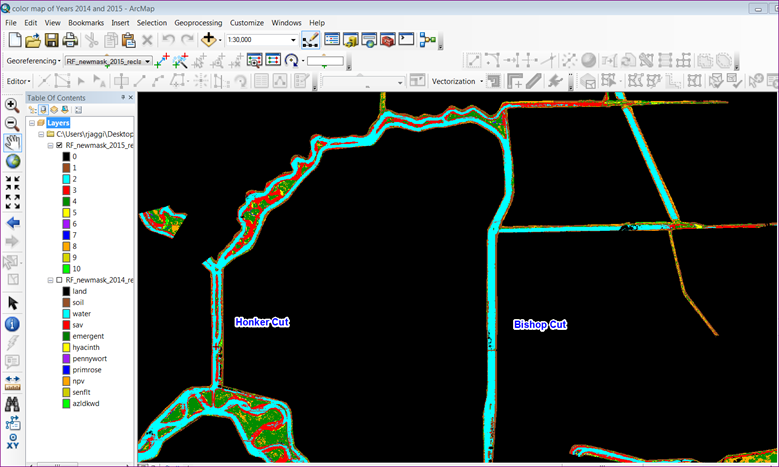
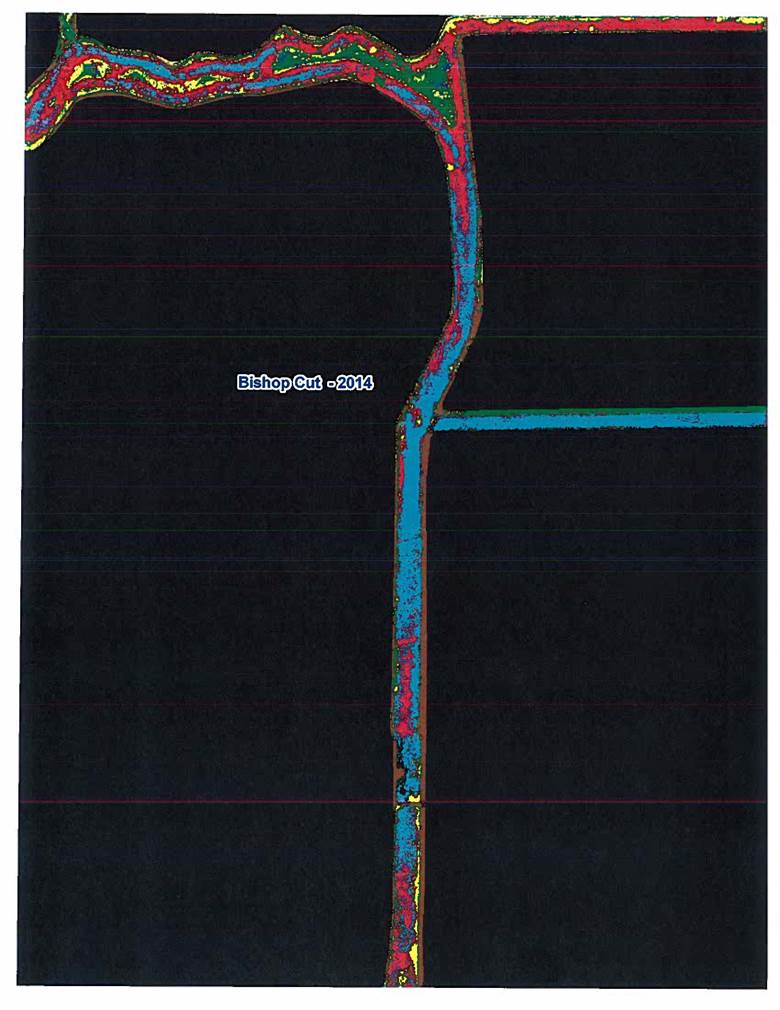
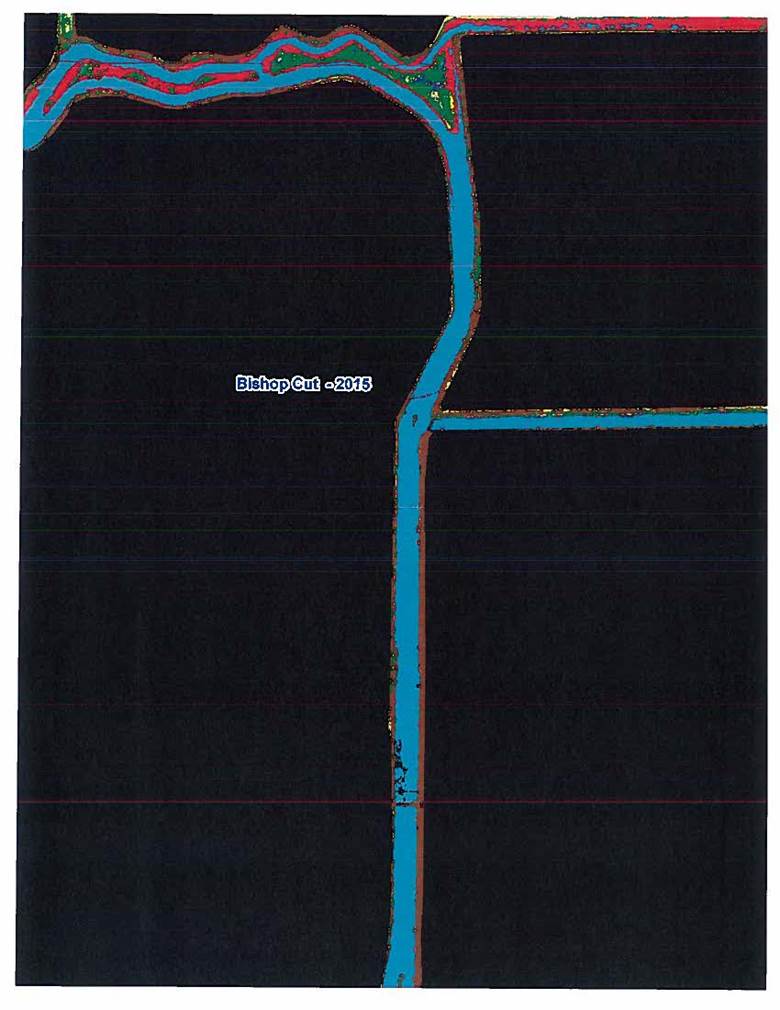
Since we began this project, I have been trying to get Hyperspectral Images, and Dr. Khanna Shruti, of UC Davis graciously has given me Harris software, ENVI processed images of the Delta for years 2014 and 2015. They are run as flight lines. These contain 400 bands. They were however processed by UC Davis, Center for Spatial Technologies and Remote Sensing, (CSTARS), not by me.
Now let’s look at the images.
Results
Pictures of Bio Base Sonar first, then Hyperspectral


Analysis
I have extracted the same areas, and years in Bio Base database, so we can compare them here. There is some correlation, but it is not an exact match. So clearly the parameters, or selected bands of the ENVI Software will have to tuned for a better SAV match. I was hoping for better. This is a work in progress. I was truly hoping the SAV from an airplane, done by some else, would just automatically correlate directly to our boating sonar surveys. It actually does at times, and that gives me hope, though at other times it just is not good enough for any work, never mind government work. It is possible the actual SAV that the airplane saw, is not the same SAV as what we saw. Or we incorrectly identified our SAV. Or the parameters, and or tuning, required in the ENVI processing have to be modified, and/or matched to the specific frequencies of our specific SAV. Or our mapped SAV, is not the same as their SAV. There are too many variables that cannot be exactly determined on this round. Though I know it will get better.
Conclusion
I will be implementing the Geo Tagged mapping from any, and all sensors, be it the old, known and reliable-sonar mapped, our new fixed wing Hyperspectral, and/or brand new semi-submersible. Our SAV reduction team would expect no less. Whatever it will be, I am up for the challenge. So now onto 2017! Stay tuned for updates, they are sure to improve, and get even better.
Thank you, for listening.
References – Literature cited
Cho, H.J. Mishra, D. & Wood J. (2012). Remote Sensing of Submerged Aquatic Vegetation. InTech, Available from :http://www.intechopen.com/books/remote-sensing-applications/remote-sensing-of-submerged-aquatic.
Ciraolo, G. Cox E. Goffredo L. L. & Maltese A. (2006). The classification of submerged vegetation using hyperspectral MIVIS data. Annals of Geophysics, Volume Number 49, Issue 1, 287-294.
Legal
Unpublished work ©2016 California State Parks, all rights reserved. For permission, contact PubInfo@parks.ca.gov. All materials contained herein are protected by the United States Copyright Law and may not be reproduced, shared, sold, distributed, transmitted, displayed, repackaged, published or otherwise transferred without the prior written permission of California State Parks. You may not alter or remove any trademark, copyright or other notice from copies of the content. This material is provided for your personal, non-commercial use only. Data Disclaimer: Every reasonable effort has been made to assure the accuracy of the data provided, however, California State Parks and its employees and agents disclaim any and all responsibility from or relating to any results obtained in its use. The GIS database and data in the product is subject to constant change and the accuracy and completeness cannot be and is not guaranteed. CALIFORNIA STATE PARKS MAKES NO WARRANTIES OR GUARANTEES, EITHER EXPRESSED OR IMPLIED AS TO THE COMPLETENESS, ACCURACY, OR CORRECTNESS OF SUCH PRODUCT, NOR ACCEPTS ANY LIABILITY, ARISING FROM ANY INCORRECT, INCOMPLETE OR MISLEADING INFORMATION CONTAINED THEREIN.