Yosemite Valley to Tenaya
Lake: An Alternative Expedition |
|
Author
Marvin Castañeda American River College Geography 350: Data Acquisition in GIS; Fall 2017
|
|
Abstract
Yosemite National
Park features breathtaking glacially-shaped landforms.
This study seeks to find a route from Yosemite Valley
to Tenaya Lake that differs from those already
established. Using ArcMap and ModelBuilder, a least
cost path analysis was conducted using slope and
landcover as variables. The result was a unique path
from our starting point to our destination.
|
|
Introduction
Yosemite
National Park is an iconic place and attracts
millions of visitors a year from around the world.
However, most visitors stay within a couple miles
of the trailheads of Curry Village in Yosemite
Valley, and do not venture out further into the
park. As someone who enjoys the thrill and
excitement of a good long hike, I wanted to see if
there was an alternative route from
already-established trails. This project is
conducted with the purpose of finding an alternate
route from Curry Village in Yosemite Valley to the
trailheads near the shores of Tenaya Lake. Both of
these locations are popular starting points for
incursions into the Yosemite wilderness. A least
cost path model will be constructed using slope
and landcover as variables.
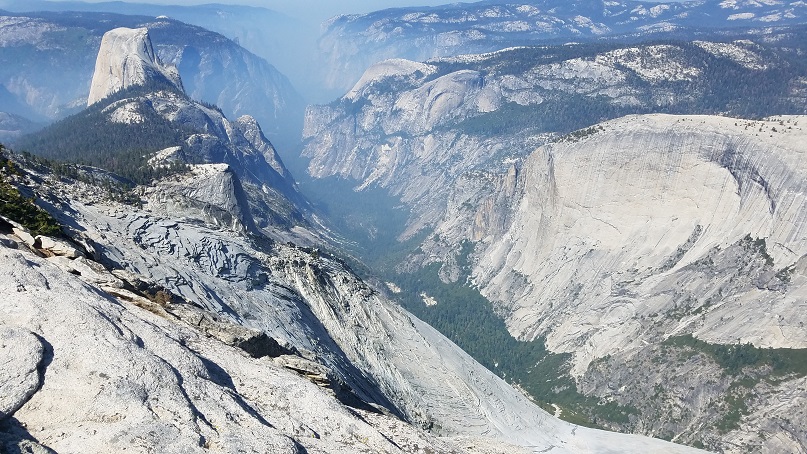
Photo Credit: Marvin Castañeda |
|
Background
Slope,
which is also defined as elevation rise over a given
distance, is well known as the most significant
variable that dictates the difficulty of a hike. Other
variables that dictate difficulty are landcover and
distance.
Getting to Tenaya Lake from Yosemite Valley is not something that the average hiker does as a day hike; most people opt to set up camp before nightfall and finish the trip the next day. Hiking on the Mist Trail, which is the most popular hike in the whole park, and is guaranteed to be packed with tourists in the summer months, is one of the most direct ways to Tenaya Lake from the valley. After that, you enter Little Yosemite Valley, which is a cirque opposite of Tenaya Canyon; Cloud’s Rest is the arete that separates the two. Once in Little Yosemite Valley, you continue northeast along the John Muir Trail until you arrive at the shore of Tenaya Lake. The other main route from Yosemite Valley to Tenaya Lake is by the Snow Creek Trail. This trail takes you from the valley and instead of hiking parallel to the Merced River, it takes you into Tenaya Canyon parallel to Tenaya Creek before the trail turns north and climbs considerably in elevation. Here, the trail goes northeast on the north side of Tenaya Canyon until it reaches Tenaya Lake. Considering overall elevation gain will be less if one were to hike directly up Tenaya Canyon, this begs the question: why is there no established trails there? Tenaya Canyon holds a reputation as a dangerous and difficult place to navigate, definitely not for the casual hiker. This place is often referred to as the Bermuda Triangle of Yosemite because people go missing or have died within its confines. In addition, the place is said to be cursed because Chief Tenaya, leader of the Ahwanheechee people lost his youngest son at the hands of white settlers during the Gold Rush Era. He consequently cursed the canyon that now bears his name. |
|
Methods
In order to conduct the least cost
distance path from Yosemite Valley to Tenaya Lake,
I obtained a vegetation dataset from the Yosemite
National Park Vegetation Inventory Project.
This dataset was in vector, but had detailed
classifications. I also used a 10-meter DEM. Data
preprocessing consisted of setting my layers to an
appropriate coordinate system (NAD 83 UTM Zone
11N) and also clipping to my study area (based on
a polygon shapefile I created). I also created two
point shapefiles, one for the starting point of
the route, and the other for the destination.
After that, I proceeded to rasterize the polygon
vegetation layer and also specify a cell size of
10 meters. I also derived a slope raster layer
from the DEM by using the slope tool. I then
proceeded to construct my model in ModelBuilder. I
reclassified the slope layer with ten classes and
used a natural breaks classification method; the
data had a J-curve orientation.
Slope Classification  The next tool
in the model required me to improvise. When using
the Weighted Overlay tool, I set a 75% influence
for the slope and 25% for the vegetation. However,
when I rasterized the original vegetation dataset,
my resulting raster contained 72 records. Before I
specified inputs in the Weighted Overlay tool, I
created two new
fields in the vegetation raster. I consulted
the National
Land Cover Dataset (NLCD) to create the
NLCD_CODE field. Instead of having very specific
classifications, I lumped then into fewer
classifications, from 72 down to 9. The Reclassed
value field indicates the ranking of the cost
(from 1 to 10) that the output will have. It was
tedious, but I then proceeded to go through the 72
records in the weighted overlay table and assign
the new scale value based on the Reclassed value
field.
Weighted Overlay Table  This got me my
cost raster as the output. The cost distance
tool's inputs were this cost raster and the
destination point. I then got a cost distance
raster and a backlink raster as outputs. These
two, in addition to the starting point shapefile
were inputs for the cost path tool. The output for
this was my final result, the least cost path.
This output is in the form of a raster, so for
visual purposes, I vectorized it to a line
feature.
Overall Layout of Model
 |
|
Results
 |
| Analysis
The model's final
output does not have any unsettling or glaring
errors. The model outputs a path that essentially is
a deviation from the Snow Creek Trail. However, the
Snow Creek Trail does not cross Hwy 120 (Tioga
Road), and stays south of it; the least cost path
does cross it, twice. Given the inputs that were
provided to the model, the final result is
reasonable and conclusive. Upon further review of
the landcover/vegetation dataset, the areas of Hwy
120 are not shown as paved road, barren land, or
anything of the sort. Instead, those cells are shown
as the same landcover or vegetation as surrounding
cells. This is probably why the least cost path
crosses the highway on its way to Tenaya Lake.
 |
|
Conclusions
In order for this
model to get results that are more refined, it
should be re-implemented with more variables. In
addition, it would be ideal if all input variables
were obtained from the most recent data source. The
Yosemite area frequently has rock fall events. This
is such an example in which having access to the
most up-to-date data sources would reflect the
change in landscape in the analysis.
|
|
Links
ArcScene Least Cost Path Fly-By Video Credit: Marvin Castañeda Yosemite Hiking Trails View From Half Dome Photo Credit: Marvin Castañeda |