| Title | |||||||||||||||||||||||||||||||||||||
|
Author American River College, Geography 350: Data Acquisition in GIS; Fall 2017 Contact Information: michaelchenaille@live.com | |||||||||||||||||||||||||||||||||||||
|
Abstract Nevada’s landscape is unsurprisingly changing over time. Since 2001 CE landcover datasets have been published at regular temporal intervals by the USGS and its partners, offering a look into exactly where and how the land is changing. This paper quantifies the changes across the published datasets. Since the year 2000 millions of acres of land have burned in severe fires and hundreds of thousands of acres have changed landcover types. This was a relatively cursory analysis and done for the sake of education; the results should not be used to inform any actual management decisions as this was done as a proof of concept which can be applied to a more exhaustive analysis in the future. | |||||||||||||||||||||||||||||||||||||
|
Introduction The landscape of Nevada is in a state of transition. Not only is there ongoing urban expansion around areas like Reno and Las Vegas, but there are also plans to install massive energy-generating infrastructure to support said urban expansion as well as export energy to surrounding states for profit. This energy development is all in addition to the 'rare earths' mines, both active and abandoned, that pock the landscape. Happening in tandem with all the aforementioned anthropogenic changes, Nevada's natural ecosystems are rapidly transitioning as well. Pinyon-Juniper woodlands are returning to their historic ranges while at the same time many acres of sagebrush steppe are burning and being replaced by annual herbaceous species (such as cheat grass). This paper primarily focuses on the state of Nevada's landscape post-2000 CE and the changes that have occurred since, though pre-2000 data and information cannot be completely excluded because they can provide invaluable context to the current status of the state. The National Land Cover Dataset (NLCD) has been published thrice since 2000, providing reliable estimates of land cover at a 30 x 30 m pixel scale. I look at the difference in percent cover of different land cover types between the two datasets. I acquired the Monitoring Trends in Burn Severity (MTBS) database to identify areas that have been subject to significant wildfires. | |||||||||||||||||||||||||||||||||||||
|
Background Land cover change is a hot topic in Nevada. The state wants to approve anthropogenic developments across the state including solar farms and also the general trend of urban expansion. The Fish and Wildlife Service’s potential listing of Centrocercus urophasianus (hereinafter sage-grouse) as an endangered species cast a cloud over Nevada’s desired developments. | |||||||||||||||||||||||||||||||||||||
| The greater sage-grouse “is a sagebrush-obligate species whose populations generally track declines in sagebrush” (Coates et al., 2016). The sage-grouse’s relationship with sagebrush has led managers to treat sage-grouse as an “indicator” or “umbrella” species for all taxa within the sagebrush ecosystem, though many disagree with this practice claiming “little empirical evidence exists for the utility of single-species approaches…in conservation planning”(Rowland et al., 2006). In 2015 the Obama administration decided not to list sage-grouse as an endangered species, however this was due to the efforts put forth by Nevada and other states within the Greater sage-grouse home range to restore and protect their ecosystems. This was a small victory for the states because they can now manage the land as they wish, but with the caveat that they must continue to prove they are actively trying to protect the species lest the federal government will dictate what they do with their land. Understanding how the landscape has already changed within the past couple decades is invaluable to the state moving forward as they try to navigate future changes while living up to their obligations to wildlife and natural ecosystems. |
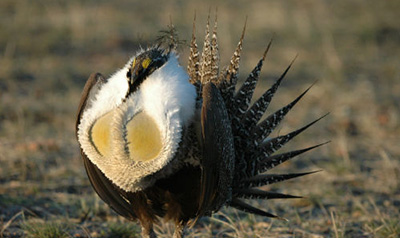
Credit: USFWS. | ||||||||||||||||||||||||||||||||||||
|
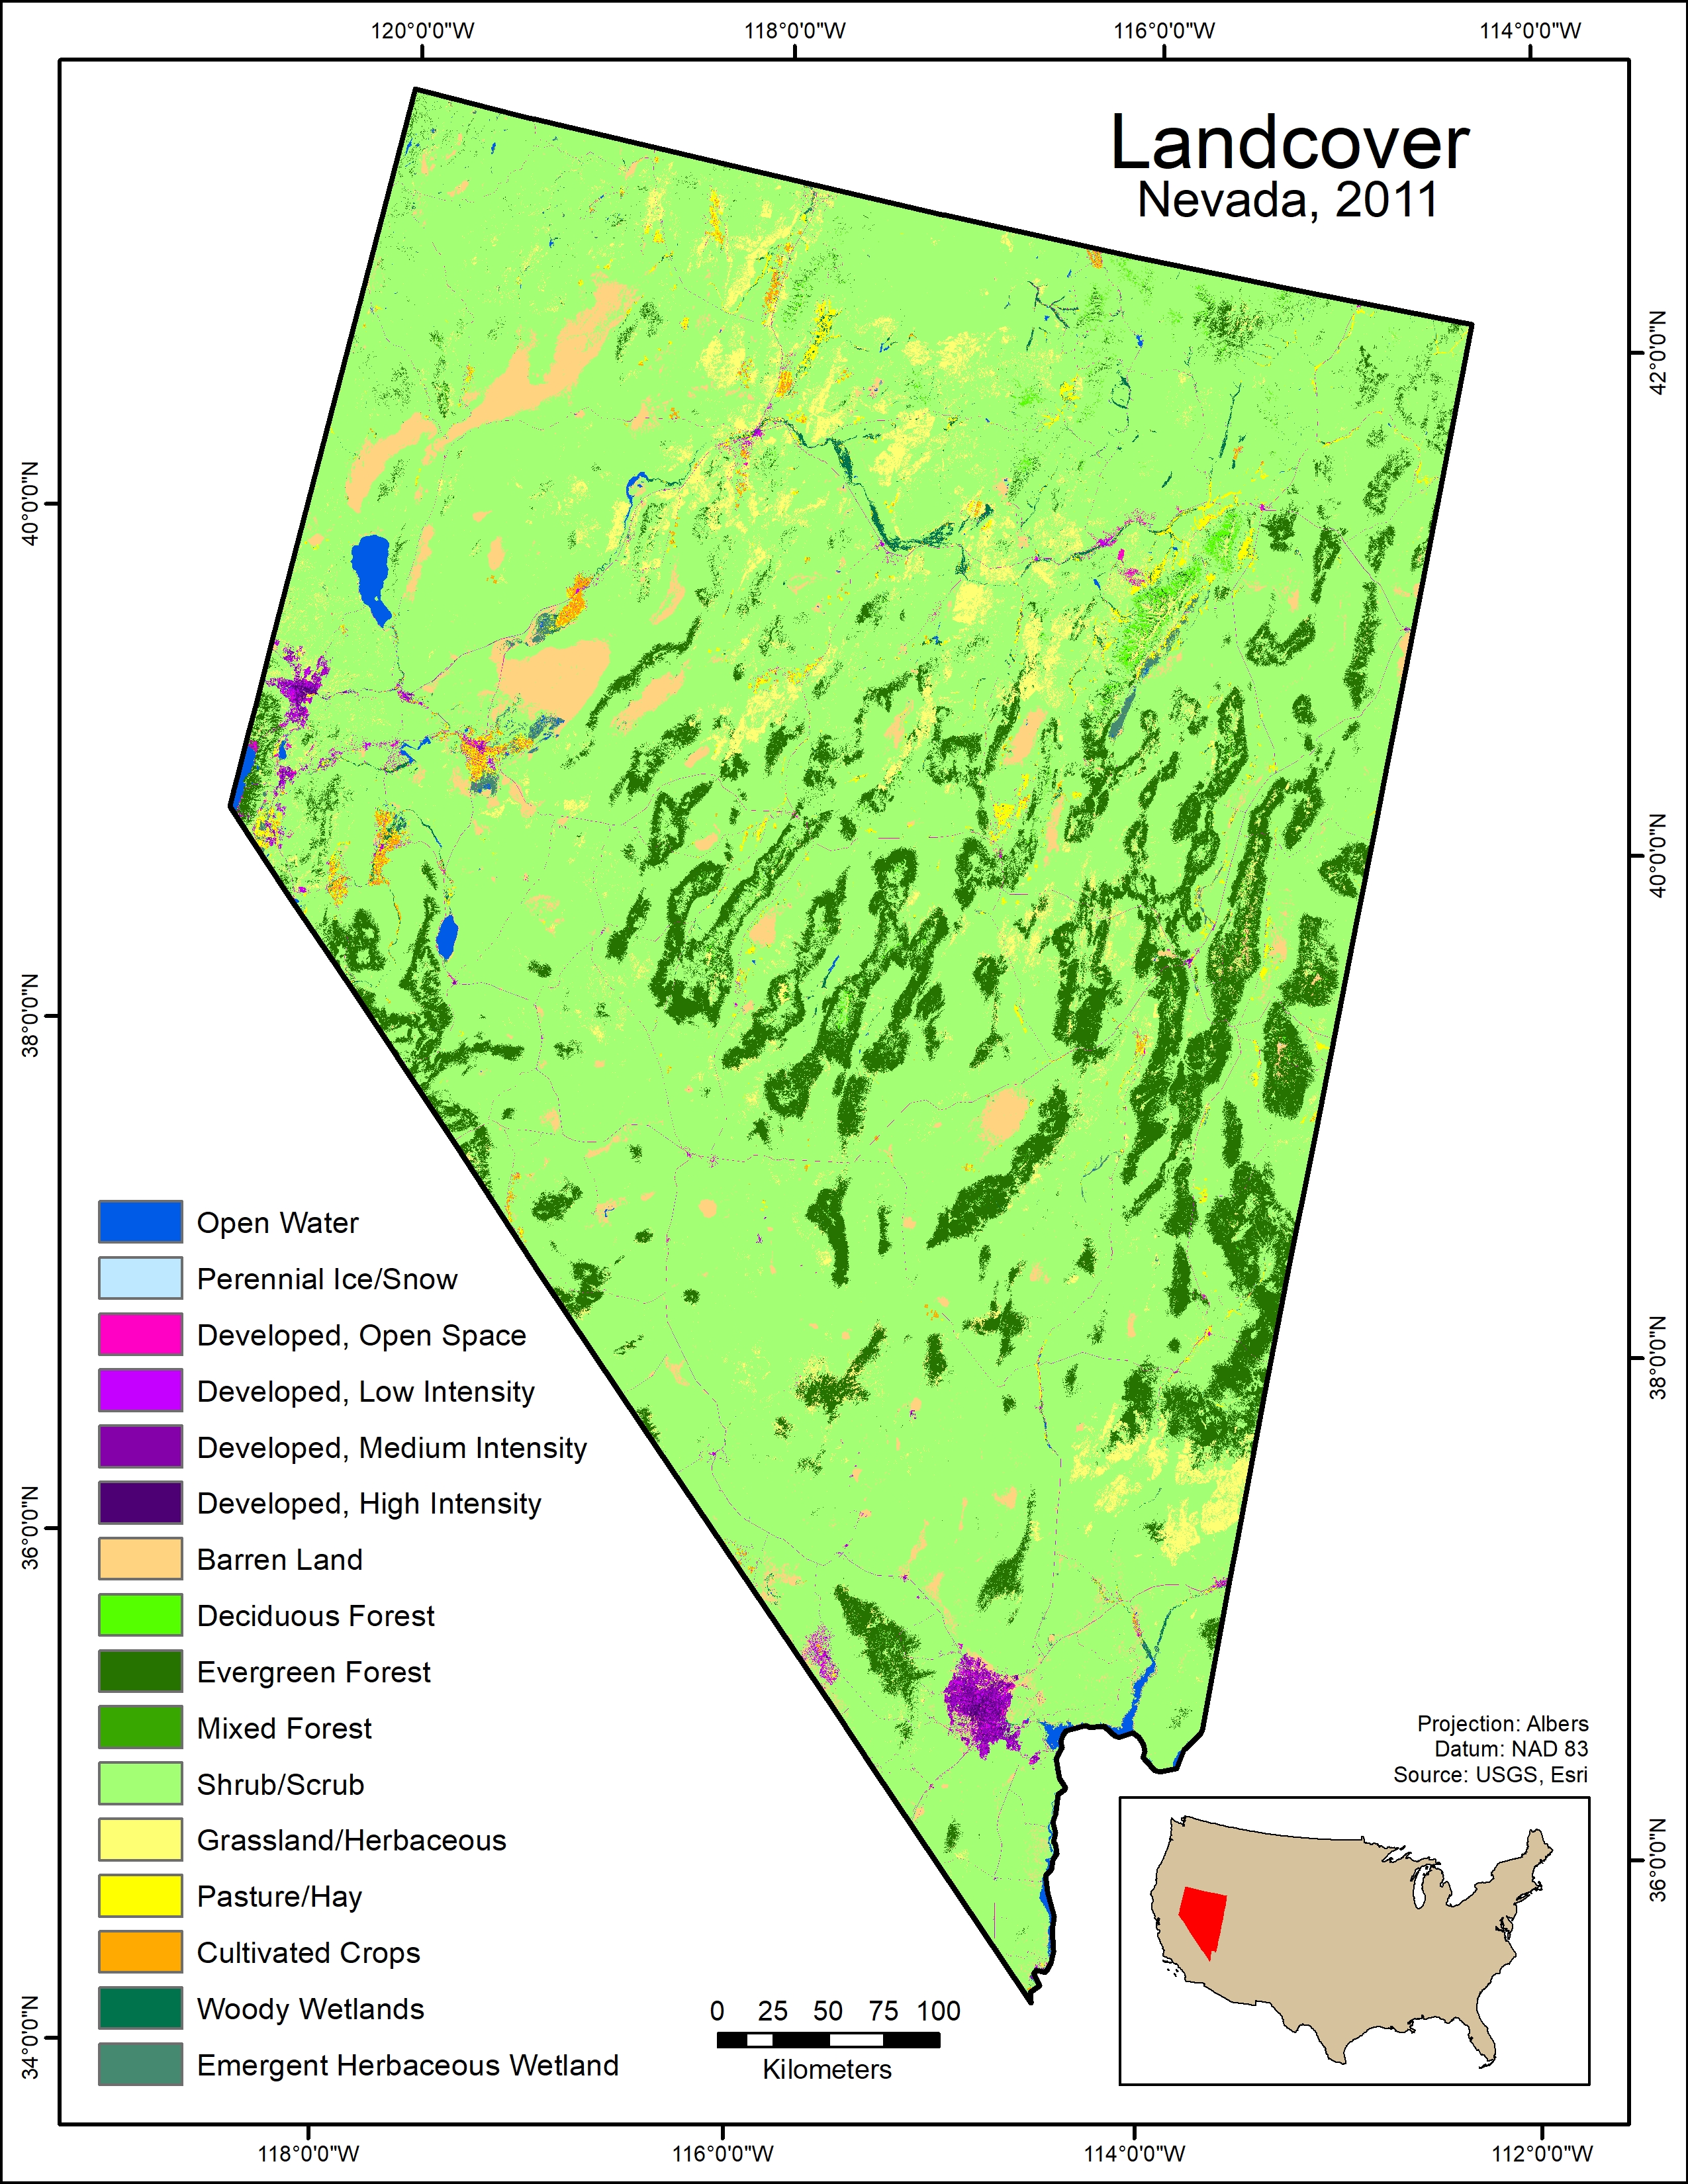
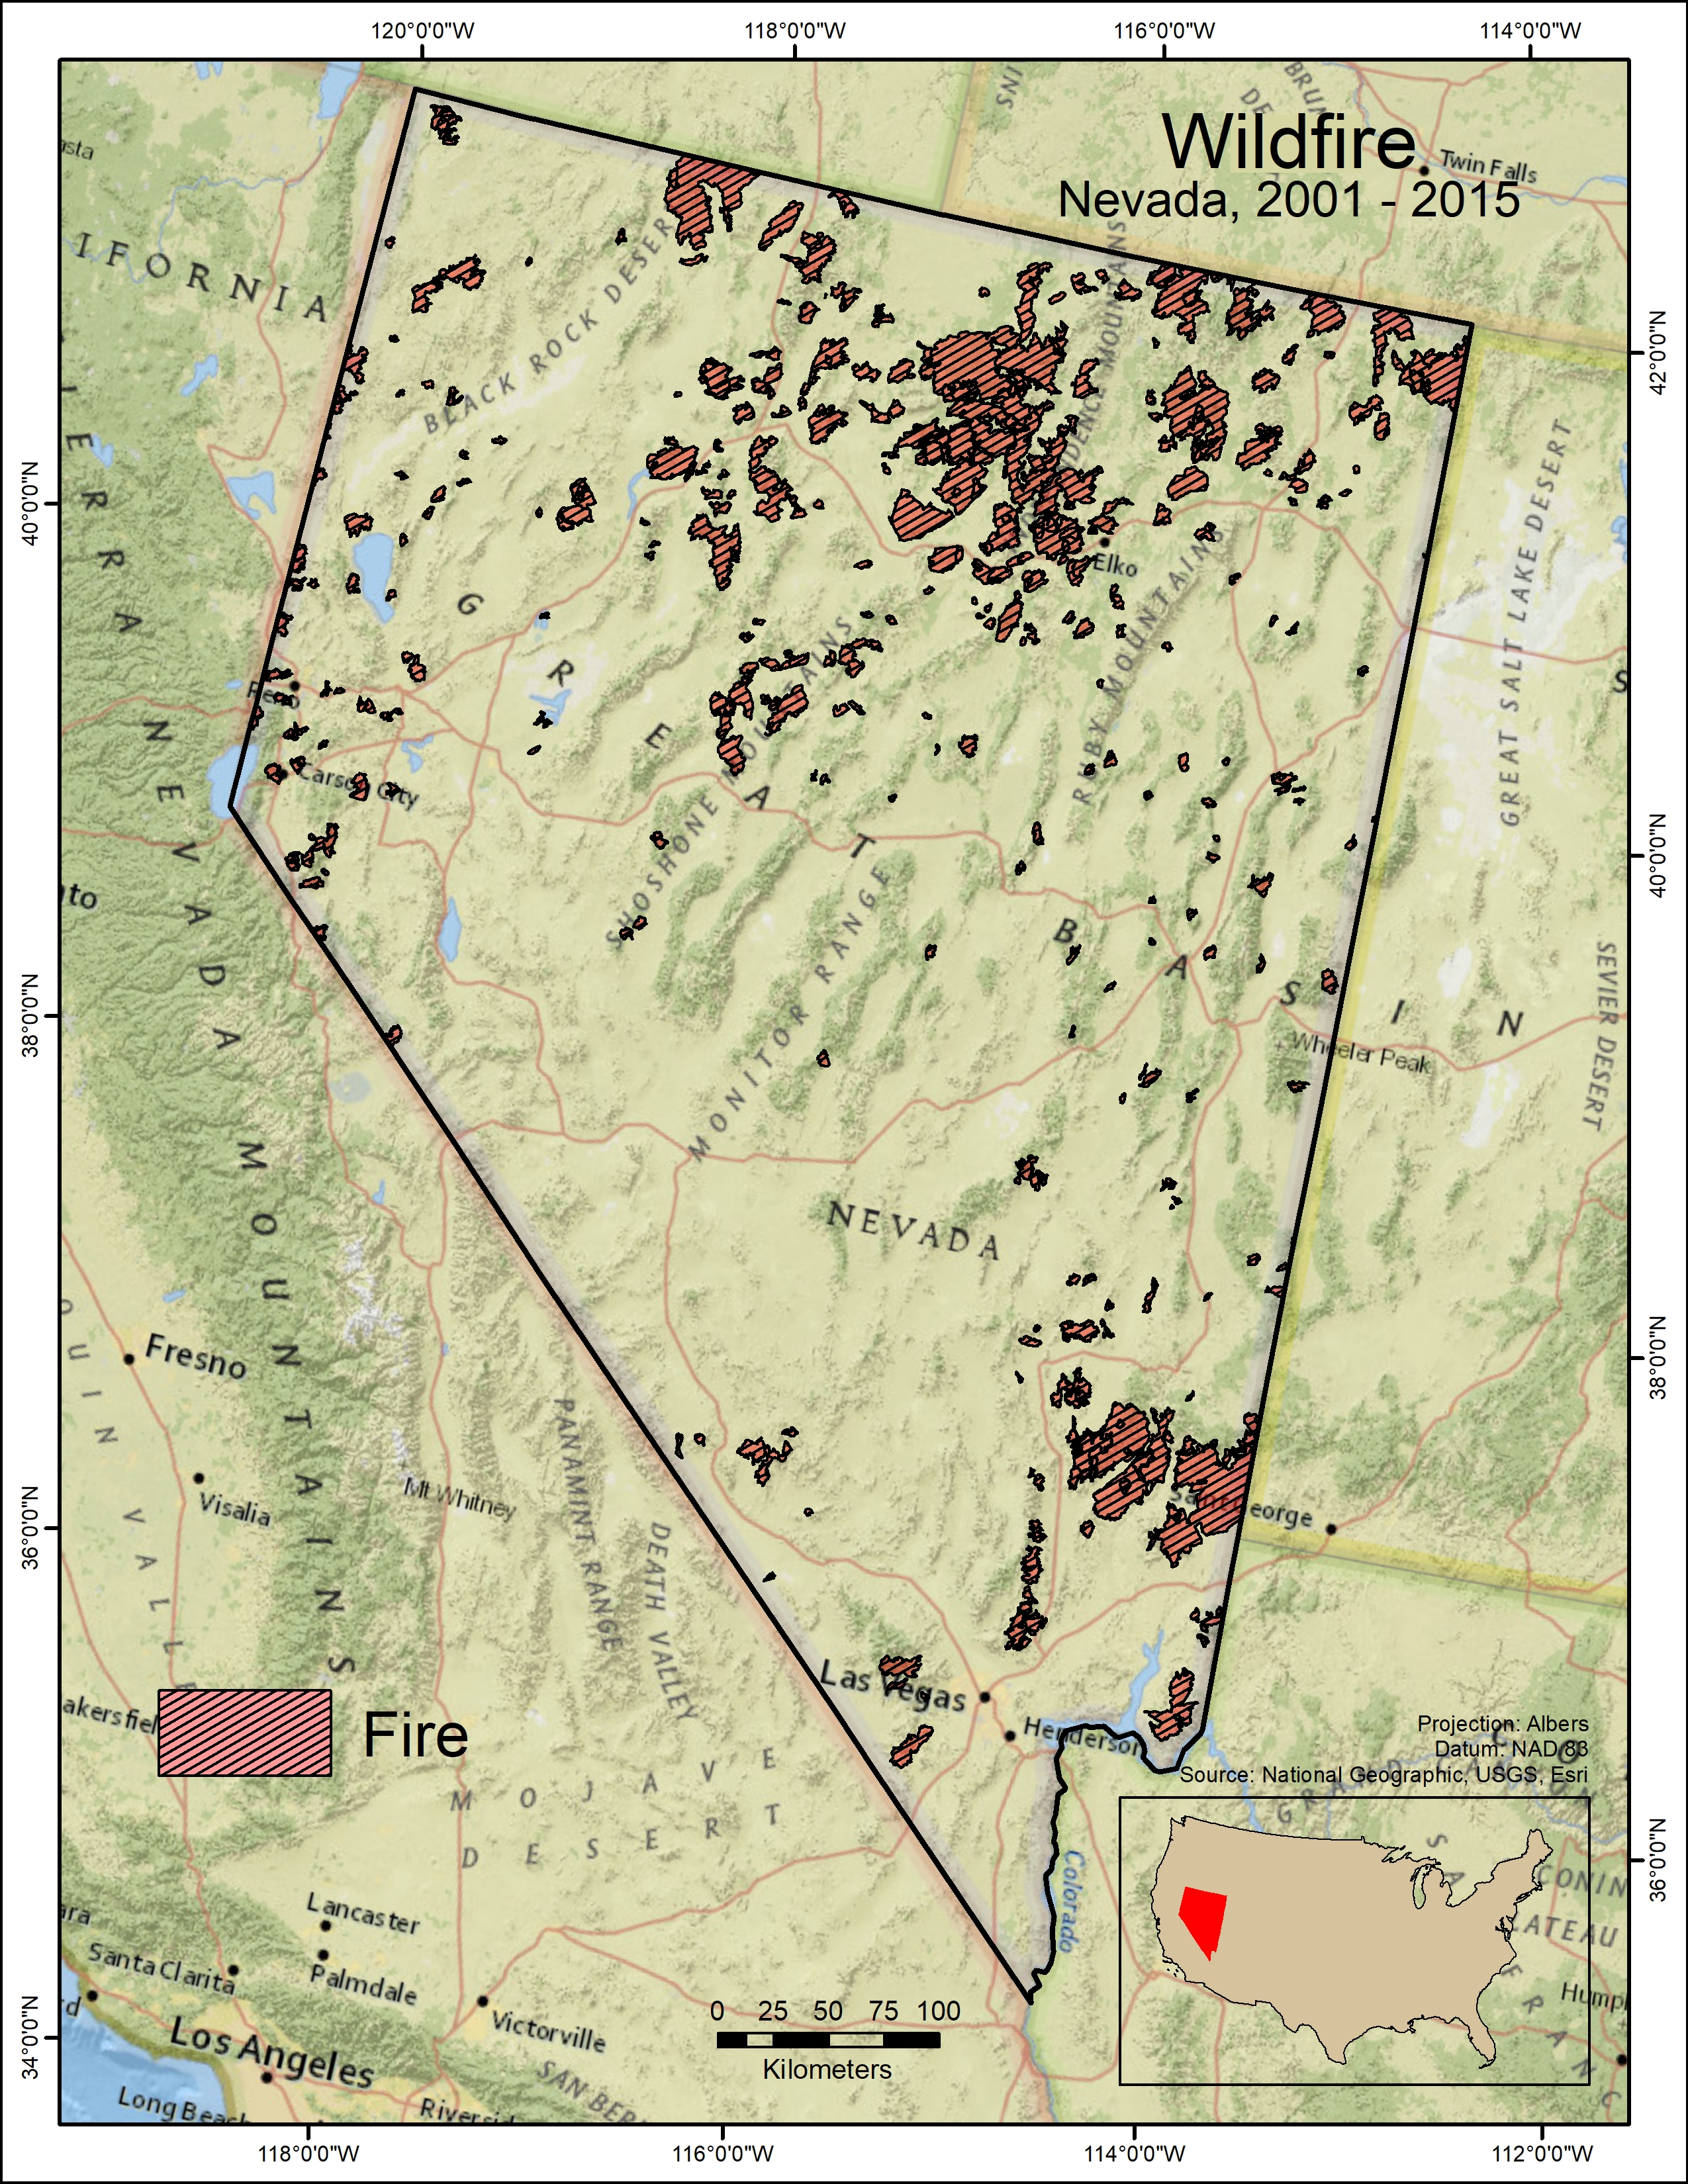
Methods The Albers Equal Area Conic projection for the contiguous United States was used to preserve true area measurements as much as possible. I conducted unit conversions and calculated summary statistics in a spreadsheet after utilizing spatial analysis tools.The ‘Extract by Mask’ tool in the ‘Spatial Analyst’ toolbox was used to clip all layers to the extent of Nevada. Raster attribute tables were exported and a spreadsheet was used to calculate the difference in the count of pixels, separated by land cover type, between the 3 editions of the NLCD products. The count of pixels was then multiplied by the area of 1 pixel to determine the total areal decrease or increase of a land cover type (Table 1). The ‘Extract by Mask’ tool in the ‘Spatial Analyst’ toolbox was used to clip the 2001 version of the NLCD product by the MTBS fire perimeters from years 2001 to 2015. The count of pixels from the resultant raster were then multiplied by the area of 1 pixel to determine the total area of a land cover type that was subjected to severe wildfires. Figure 2 highlights how fire can affect a plant community and allow another plant community the opportunity to occupy the first plant's historic range. | |||||||||||||||||||||||||||||||||||||
 | |||||||||||||||||||||||||||||||||||||
|
Results Urban expansion resulted in the addition of approximately 47,935 acres of 'developed' land from the year 2001 to 2006, increasing by 5,484 acres more by 2011, resulting in a net increase of 53,420 acres. 4,266,898 acres of shrub and scrub land burned from 2001 through 2015, some of which was likely replaced by cheat grass or other annual herbaceous species which had a net increase of 459,640 acres from 2001 to 2011. Forested areas also suffered due to wildfires, resulting in a 369,729 acre loss over 15 years. | |||||||||||||||||||||||||||||||||||||
| |||||||||||||||||||||||||||||||||||||
|
Maps | |||||||||||||||||||||||||||||||||||||
 |
 |
||||||||||||||||||||||||||||||||||||
|
Analysis Results from this rudimentary of an analysis can be confusing. The data suggests that over a 15 year period 4,266,898 acres of shrubland burned, however the net loss of shrubland over a 10 year period was merely 414,148 acres. Perhaps it is a bit misleading to have calculated the burned area of plant regimes over 15 years and compare that number to the difference in landcover over 10 years; this may be a case of comparing apples to oranges. One may infer from this that 3,852,750 acres burned in the final 5 years, however this is not the case. A likely reason for the order-of-magnitude difference between area burned and area lost is the massive efforts to reseed or plant seedlings of sagebrush in burned areas before annual grasses have a chance to come in and take root. There are also ‘seed banks’ buried in the soil from the natural lifecycle of sagebrush over the years preceding the fire that flourish in the soil enriched by ash. That said, these efforts are not perfect, as shrub communities still did suffer close to a half million acre loss while grasslands had an approximately half million acre increase. If I were to conduct this analysis again I would like to find multiple smaller sites with more fine-scale (temporally and spatially), ground-truthed landcover datasets and calculate the changes over the years for those sites, then compare the results to the regional-scale products used in this analysis to vet their viability as approximations of true landcover. | |||||||||||||||||||||||||||||||||||||
|
Conclusions Changes in landscape are natural and would occur without the aid of anthropomorphic influences, but it is important to know how we change the landscape and at what scale these changes occur in addition to how the environment changes on its own. That said it is also important to have an abundance of data and to have a good understanding of that data before acting. The USGS is currently producing the 2016 NLCD product, so when that is published it will be interesting to see if the 5-year-rate-of-change is static or dynamic across the 4 datasets representing 15 years of landcover. The best we can do for now is to continue to collect and analyze data and be conscious of the fact that we do have an effect on our surrounding environments. Whether or not those effects will be a benefit or detriment to humans in the long-term will remain a topic for debate ad infinitum. | |||||||||||||||||||||||||||||||||||||
|
References Coates, P.S., Ricca, M.A., Prochazka, B.G., Brooks, M.L., Doherty, K.E., Kroger, T., Blomberg, E.J., Hagen, C.A., and Casazza, M.L., 2016. Wildfire, climate, and invasive grass interactions negatively impact an indicator species by reshaping sagebrush ecosystems. Proceedings of the National Academy of Sciences, 113(48): 12745-12750. doi: 10.1073/pnas.1606898113 Homer, C.G., Dewitz, J.A., Yang, L., Jin, S., Danielson, P., Xian, G., Coulston, J., Herold, N.D., Wickham, J.D., and Megown, K., 2015, Completion of the 2011 National Land Cover Database for the conterminous United States-Representing a decade of land cover change information. Photogrammetric Engineering and Remote Sensing, v. 81, no. 5, p. 345-354. Rowland, M.M., Wisdom, M.J., Suring, L.H., and Meinke, C.W., 2006. Greater sage-grouse as an umbrella species for sagebrush-associated vertebrates. Biological Conservation, 129: 323-335. doi:10.1016/j.biocon.2005.10.048 USDA Forest Service and U.S. Geological Survey, 2017. MTBS Data Access: Fire Level Geospatial Data. Monitoring Trends in Burn Severity | |||||||||||||||||||||||||||||||||||||