| Title City of Elk Grove Land Cover | ||||||||||||||||
|
Author Kimberly Meador American River College, Geography 350: Data Acquisition in GIS; Fall 2017 Contact Information (8456 Crystla Walk Cir 95758, phone 916-501-5426, email: kimberlym916@gmail.com) | ||||||||||||||||
|
Abstract This project will examine the land cover changes in Sacramento county during the years of 2009 and 2016. For the area of interest, a supervised classification will be processed for two different years to compare the changes in land cover types. The idea is to show how slow or fast urban development is happening. | ||||||||||||||||
|
Introduction The idea I had for this project was to compare the land cover areas in Elk Grove from the 1990’s to 2016. However, the earliest Remote Sensing years I could find was 2005, but it did not meet the criteria for classification, so I used 2009 to 2016 National Agriculture Imagery Program (NAIP) imagery to accomplish these tasks. The imagery will be classified for 2009 and 2016 and compared for each land cover category. | ||||||||||||||||
|
Background Elk Grove has one of the nation’s fastest growing economies, according to a new survey conducted by the personal finance website, WalletHub.com. "The city is listed in the survey as having the fastest growing economy in California and the 11th fastest growing economy in the nation. And for mid-sized cities of 100,000 to 300,000 residents, Elk Grove has the country’s seventh fastest economy, notes the survey." (Lance Armstrong, Nov 23, 2016). | ||||||||||||||||
|
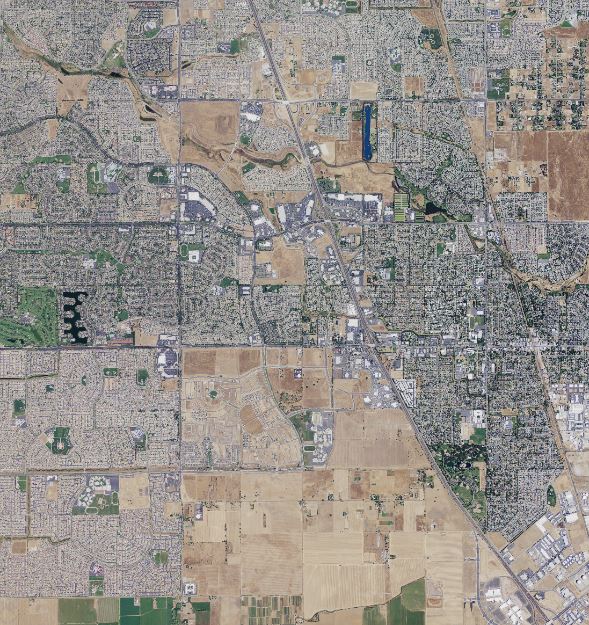
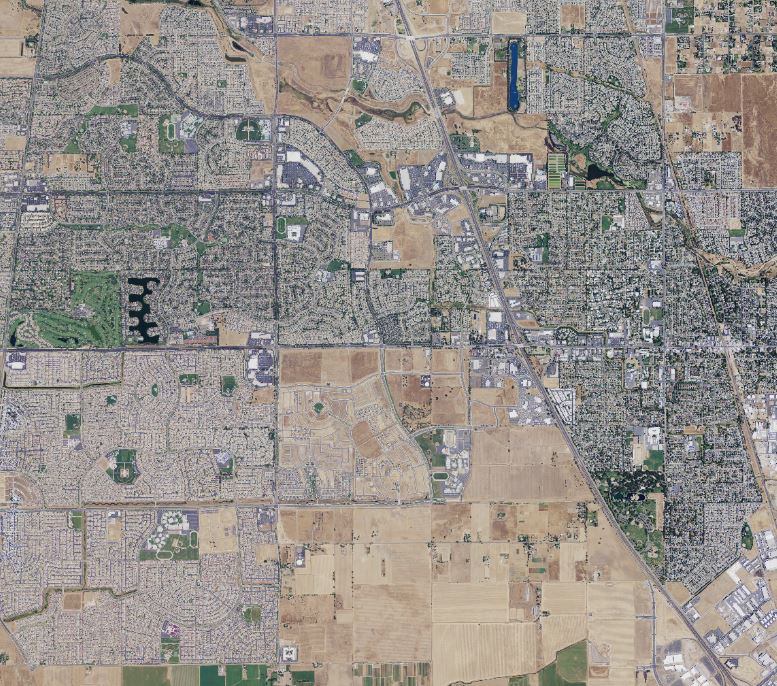
Methods Sacramento County imagery NAIP was downloaded from wildlife.ca.gov.com. I chose Elk Grove to evaluate the change in land cover for the years 2009 and 2016. By inspection there was not a great deal in change of land cover but enough for a small sample. 2009 is on the left and 2016 is on the right for all images throughout. | ||||||||||||||||
| 
| |||||||||||||||
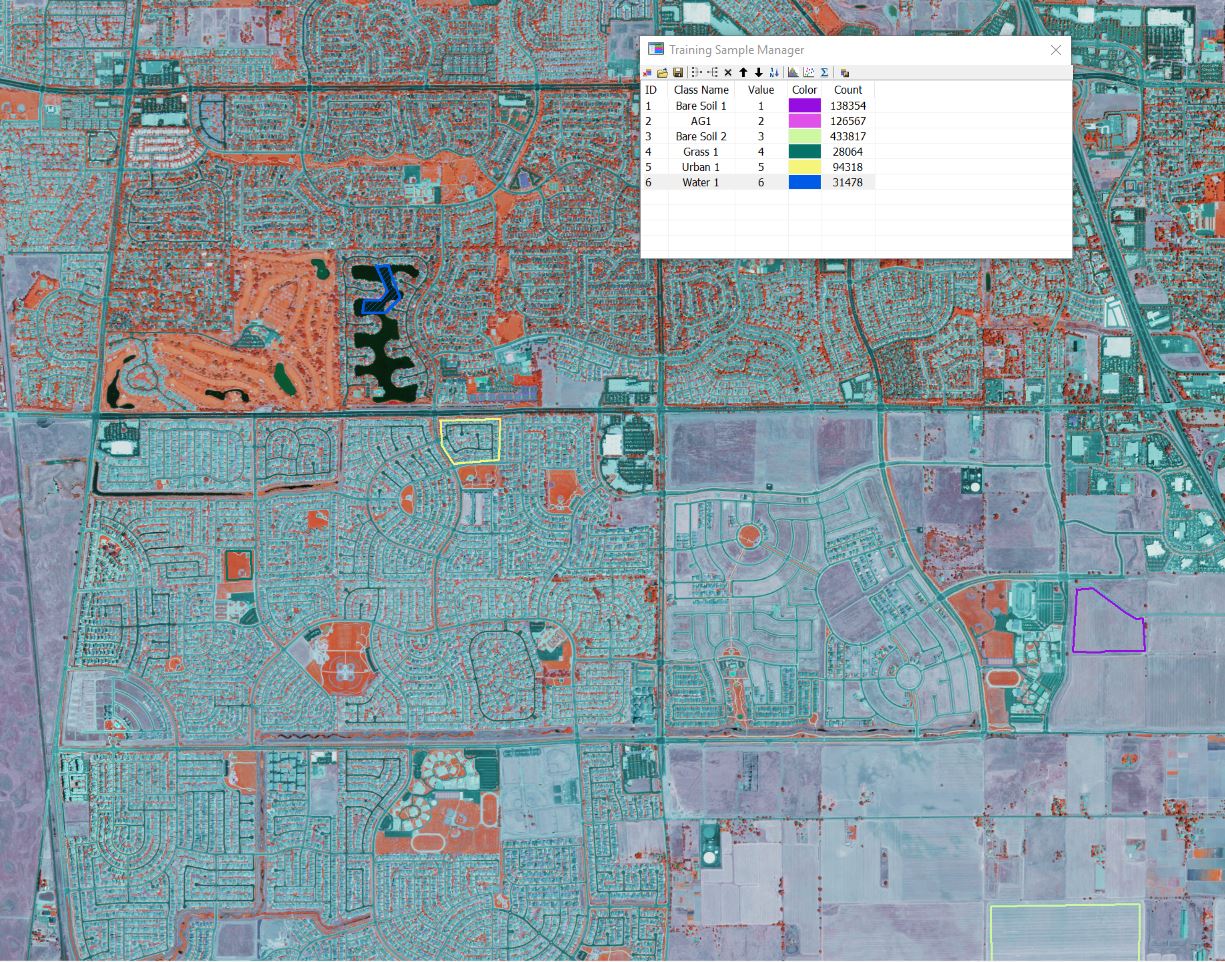
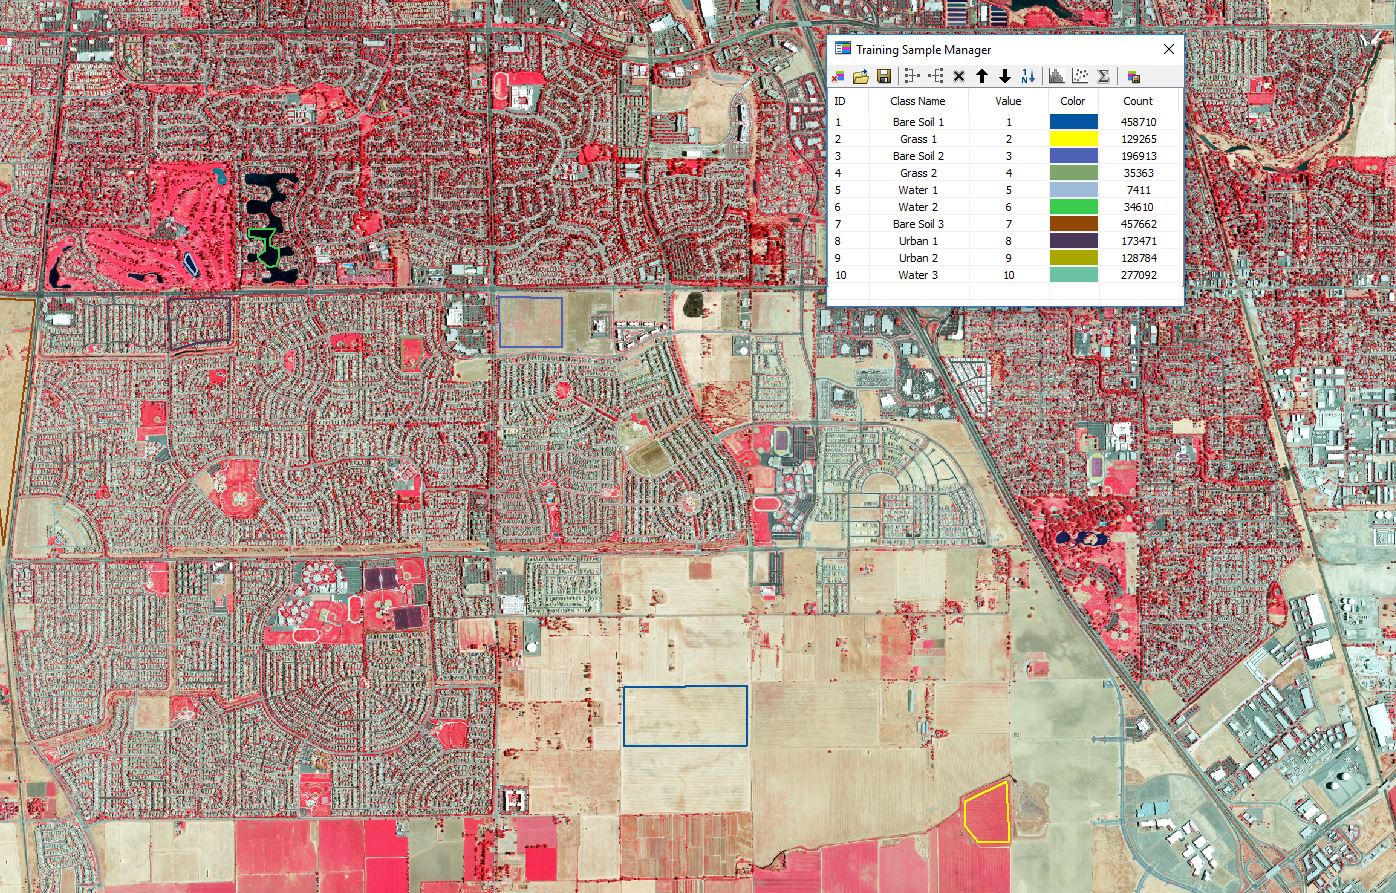
| To start I needed to create a spectral signature, training sites for classification. Each training site had a unique color and classification. Shown below. |
|
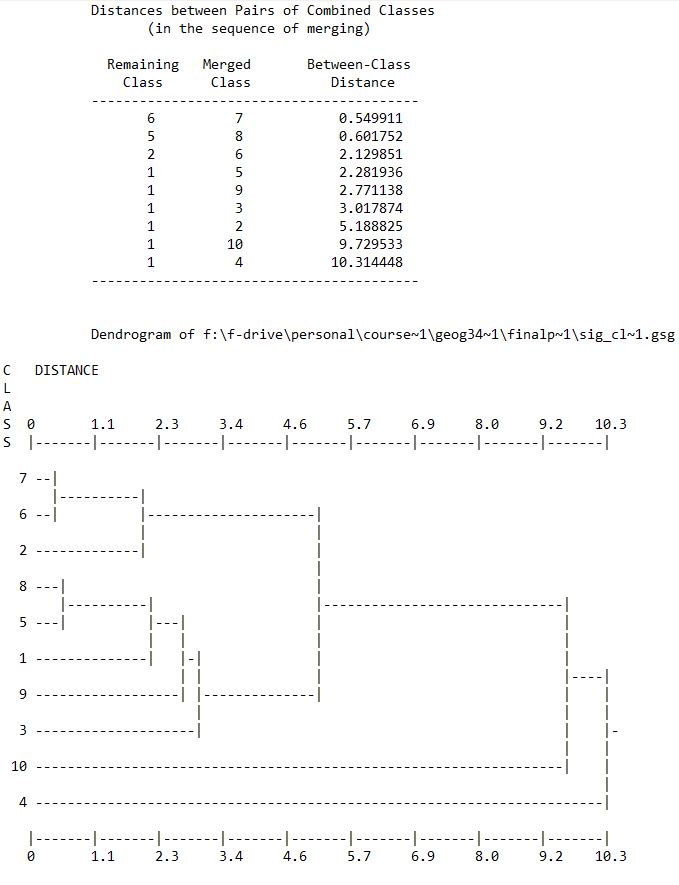
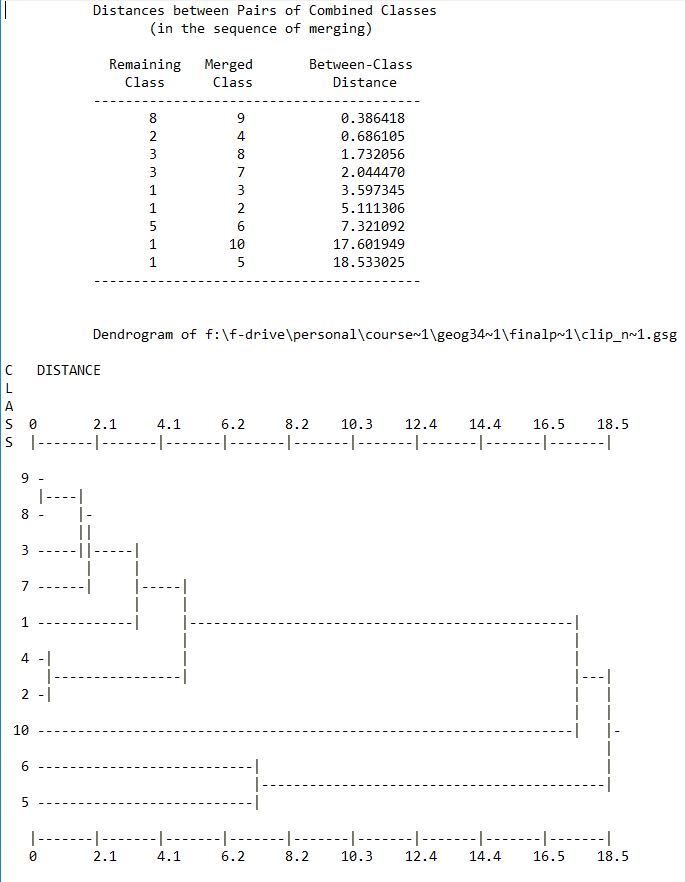
Once all spectral signatures have been created and individually evaluated, an entire
set of spectral signatures can be evaluated by using the Dendrogram Tool. The dendrogram output is a
listing of the spectral classes that note the similarity distance between spectral class pairs.
The small numbers represent spectral signatures that are more similar and larger values less similarity.
|
| 
|
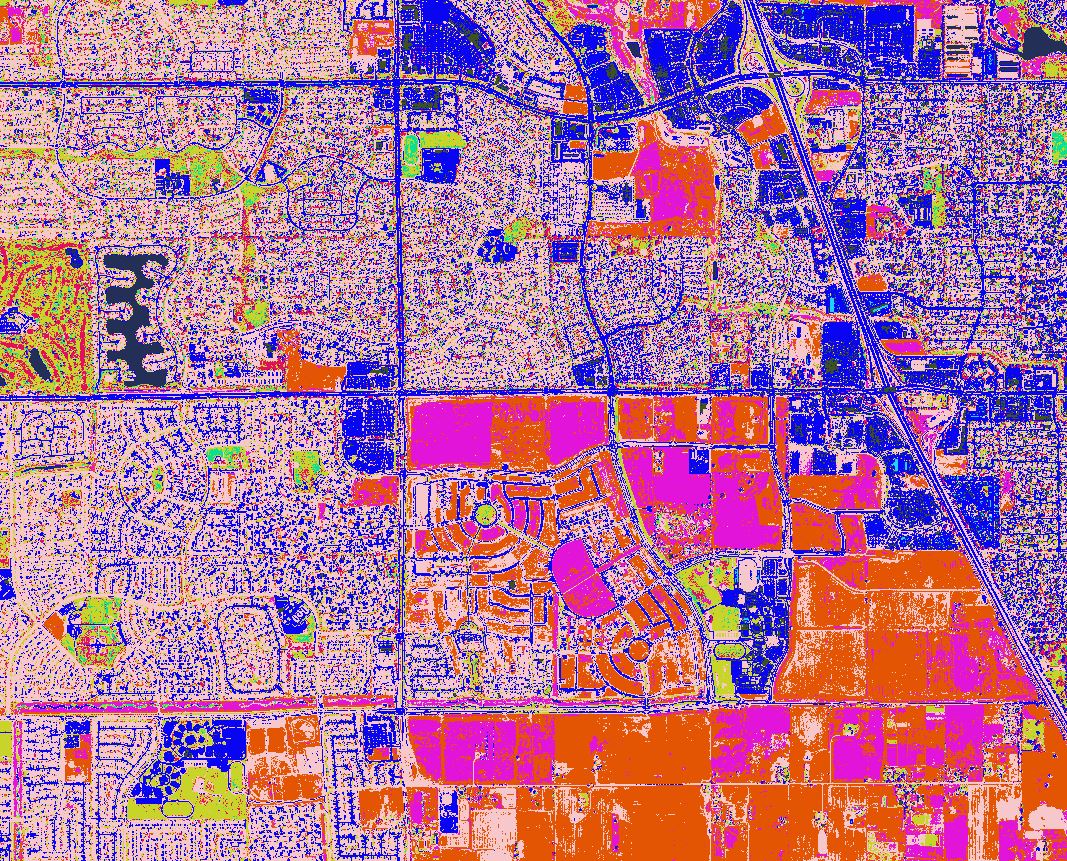
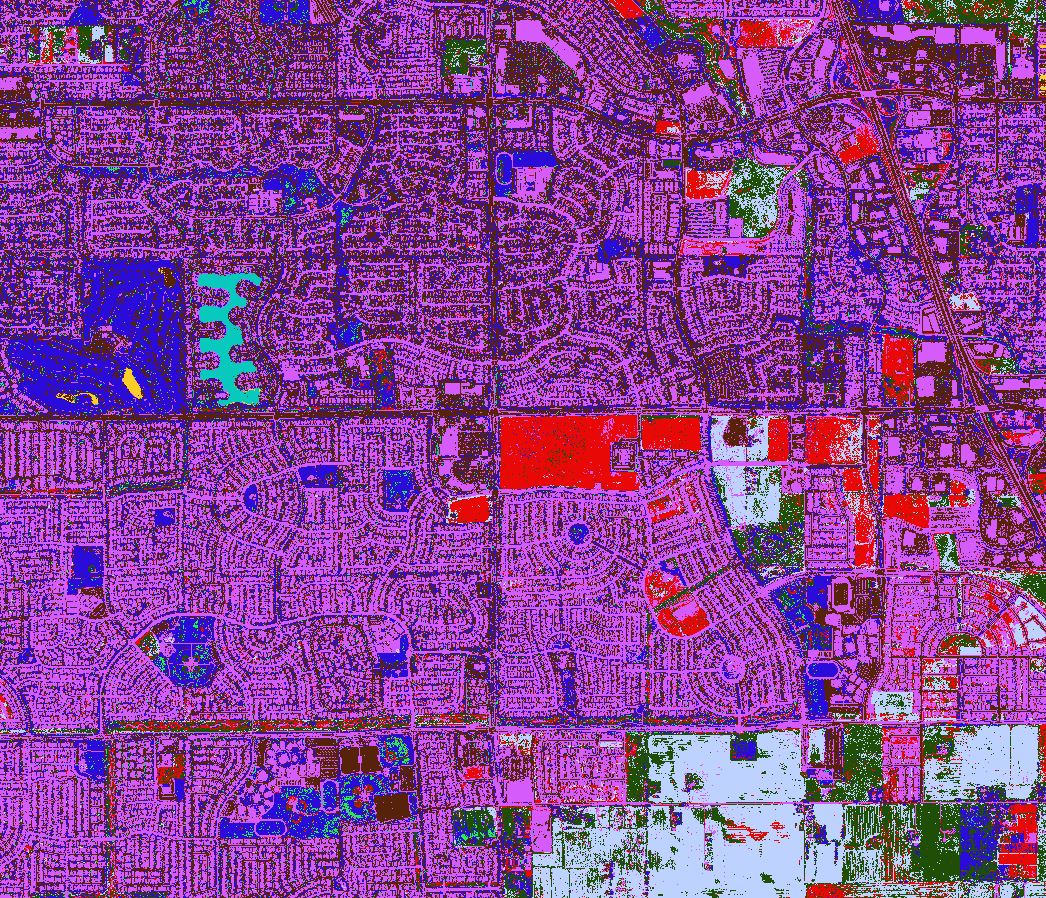
Next, after the spectral signature file was created and evaluated the next step is to
create a Maximum Likelihood Classification image. Each output image contained 10 classifications that
represent spectral classes.
|
| 
|
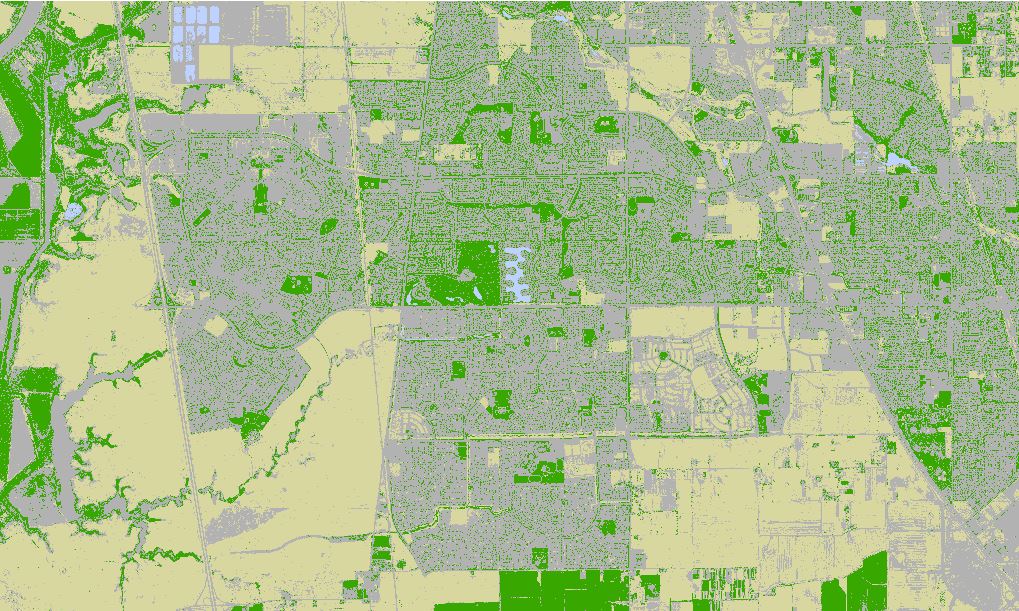
The next step is to reclassify the spectral class to informational land cover type.
Four land cover types were used bare soil, grass, urban and water.
The color scheme tan for bare soil, green for grass, gray for urban and blue for water.
|
| 
|
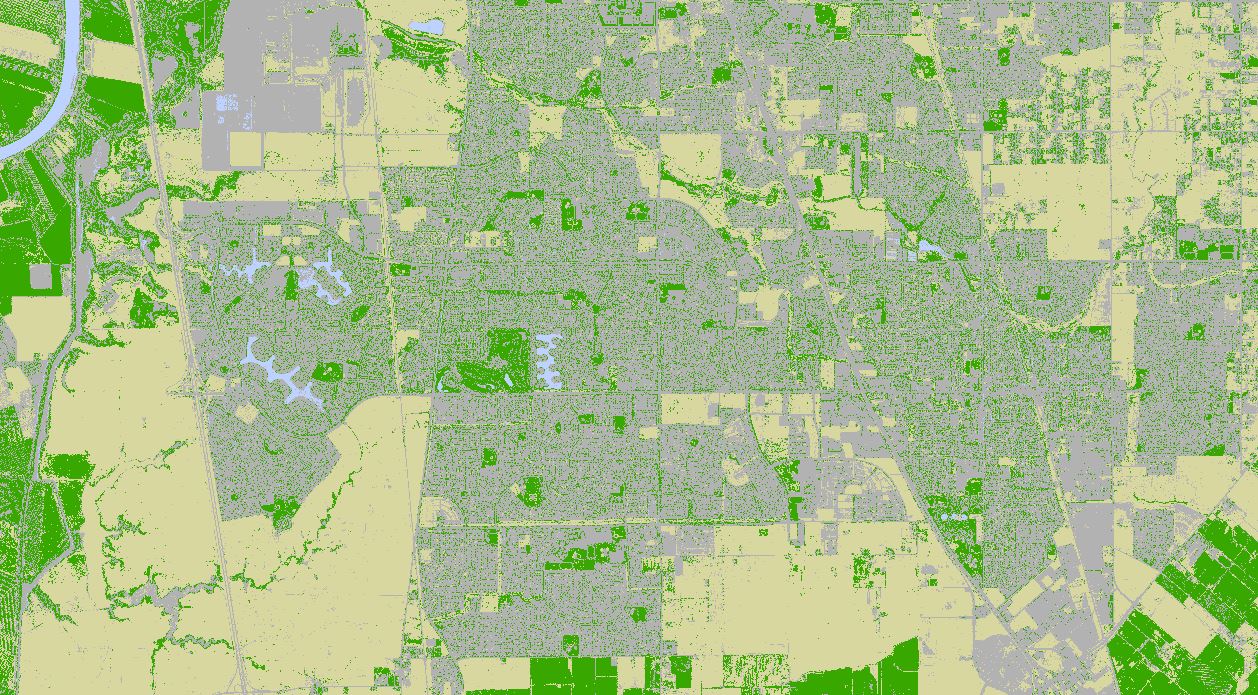
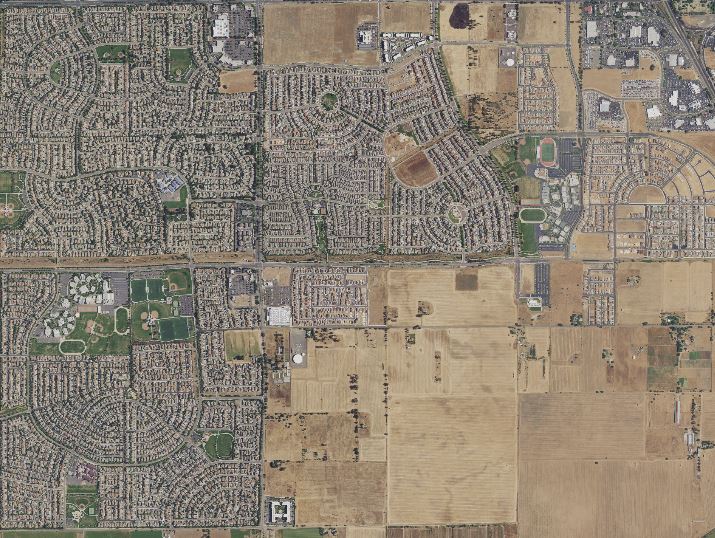
| Results Land cover change between the 2009 and 2016 shows a 4% decrease in the urban development based on the table which I know have errors due to not enough spectral signatures in the training samples. Analyzing the images, the differences were not obvious, but I can see where the increase of urban development was in 2016. Below is an area where the increase occured.
|
| 
| Analysis Some of the areas I was familiar with, so I was able to classify correctly but other areas not so much. But I can see that some areas were classified as urban which should have been water or bare soil these areas had dark shadows surrounding it. I found supervised classification process very educational but I’m curious to know if I had better images and familiar with the entire area how accurate this process would be or what it would really look like.
| Conclusions The land cover change in Elk Grove can be visibly seen in certain areas but performing a supervised classification and reclassification it confirms the changes in land cover whether it’s an increase or decrease.
| References "ElK Grove Citizen" Lance Armstrong, Nov 23, 2016 www.egcitizen.com https://www.wildlife.ca.gov/Data/GIS/Map-Services |