| Title Spatial overlap of neonicotinoid pesticide use and bee foraging agricultural land in the California Central Valley | |||
|
Author Courtney Runyan American River College, Geography 350: Data Acquisition in GIS; Fall 2017 Contact Information (Courtneyarunyan@gmail.com) | |||
|
Abstract This paper seeks to investigate the overlap between bee friendly agricultural crops and pesticide use in the California Central Valley. There was no conclusive evidence that a land use shift away from bee friendly crops was occurring in the Central Valley. However, there was an overall increase in neonicotinoid pesticide use, both in amount applied and in treatment area. There was also an overall increase in the area of bee foraging crops that fell within one mile of a neonicotinoid application. These findings could help to explain the declining health of bees in the California Central Valley. | |||
|
Introduction Honey bees are dying off rapidly in America, and nobody can agree on why. Because of the importance of pollinators to agriculture, it is vital that a decision is reached on how best to stop the decline of bees. Honey bees provide pollination services to most of the fruits and vegetables that we eat, boosting agriculture production in America by about 15 billion dollars annually. They are particularly important to California agriculture, supporting the almond industry among other essential crop industries. But pollinators, both domesticated honey bees and native wild bees, have been declining at an alarming rate, with beekeepers reporting annual hive losses of over 30% (USGS, 2016). Some sources cite a shift in land use, with agricultural land and other bee friendly habitat decreasing in recent years. Nationally, croplands have been shifting from bee pollinated crops to corn and soybeans, which are not bee pollinated (Otto et al., 2016). Other sources claim that pesticide use is the cause of the decline, especially neonicotinoids (Tosi et al., 2017). The argument against pesticides is hotly debated, and finding a compromise between growers and regulators is of huge importance for protecting not only people but also our wildlife. This paper seeks to investigate these viewpoints as they relate to California agriculture by assembling and analyzing the available data on agricultural pesticide use, land use changes, domestic bee foraging land, and other relevant factors. Specifically, this project will map the land-use and historic land-use of the California Central Valley to see if a shift to less bee friendly crops has occurred. This will be overlaid with the pesticide use and historic pesticide use of a few key harmful pesticides (within the neonicotinoid class) to see if there have been any changes in suitable habitat for honey bees. The spatial component of these factors has not been presented, and should be informative to best protect California bees. | |||
|
Background Insect pollinators provide us with a valuable service, so valuable that one-third of the food we eat was made possible by a pollinator, and they increase crop values in America by over $15 billion dollars every year (USGS, 2016). However, the number of managed agricultural hives has been decreasing steadily, with a 50 percent decrease in managed hives since the 50s and a 30 percent decrease in recent years alone (USGS, 2016). There are a few factors that are thought to cause this decrease in honey bee numbers, as well as native pollinators, which also play an important role in agriculture. These factors include disease, parasites, land use shifts causing habitat loss, and pesticide exposure. Pesticide exposure and land use changes are often driven by changing markets, with markets shifting to crops that need less pollination but more pesticide (Otto et al., 2016). This loss of habitat and plant diversity has a negative impact on bee health because they need a diverse diet to remain healthy (USGS, 2016). Many agricultural hives come from the Northern Great Plains area of the U.S., where they are raised in large apiaries and forage over winter. They are then shipped to fields across the U.S. to provide pollination services to important crops, including California almonds. While the apiaries of the Northern Great Plains are where honey bees are raised, the time they spend in California is also hugely important to bee survival, since the bees are overwintering in California and much spreading of disease and bee loss happens during this time (Glenny et al., 2017). Despite this, there is little research available on how these factors interact spatially, or where the risks to honey bees in California are most concentrated. Otto et al. (2016) recently published a paper investigating how land use change in the Northern Great Plains region might impact available space for apiaries there. They found that there was a significant increase in biofuel crops (such as corn or soybeans), which are not bee pollinated and may need more pesticide applications than the more bee friendly agricultural products grown there (Otto et al., 2016). They described this shift as having a “dual impact on bee health” because of this, and stated that these changes are often driven by an increased market price for biofuel crops (Otto et al., 2016). This paper will first set out to investigate whether the same land use shifts can be observed in the California Central Valley, the economic center of California agriculture, and if they can sufficiently explain the declining trend in bee numbers. Another factor affecting bee health in California is the application of pesticides that are toxic to bees. One of the biggest offenders in this area are a class of pesticides called neonicotinoids, a commonly applied pesticide in California, and among the most widely used in the world (Bonmatin et al., 2015). These pesticides are environmentally persistent, meaning they resist degradation through chemical or organic means. They accumulate in soils and water runoff, as well as in non-target plants, and persistence can be prolonged; half-lives of neonicotinoids in soil can be longer than 1,000 days. (Bonmatin et al., 2015). They are likely finding their way to the pollinators as well, since studies of food stores in honeybee colonies from around the world demonstrate that colonies are routinely and chronically exposed to neonicotinoids in the 1–100 ppb range (Bonmatin et al., 2015). In a study done by Tosi et al. (2017), they found that with a concentration of 15ppb in nectar of bee foraging plants, an hour of foraging exposed bees to enough of the pesticide thiamethoxam to cause symptoms. The deleterious effects of neonicotinoid exposure in bees has been well documented. While death is the most extreme symptom of exposure, many studies have demonstrated that even sub-lethal doses of the pesticides can reduce return rates to the nest and impair navigation (Tosi et al., 2017). Tosi et al. (2017) also found that thiamethoxam, when administered in both acute and in chronic doses, was sufficient alone to alter the flight ability of bees. They also noted that the toxic byproduct of thiamethoxam, called clothiandin, may also have a deleterious effect on bee flight (Tosi et al., 2017). Similar studies have also shown a similar effect of neonicotinoids on bumblebees (Tosi et al., 2017), which are another vital pollinator resource to California. The harmful and persistent nature of this class of pesticides made it the focus of the second part of this study, which will examine whether the use of this class of pesticides is increasing or decreasing in California, and investigate whether any land use shifts are occurring within range of these pesticide applications. The aim is to determine if there is an overall decrease in neonicotinoid-free forage land in the California Central Valley, which could help to explain why bee mortality is high in California agriculture. | |||
|
Methods This analysis was broken into three parts: Land use changes, neonicotinoid pesticide use changes, and bee foraging crop overlap with pesticide use comparisons. First, pesticide use data was queried from the department of pesticide regulation’s pesticide information portal, and the sections shapefile downloaded from the DPR website. Each polygon is approximately 1 mile across. Land use data was then downloaded from the USDA, National Agricultural Statistics Service, California Cropland Data Layer website. Images were downloaded as GeoTIFFs, which were then imported into Arcmap. A raster mosaic was used to combine all counties into a single raster, and a raster clip function limited the data to the study area and removed background. The years chosen to investigate was determined by the available data. The earliest available land use TIFFs for the central valley was 2007, and the most recent available pesticide use data available at this time is 2015. Though a more standard time interval or more recent pesticide data may have been more ideal, I decided that the best investigation would come from the largest available time interval to compare data. All data that is being compared comes from these two years. The land use raster dataset was reclassified using the “reclassify” tool, using in part categories determined by Otto et al. (2016), and in part from my own research. Data from 2015 was reclassified as “hundreds” and 2007 data reclassified as “ones”, so that they could be distinguished for change analysis. The pesticide use change analysis used Microsoft Excel to query pesticide use data and summarize it based on the sections and pounds of pesticide applied. Summaries of this data, as well as a “change” table created from matching each section in 2015 with it’s equal in 2007 (using an excel index/match) and subtracting 2007 from 2015, was imported into ArcMap, joined to the sections polygons (keeping only matches), and exported to its own layer. Data was symbolized according to pounds applied (quantile on the 2015 layer) and by change in pounds applied (by standard deviation, which encompassed zero). Reclassified land use layers were then clipped to the resulting pesticide use layers, for each year respectively. This created the change in contaminated bee forage land statistics and maps. The average range of bee foraging used was 1.2 miles (Tosi et al., 2017), so I determined that any bee foraging fields within the 1 mile across polygons would be within foraging range of any application that took place in the same polygons. It did not take into account bee fields in adjacent polygons. | |||
|
Results All results are presented as images of tables. Data from the Cropland layer is represented in square kilometers, whereas CalPIP data is presented as number of sections and pounds applied, because representing them as square miles treated would be misleading. Applications occurring in a section did not spread over the entire section. | |||
 |
|||
 |
|||
 |
|||
|
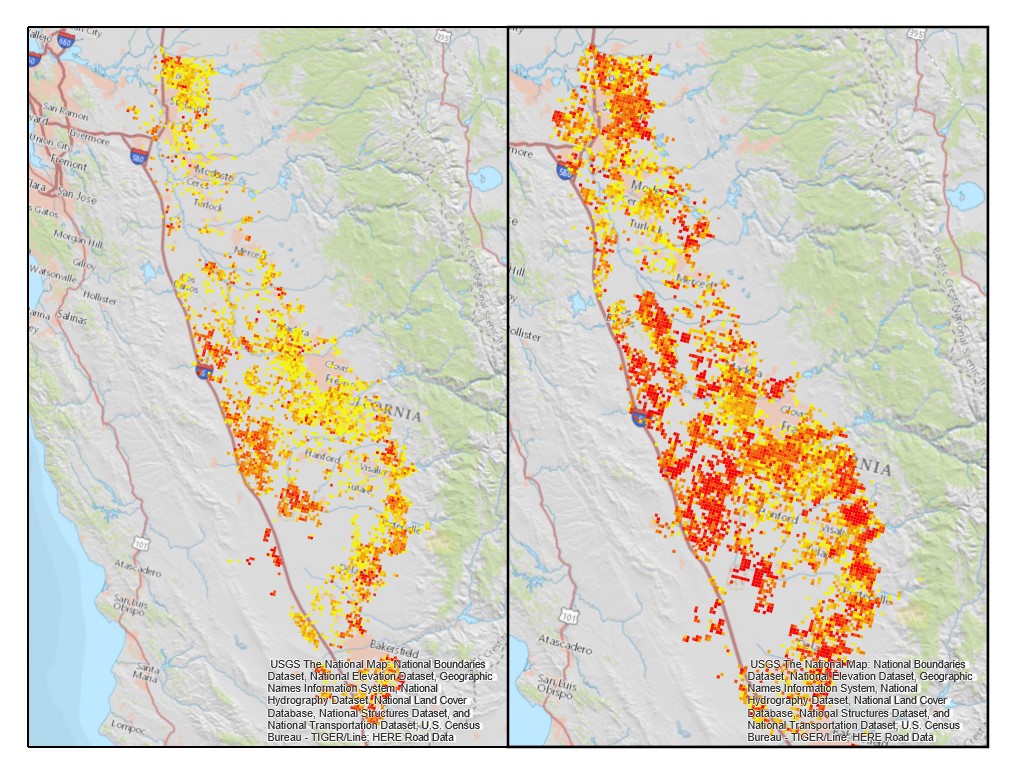
Figures and Maps Figure 1: Sections with Neonicotinoid Pesticide Applications in 2007 (left) and 2015 (right)
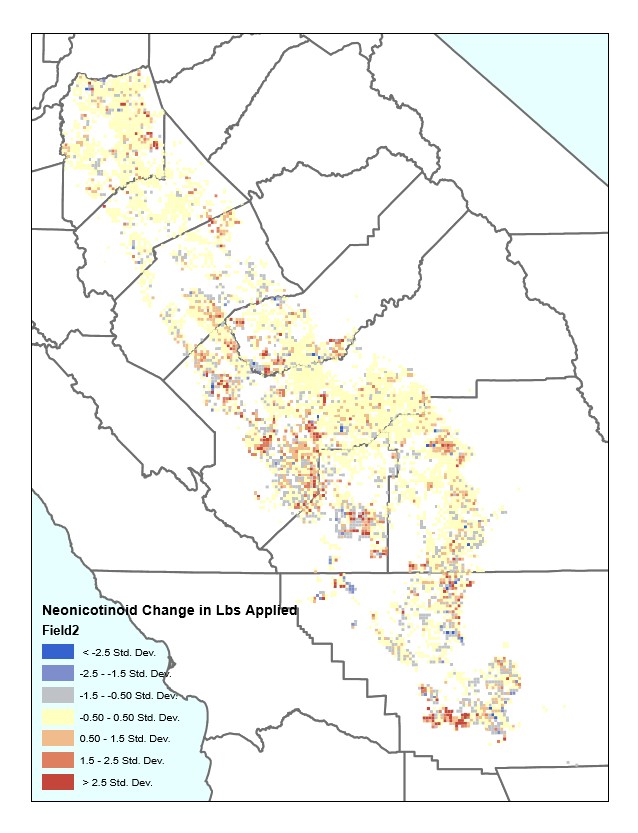
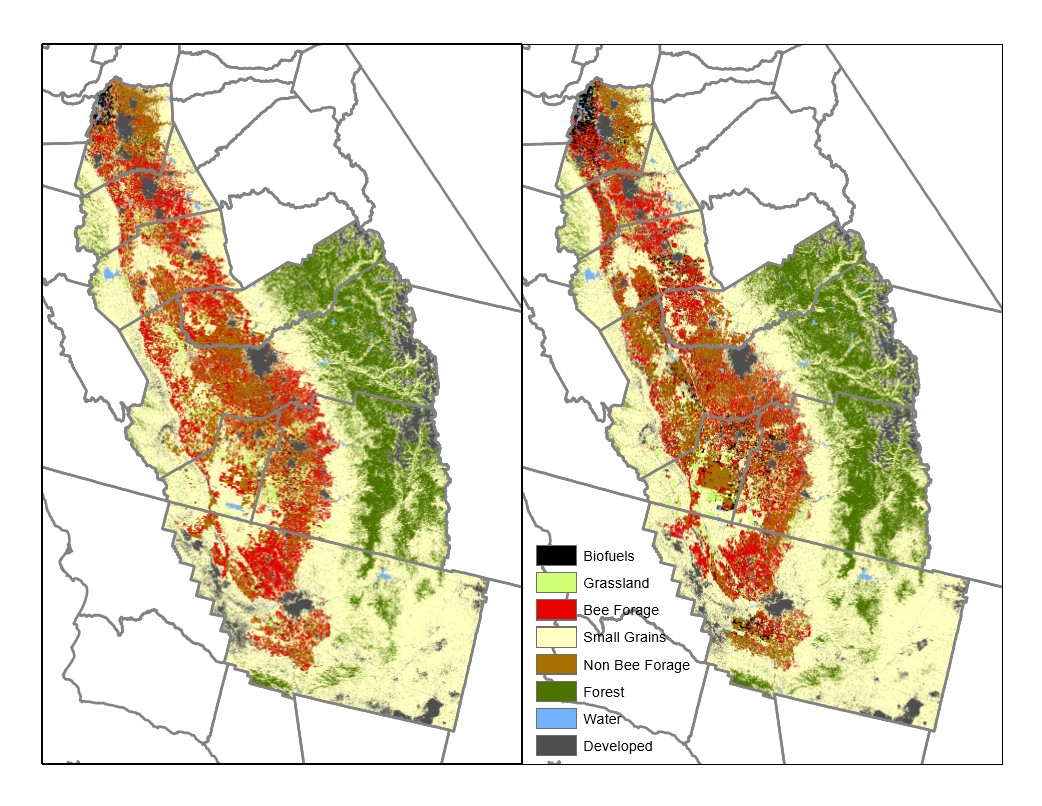
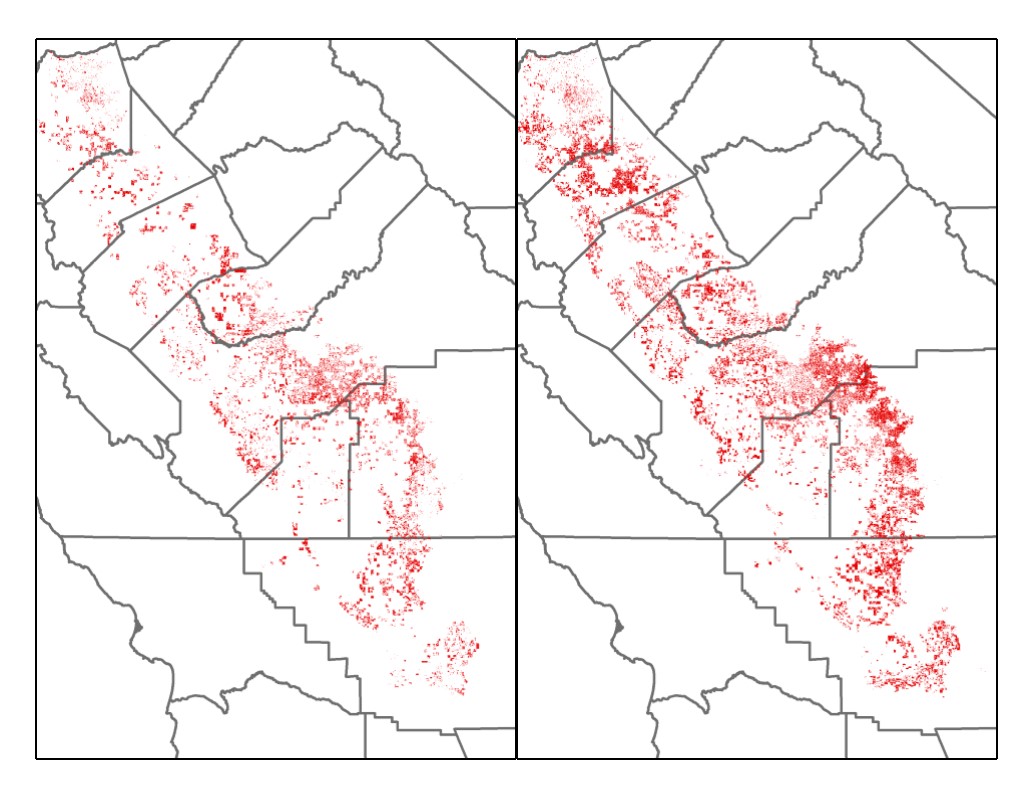
Figure 2: Change in Neonicotinoid Pesticide Use by Section Figure 3: Reclassified Land Use in 2007 (left) and 2015 (right) Figure 4: Bee Forage Agricultural Land Within 1 Mile of Neonicotinoid Treated Land in 2007 (left) and 2015 (right) | |||
 |
|||
 |
|||
 |
|||
 |
|||
|
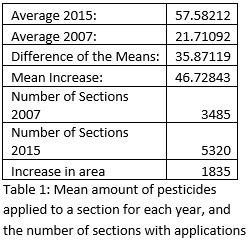
Analysis There was a total increase in both the pounds of neonicotinoid pesticide applied and the treated area. Over all of the Central Valley, there was an increase of 230,704lbs applied and an increase of 1,835 square miles of pesticide treated land. There was an average increase per treated square mile of approximately 35.87 lbs. This is unsurprising, however such a significant increase in neonicotinoid pesticides entering the environment could be detrimental to managed honey bees, since the toxicity of this class of pesticides relies so heavily on dose (Tosi et al., 2017). A larger amount of pesticide entering the environment means more could be persisting in the fields, and bees are getting dosed with larger amounts of pesticide when foraging, which could lead to more bee deaths.
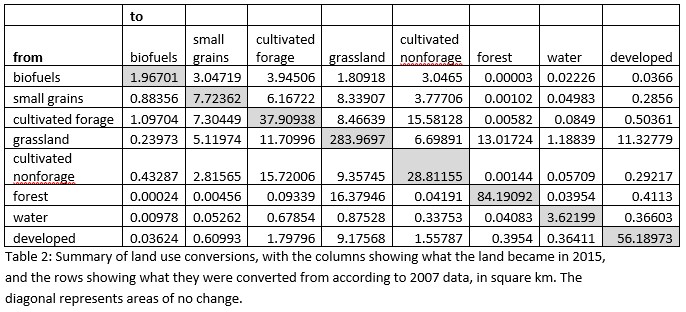
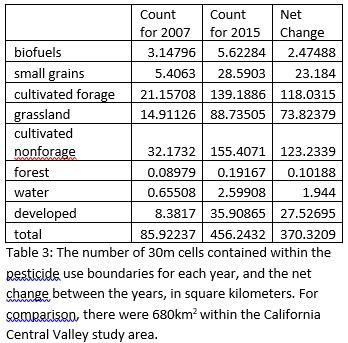
There was a total increase in bee foraging agricultural fields of 234,622 cells. Each cell is 30 square meters, so this represents an increase of 7.069 square kilometers over the central valley. This differed from the findings of Otto et al., which found an overall decrease in bee friendly crops. Of the 175.7km2 of total land use change, there was also a decrease in developed land of .714km2, and a decrease in biofuels of about 9.2km2, which also differed from the explanation provided by Otto et al. (2016). This demonstrates that the shift in land use does not explain a decrease in honey bee numbers. However, given the migratory nature of California bees, this is not surprising. Instead, the decreases in honey bee numbers have been more consistently linked to bee mortality from other factors rather than lack of food. Since the bee foraging agriculture numbers were not sufficient to explain bee loss, further analysis was run. Once this land use data was combined with the pesticide use data, there is a much more significant increase in bee foraging agriculture overlapping with neonicotinoid treated fields. In 2007, there was an overlap of about 21km2, compared to around 139km2 in 2015, meaning a decrease in bee suitable land of 118km2. This could be an explanation for the overwintering mortality of honey bees observed in Glenny et al. (2017), or could contribute along with other factors to observed the bee loss. While these overlaps did not take into account the time of year which the applications occurred to see whether they overlapped temporally with the presence of migratory hives, the environmental persistence of this class of pesticides means we can assume that at least some amount of the chemical or a toxic byproduct still persisted in the soil when bees were present (Bonmatin et al. 2015)(Tosi et al., 2017). These finding demonstrate that further understanding of how proximity of pesticide applications to honey bee hives year round is needed, and the resulting map displays those areas that are most in need of evaluation and conservation efforts. | |||
|
Conclusions As always, there is more research to be done before we can determine with certainty the cause of such a complex environmental issue, and before we can decide on the best course of action to conserve our rich and valuable ecology. Agricultural honey bees, like the fight surrounding pesticides and California agriculture in general, is a much more complex and contentious issue than it initially seems. However, this research demonstrates that looking at these spatial relationships between factors could be hugely helpful in decision making in the future, and that graphically displaying such large datasets can help narrow down the areas that most need help. These methods could be expanded upon to show the interaction of pesticides, foraging ground and preferred crops, competition and diseases with bee loss numbers and hive locations to help explain the phenomenon we are seeing. | |||
|
References Bonmatin et al., “Environmental fate and exposure; neonicotinoids and fipronil”, Environmental Science and Pollution Research International (2015) California Department of Pesticide Regulation, cdpr.ca.gov, accessed Oct 2017 California Pesticide Information Portal (CalPIP), calpip.cdpr.ca.gov, accessed Oct 2017 Glenny et al., “Honey bee (Apis mellifera) colony health and pathogen composition in migratory beekeeping operations involved in California almond pollination”, PLOS one (2017) Klein et al., “Importance of pollinators in changing landscapes for world crops”, Proc Biol Sci (2007) Otto, Roth, Carlson, and Smart, “Land-use change reduces habitat suitability for supporting managed honey bee colonies in the Northern Great Plains”, PNAS (2016) Tosi, Burgio, and Nieh, “A common neonicotinoid pesticide, thiamethoxam, impairs honey bee flight ability”, Scientific Reports (2016) USGS, “Honey Bee Helpers: It Takes a Village to Conserve a Colony”, www.usgs.gov/news (2016) USDA, National Agricultural Statistics Service, 2007 California Cropland Data Layer, accessed Oct 2017
| | ||